
ACWI and EEM
Since the election in the first week of November, U.S. equities had a strong performance. Though, strong rally in U.S. equities has been limited to very few sectors. ACWI ETF (underlying instrument: MSCI All Countries World index that tracks the performance of the 23 developed and 23 emerging markets) has been in a correction since the beginning of September. EEM ETF (underlying instrument: MSCI Emerging Markets index) broke down two major support levels, a year-long upward trend line and a horizontal support at 35.88 levels.
There is a possibility of the latest downward trend channel to form a flag continuation and breakout higher without breaching the year-long uptrend on the ACWI ETF. However, failure to do so can result in a similar price action that we have seen on the EEM; a breakdown of the year-long trend line support. Both charts suggest that equity market strength is limited to U.S. equities and in the U.S. markets it is limited to very few sectors.
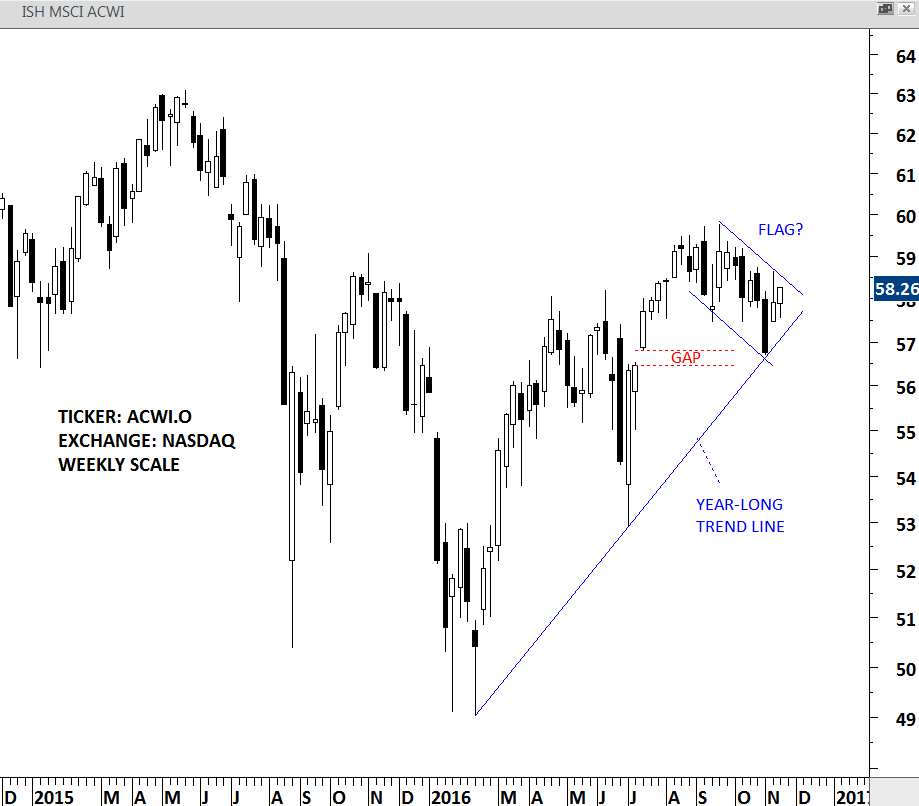
ACWI ETF weekly scale price chart
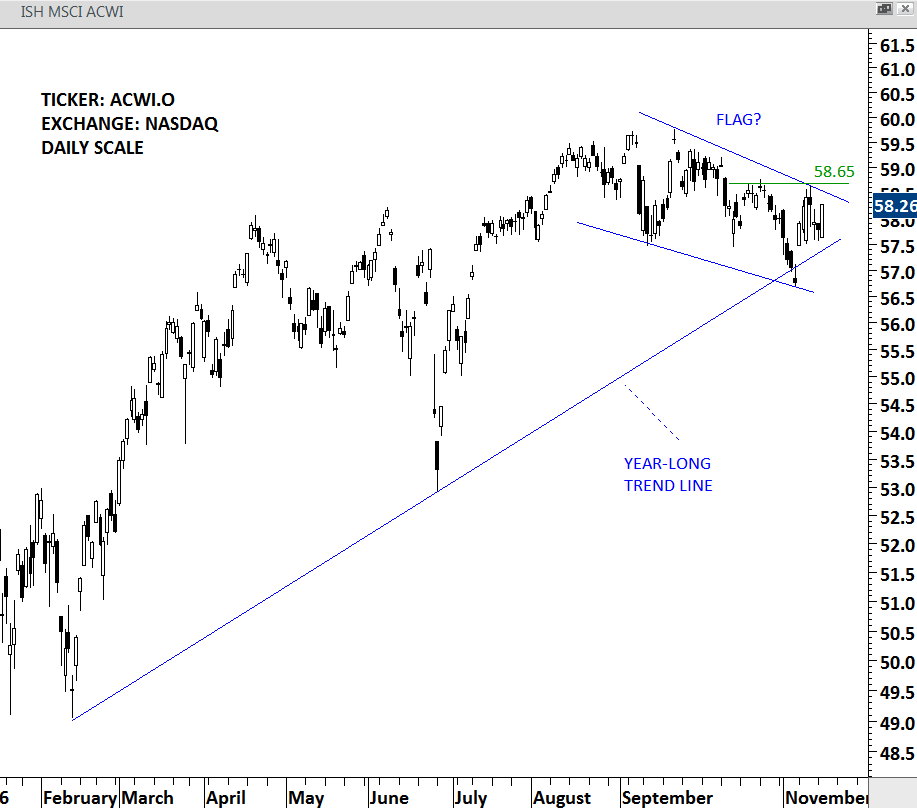
ACWI ETF daily scale price chart
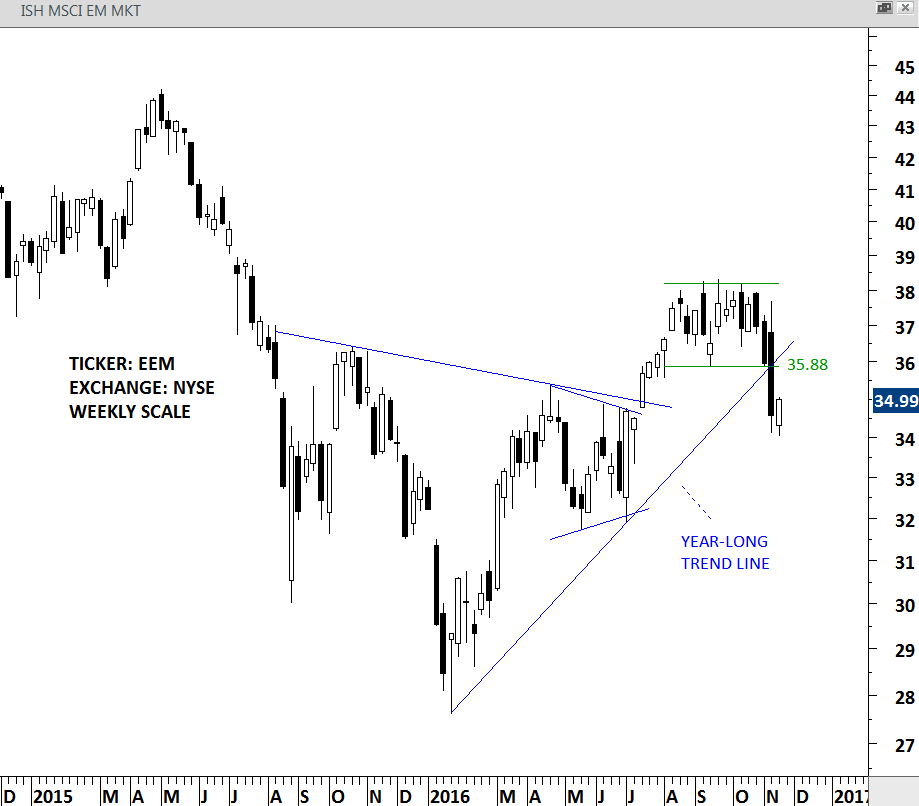
EEM ETF weekly scale price chart