GLOBAL EQUITY MARKETS-11/02/2017
This week’s update highlights 3 major technical developments. These themes can be seen in the TECHCHARTSWATCHLIST and TECHCHARTSALERT.
- Russell 2000 Index is breaking out of its month-long flag continuation
- EUROPE STOXX 600 index is preparing for a breakout from its short-term consolidation
- HONG KONG & CHINA equities are gaining strength with clear breakout signals and breakout candidates
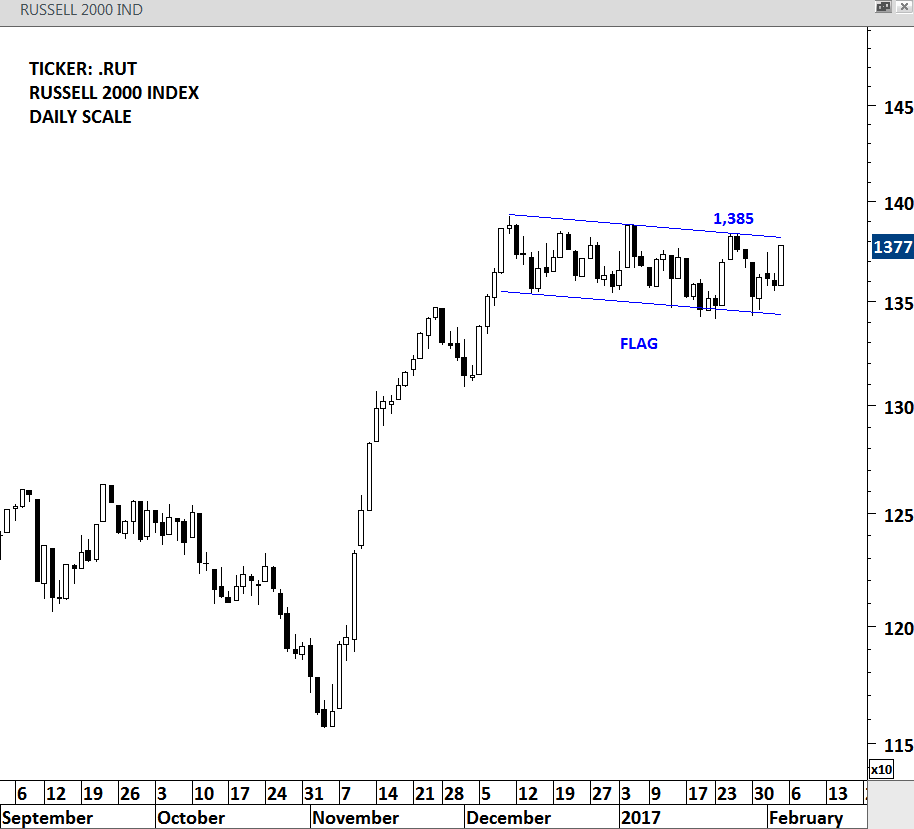
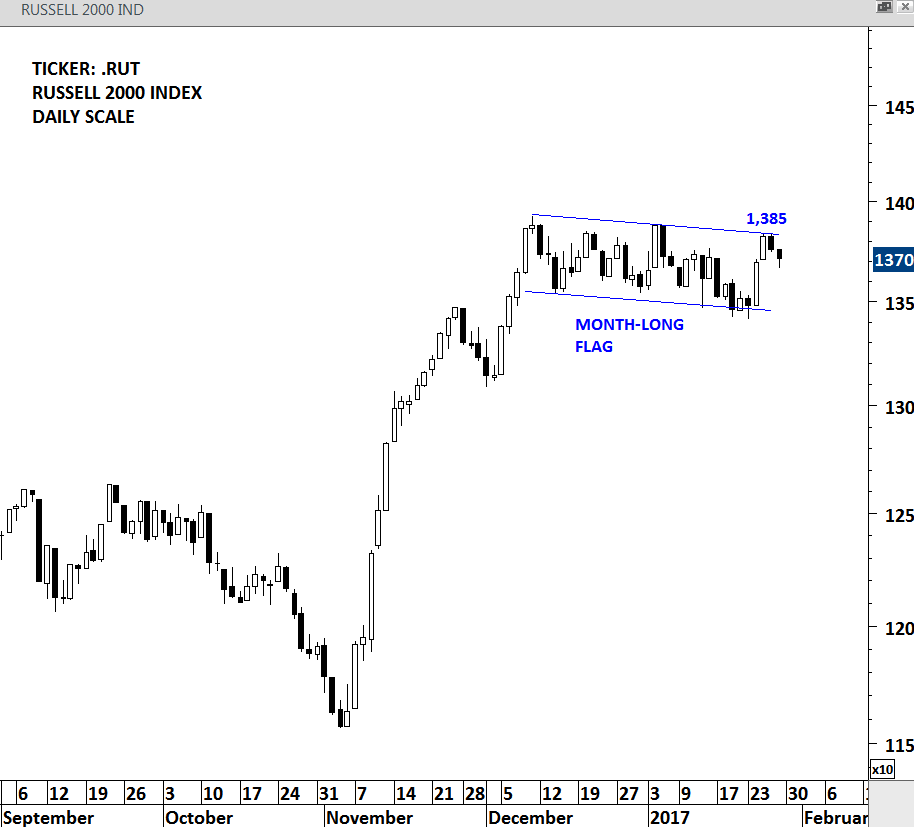
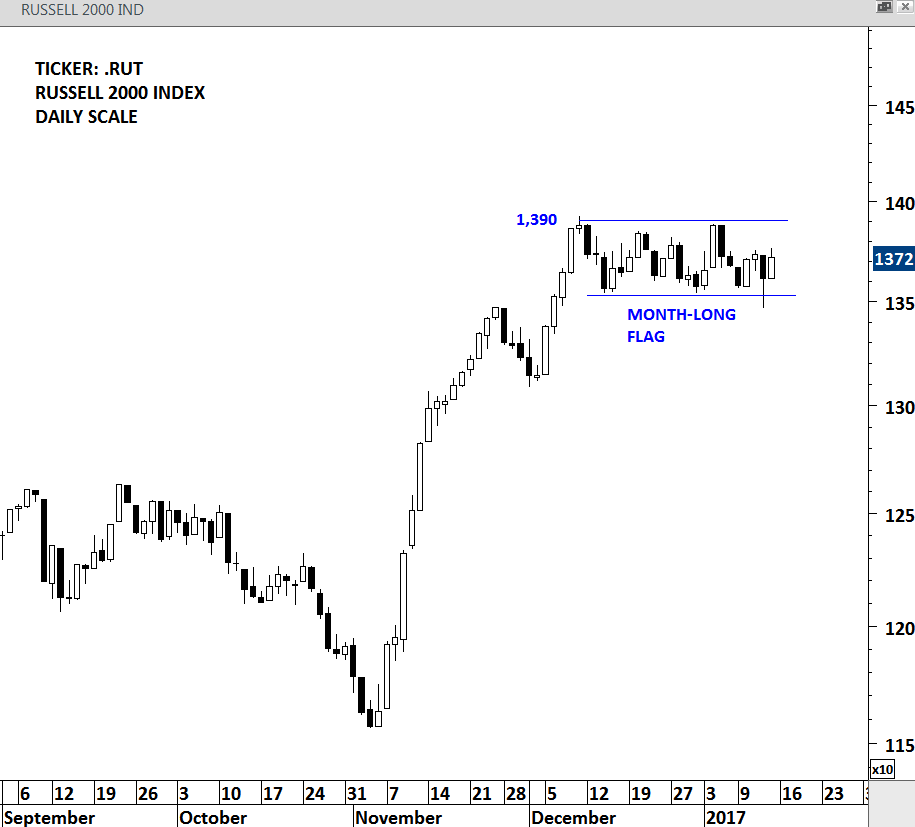
Russell 2000 index broke out of its month-long flag consolidation on Friday. The small-cap benchmark equity index should take out the minor high at 1,392 to add further momentum to the recent breakout. Outlook is positive for U.S. equities.
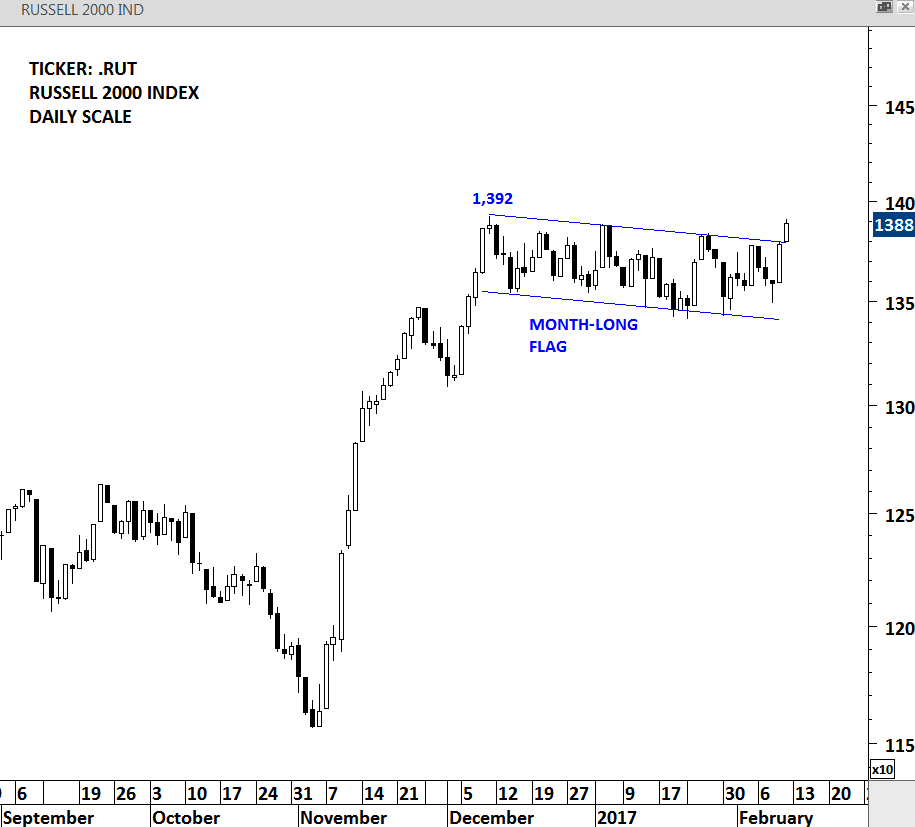
RUSSELL 2000 INDEX – DAILY SCALE
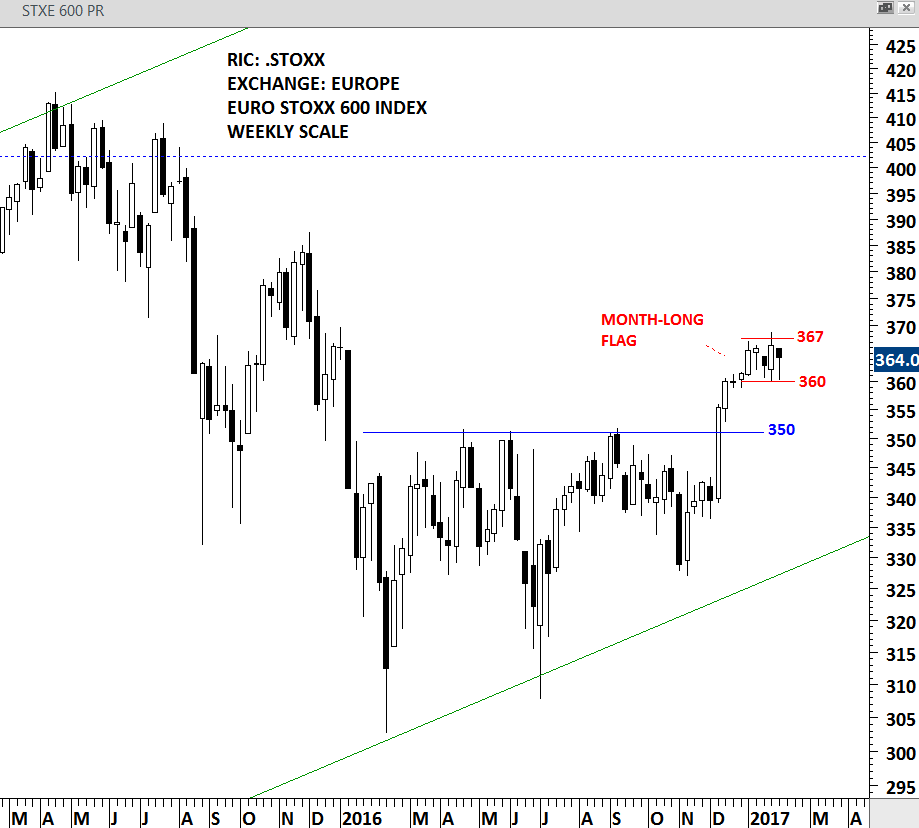
Europe’s STOXX 600 index remained range-bound and closed at the upper end of its month-long consolidation. Latest consolidation can be identified as a continuation flag. Breakout above 367 levels will confirm the bullish continuation chart pattern and suggest higher levels for the European equities in the coming weeks. This update features the iSHARES STOXX 600 ETF that is listed in Germany. The ETF has a similar technical outlook. The upper boundary of the month-long consolidation is at 36.73 levels for the Ishares STOXX 600 ETF.
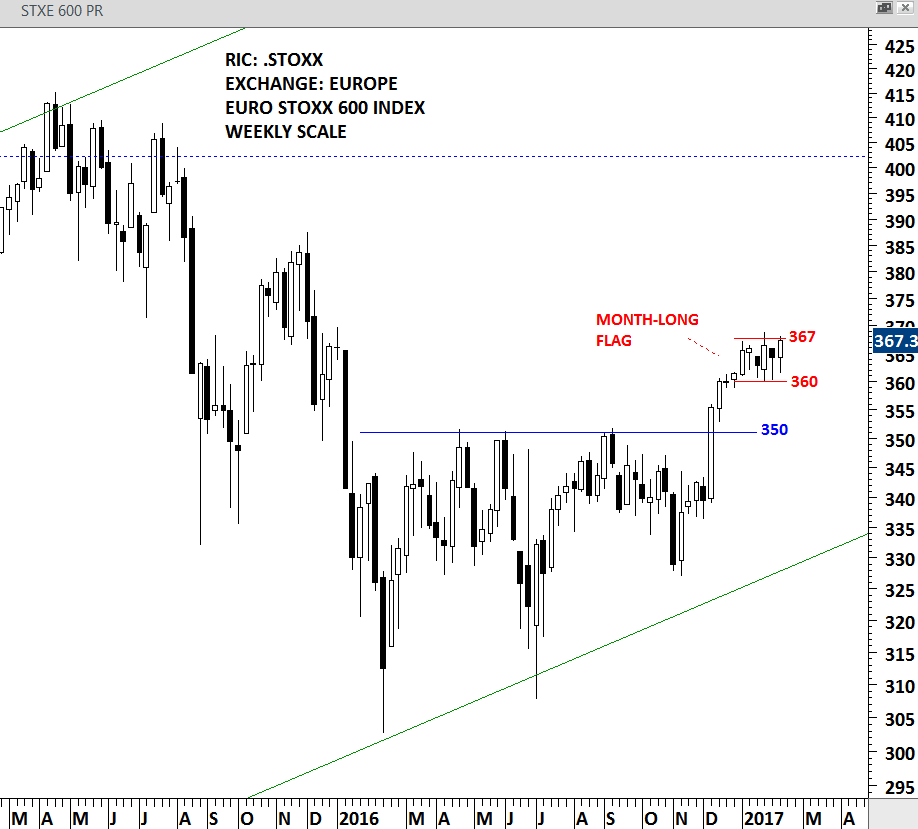
EUROPE STOXX 600 – WEEKLY SCALE
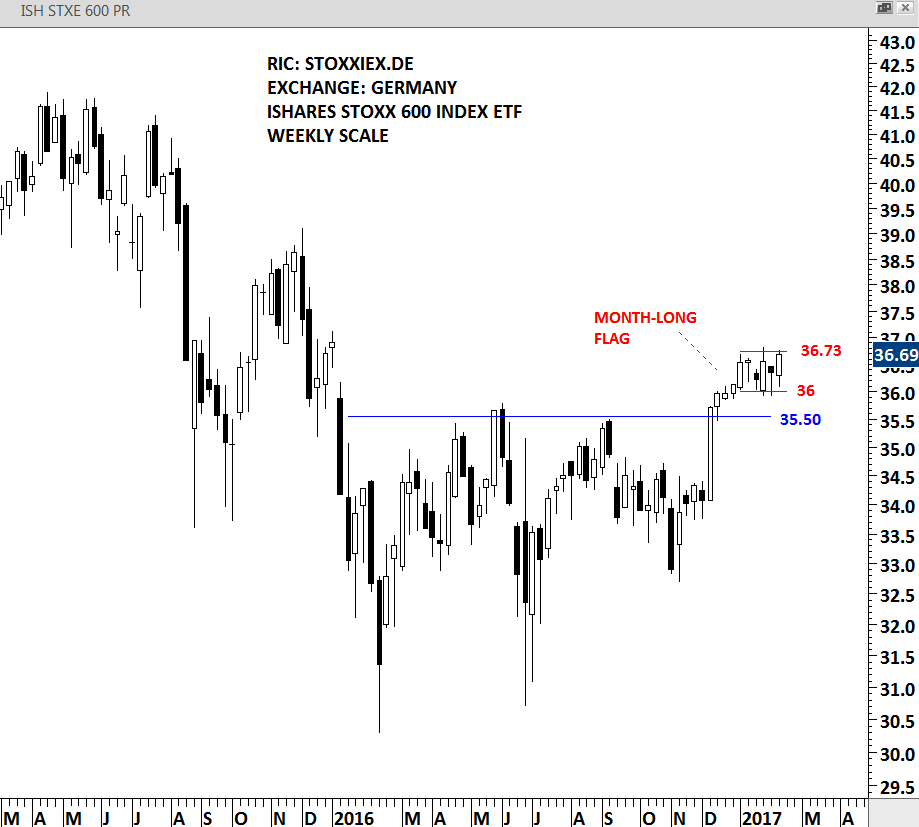
ISHARES STOXX 600 ETF – WEEKLY SCALE
#TECHCHARTSWATCHLIST
HARBIN BANK (6138.HK)
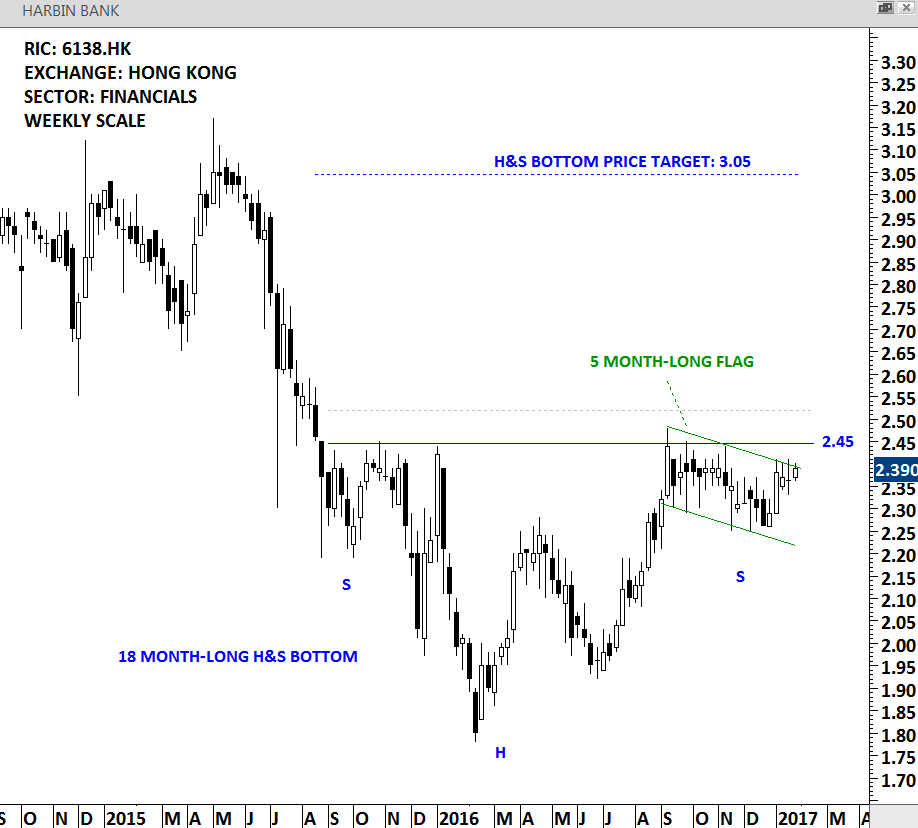
A common chart pattern that is clearly visible on the Hong Kong/China banking & financial stocks is a multi-month H&S bottom reversal. HARBIN BANK is a Hong Kong based investment holding company. Price chart of the stock formed an 18 month-long H&S bottom with the strong horizontal resistance standing at 2.45 levels. The right shoulder of the multi-month H&S bottom took the form of a bullish flag. HARBIN BANK closed the week at the neckline of its multi-month H&S bottom. A daily close above 2.52 levels will confirm the breakout from the major base formation.
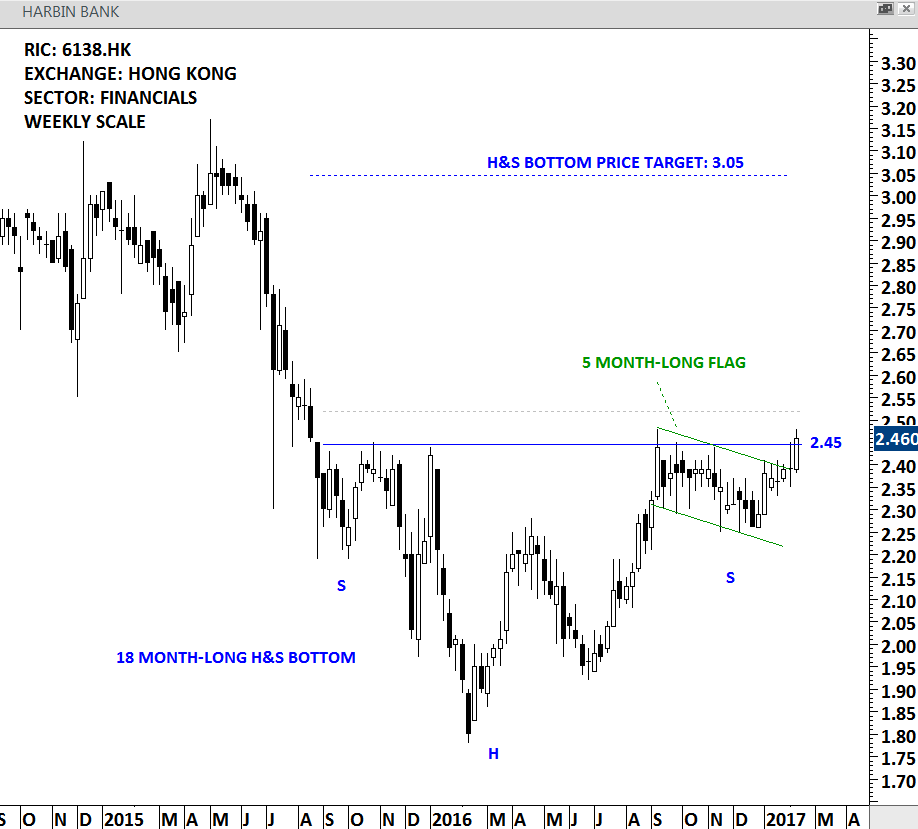
HARBIN BANK – WEEKLY SCALE
INDUSTRIAL AND COMMERCIAL BANK OF CHINA (1398.HK)
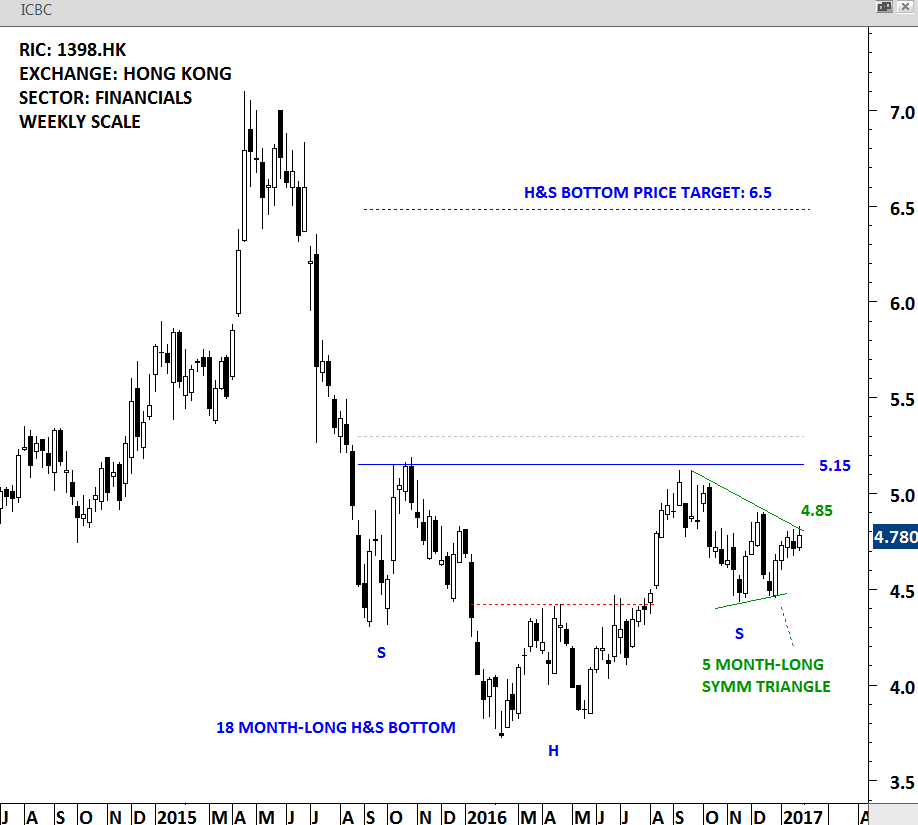
ICBC is principally involved in the provision of banking and related financial services. It is listed on the Hong Kong Stock Exchange. Similar to several banking and financial stocks listed on the Hong Kong Stock Exchange, ICBC is also forming a multi-month H&S bottom with the strong horizontal resistance standing at 5.15 levels. Stock has a short-term resistance at 4.90. Breakout above 4.90 will set the initial target as 5.15.

ICBC – WEEKLY SCALE
CQRC BANK (3618.HK)
Chongqing Rural Commercial Bank is engaged in the provision of banking services and related financial services in China. Stock is listed on the Hong Kong stock exchange. Price chart of CQRC BANK formed a long-term base formation similar to other financial/bank stocks in Hong Kong. Multi-month H&S bottom has a horizontal resistance at 5.10 levels. A daily close above 5.25 levels will confirm the breakout. H&S bottom price target stands at 6.6 levels.
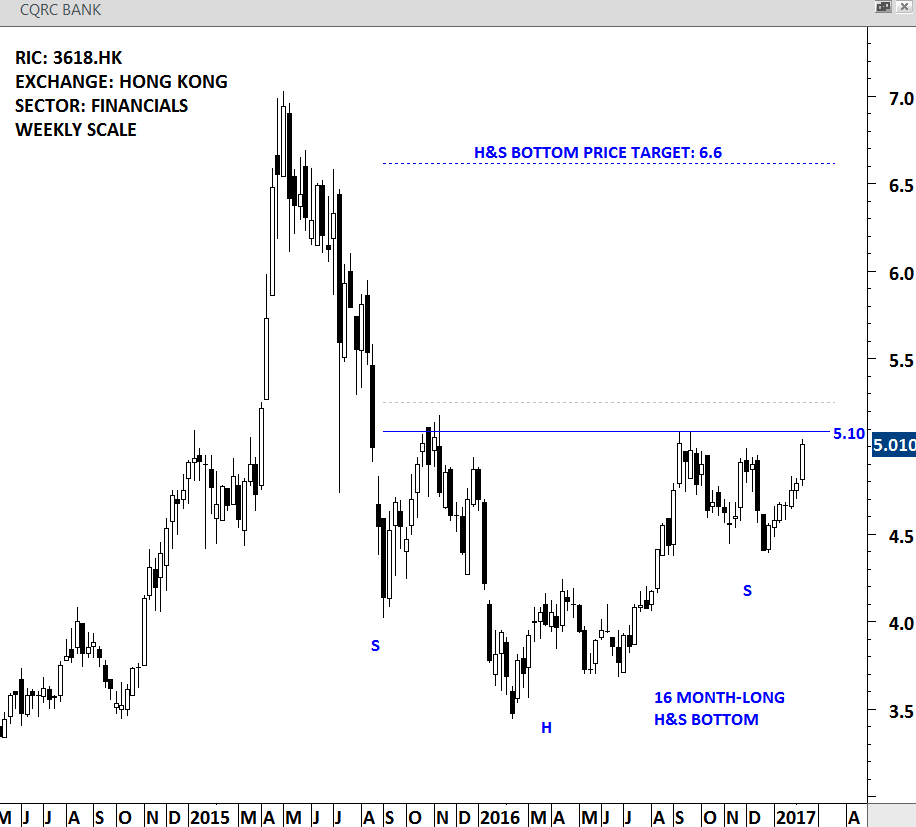
CQRC BANK – WEEKLY SCALE
BANK OF CHINA (3988.HK)
Last but not least BANK OF CHINA another Hong Kong listed banking stock forms a similar 16 month-long H&S bottom with a downward sloping neckline which is standing at 3.8 levels. A daily close above 3.88 levels will confirm the breakout from the multi-month bullish reversal. Chart pattern price target stands at 4.65 levels.
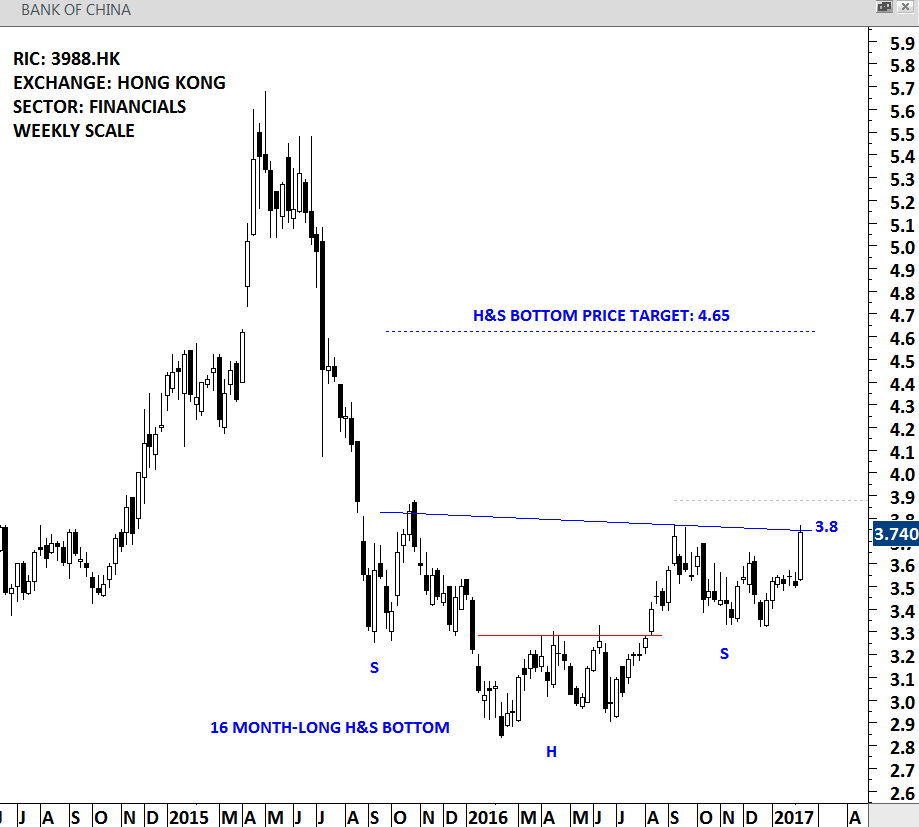
BANK OF CHINA – WEEKLY SCALE
CHINA MERCHANTS CHINA DIRECT INVESTMENTS LTD (0133.HK)
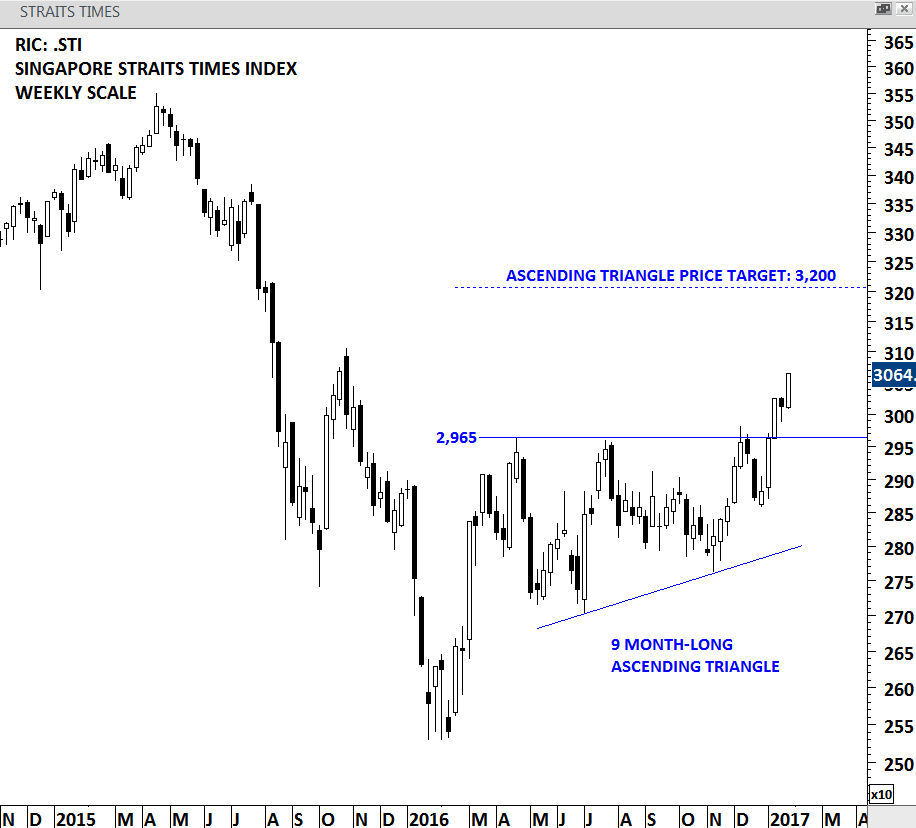
China Merchants China Direct Investments Limited is a Hong Kong-based investment holding company principally engaged in financial investment. Price chart of CHINA MERCHANTS formed a 9 month-long bullish ascending triangle with the horizontal resistance standing at 12.05 levels. This week’s close was at the chart pattern boundary. A daily close above 12.40 will confirm the breakout from the bullish continuation chart pattern with a possible price target of 14.
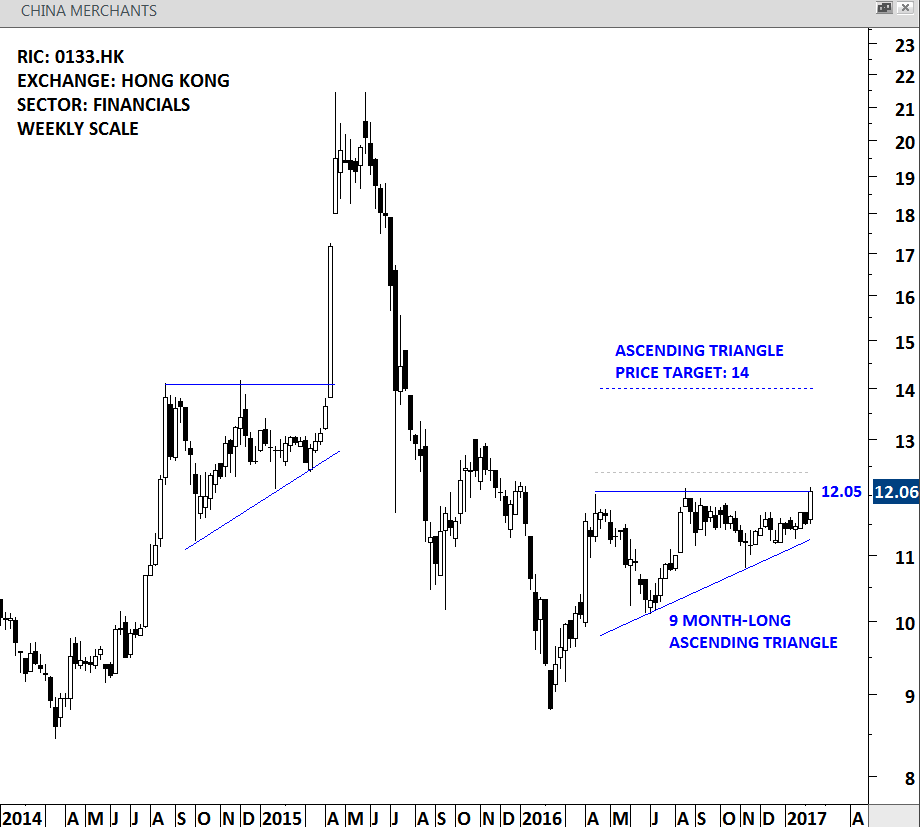
CHINA MERCHANTS – WEEKLY SCALE
LINGBAO GOLD (3330.HK)
Lingbao Gold Company Limited is principally engaged in the mining, processing, smelting and sales of gold and other metallic products in the People’s Republic of China (the PRC). The stock is listed on the Hong Kong stock exchange. Price chart formed a 5 month-long symmetrical triangle with the resistance at 1.98. A daily close above 2.04 levels will confirm the breakout from the continuation chart pattern.
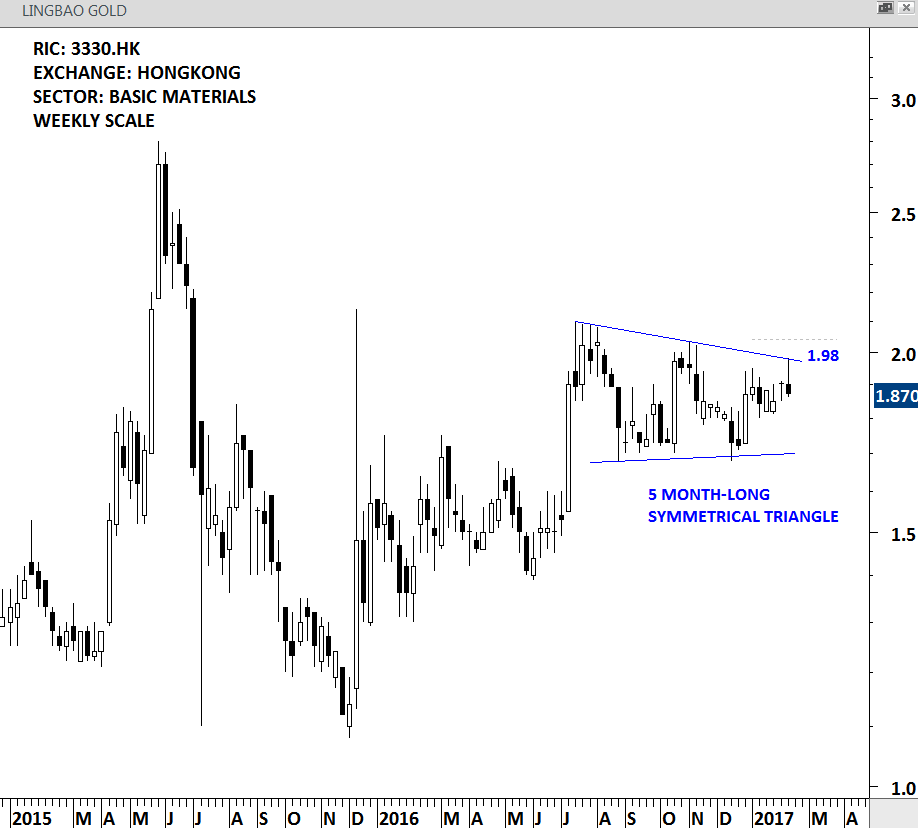
LINGBAO GOLD – WEEKLY SCALE
APOLLO INVESTMENT CORP (AINV.O)
Apollo Investment Corporation is a closed-end, externally managed, non-diversified management investment company. It is listed on the Nasdaq Stock Exchange. Price chart formed a 4 month-long symmetrical triangle with the upper boundary standing at 6.20 levels. A daily close above 6.38 will confirm the breakout from the 4 month-long consolidation.
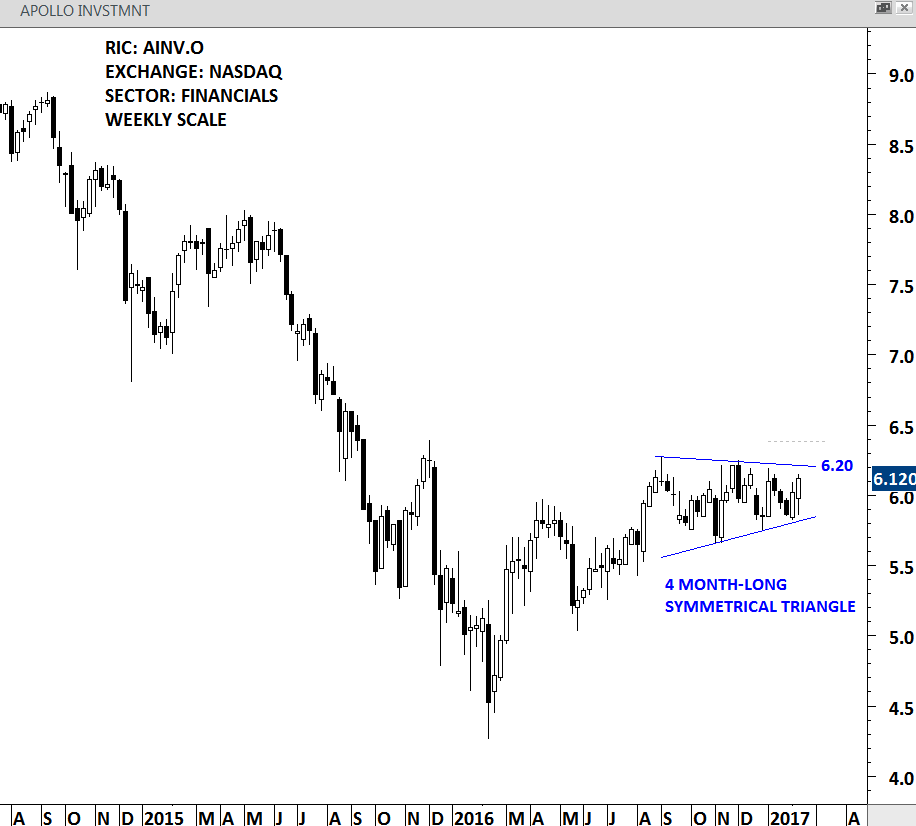
APOLLO INVESTMENT – WEEKLY SCALE
SPDR S&P INTERNATIONAL DIVIDEND ETF (DWX)
SPDR S&P INTERNATIONAL DIVIDEND ETF seeks to replicate as closely as possible, before expenses, the price and yield performance of an index that tracks exchange-listed common stocks domiciled in countries outside the United States that offer high dividend yields. The ETF is listed on the NYSE Arca. Price chart of DWX formed a 15 month-long ascending triangle with the strong horizontal resistance standing at 37.45 levels. Over the past 15 months the horizontal resistance was tested for 6 times. Ascending triangle is a bullish chart pattern and it can resolve as a major bottom reversal. A daily close above 38.20 will confirm the breakout from the multi-month consolidation. Ascending triangle price target stands at 45 levels.
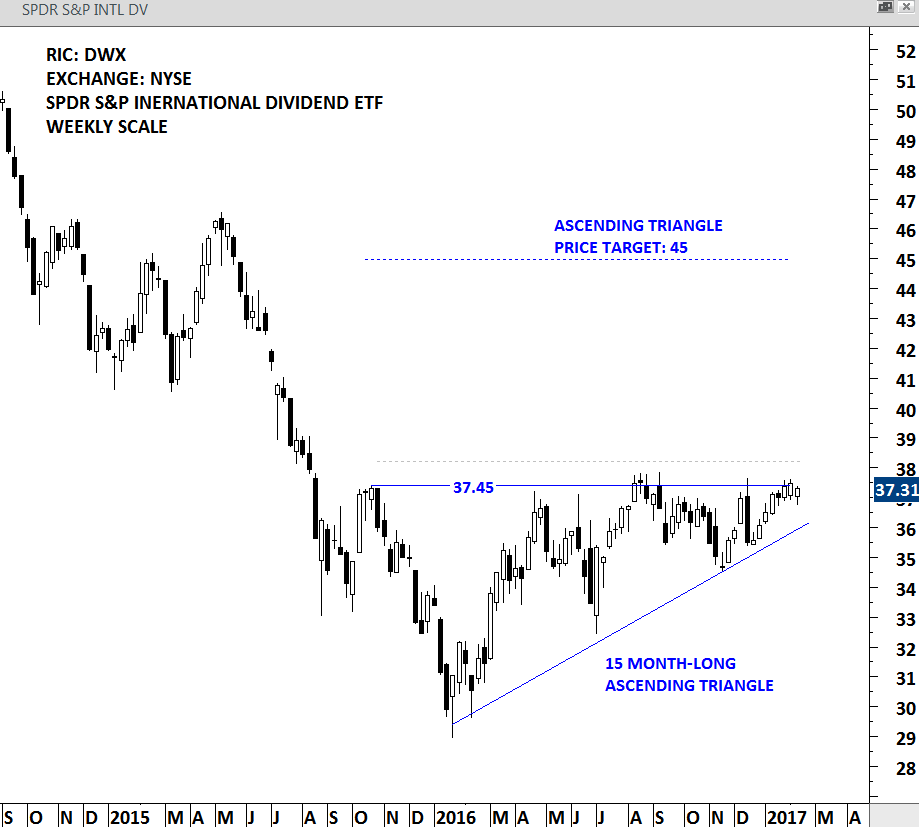
SPDR S&P INTL DIV ETF – WEEKLY SCALE
There were 4 new breakouts this week that are moved from the TECHCHARTSWATCHILST to the TECHCHARTSALERT. Below are the stocks that completed their chart patterns.
#TECHCHARTSALERT
ZEPAK (ZEEP.WA)
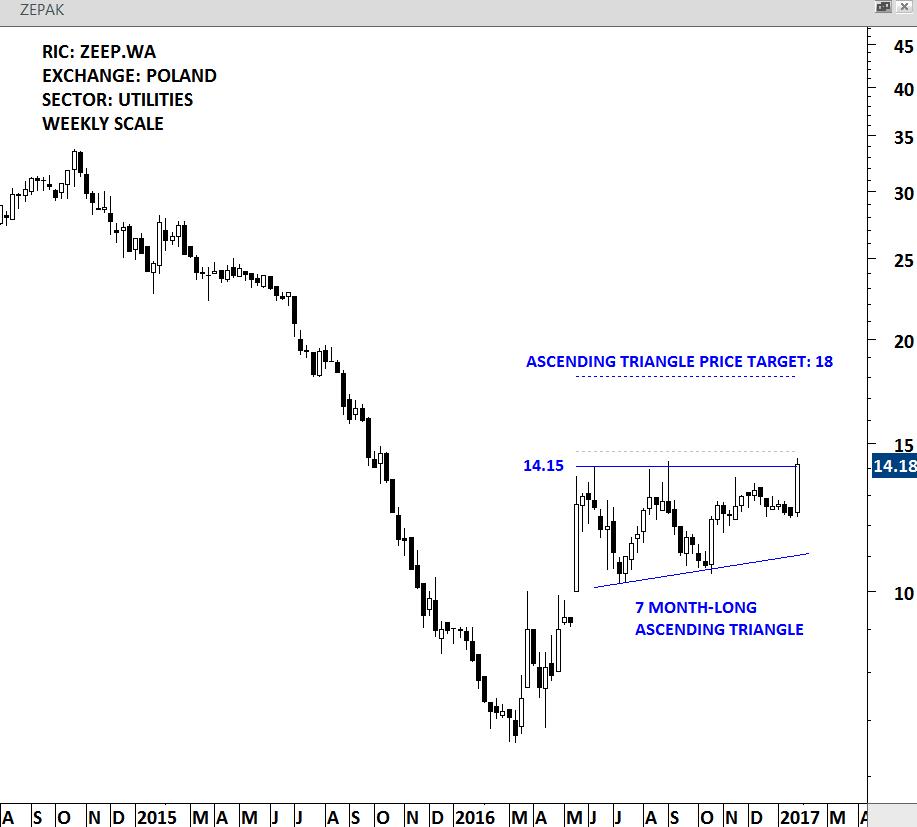
Zespol Elektrowni Patnow Adamow Konin SA is a Poland based company engaged in the electricity sector. The stock is listed on the Warsaw Stock Exchange. Price chart formed a 7 month-long ascending triangle with the strong horizontal resistance standing at 14.15 levels. This week’s price action cleared the strong resistance. While the ascending triangle price target stands at 18 levels, strong weekly breakout could be the beginning of a larger scale uptrend that can carry the price towards 20-25 area.
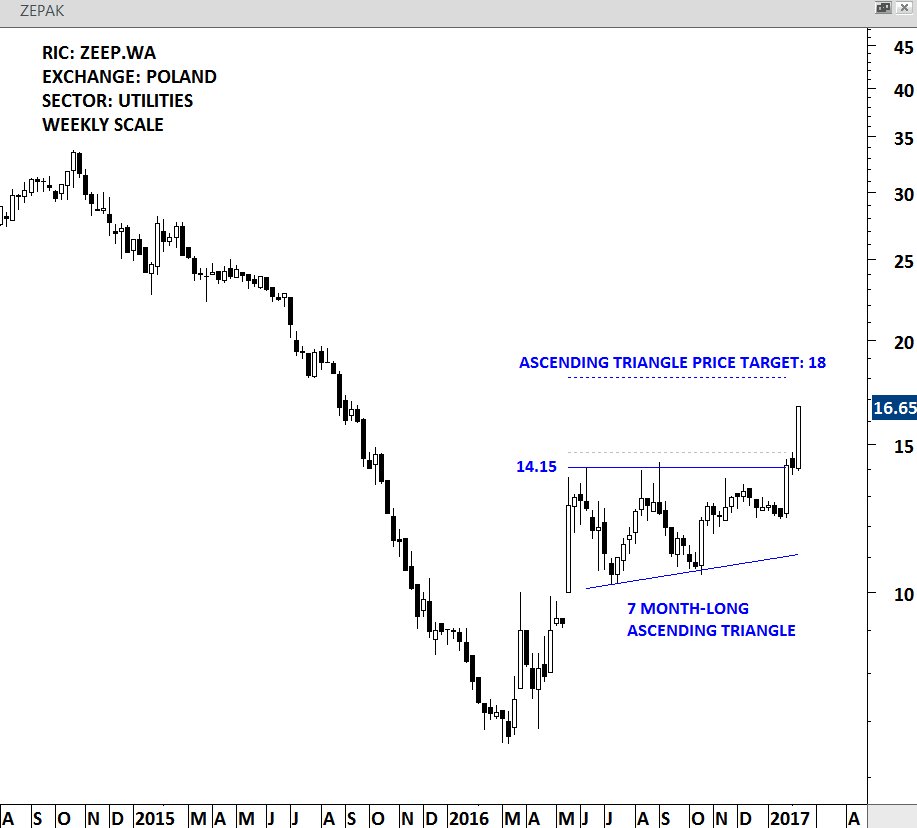
ZEPAK – WEEKLY SCALE
CHINA TAIPING INSURANCE (0966.HK)
China Taiping Insurance Holdings Company Limited is a Hong Kong-based investment holding company principally engaged in insurance businesses. Price chart completed a year-long H&S bottom with a daily close above 18.75 levels. Strong horizontal resistance was at 18.20 levels. H&S bottom price target stands at 22.5 levels.
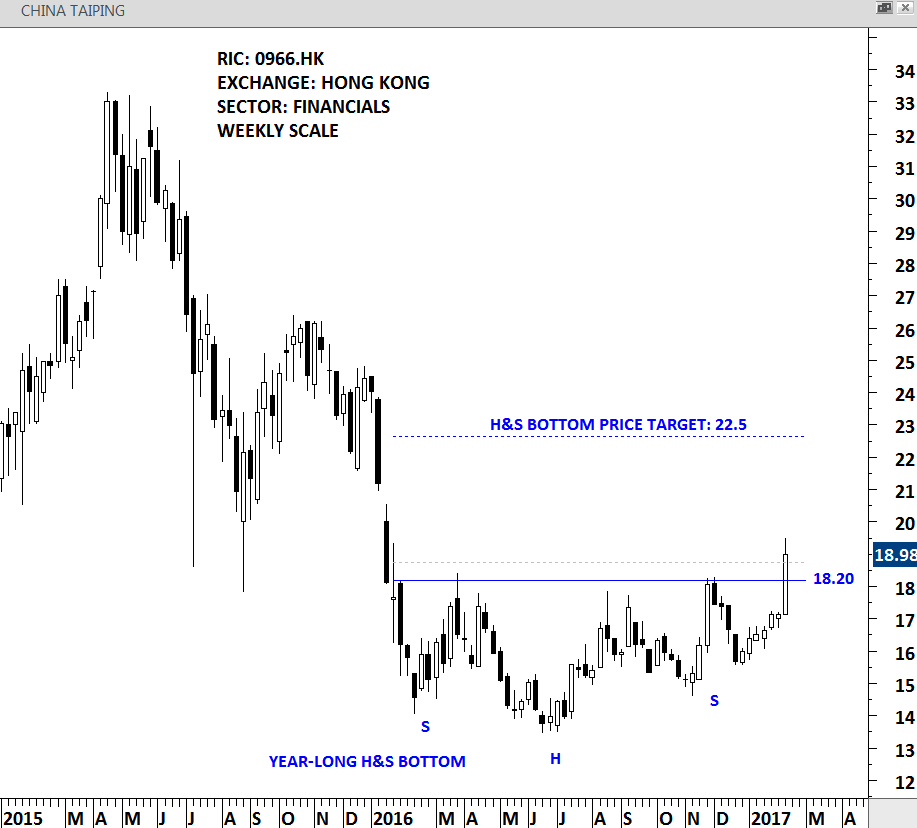
CHINA TAIPING – WEEKLY SCALE
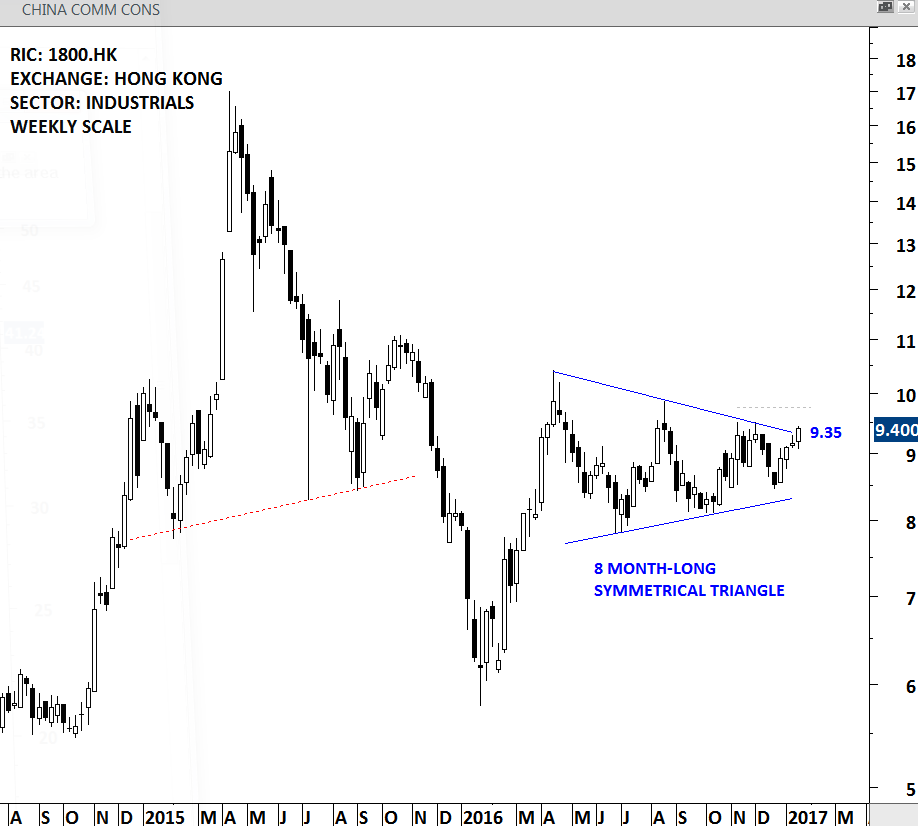
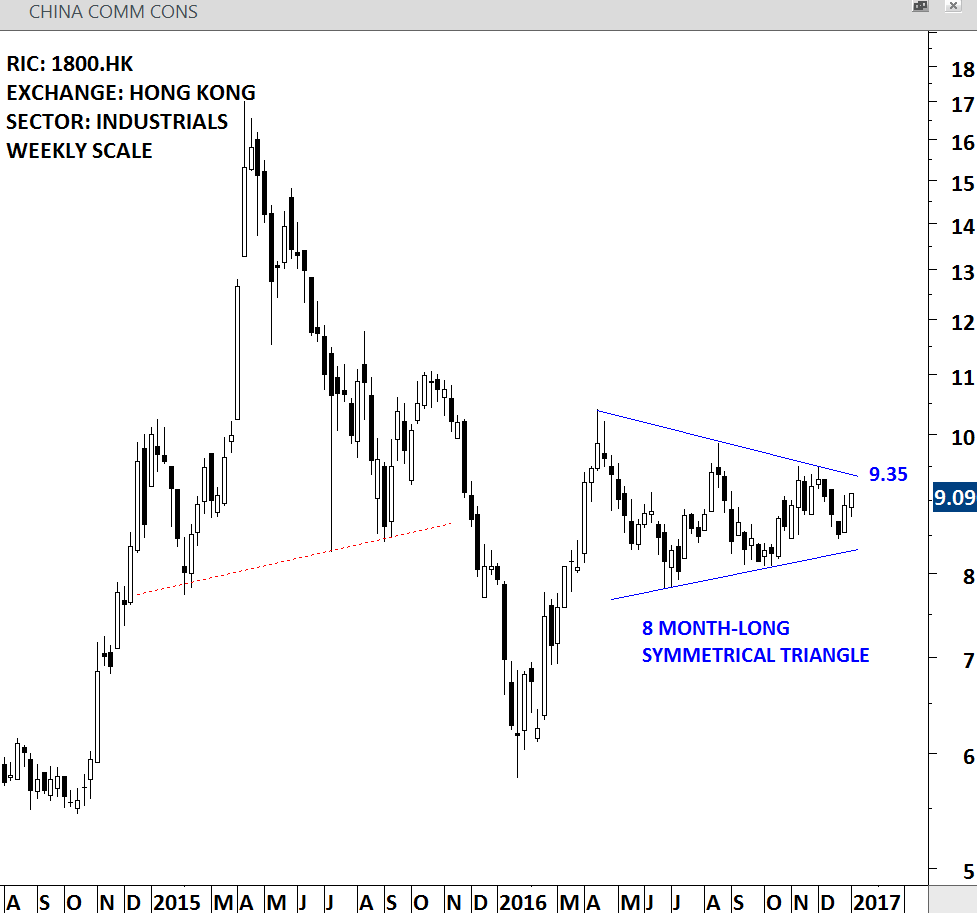
CHINA COMMUNICATIONS CONSTRUCTION (1800.HK)
CHINA COMM CONS. is an industrial company listed on the Hong Kong Stock Exchange. The company is engaged in the infrastructure construction of ports, roads, bridges and railways. The price chart formed a text-book symmetrical triangle. Symmetrical triangles are usually considered to be continuation chart patterns. This week’s strong price action and a close above 9.65 levels confirmed the breakout with a possible chart pattern price target of 12 levels.
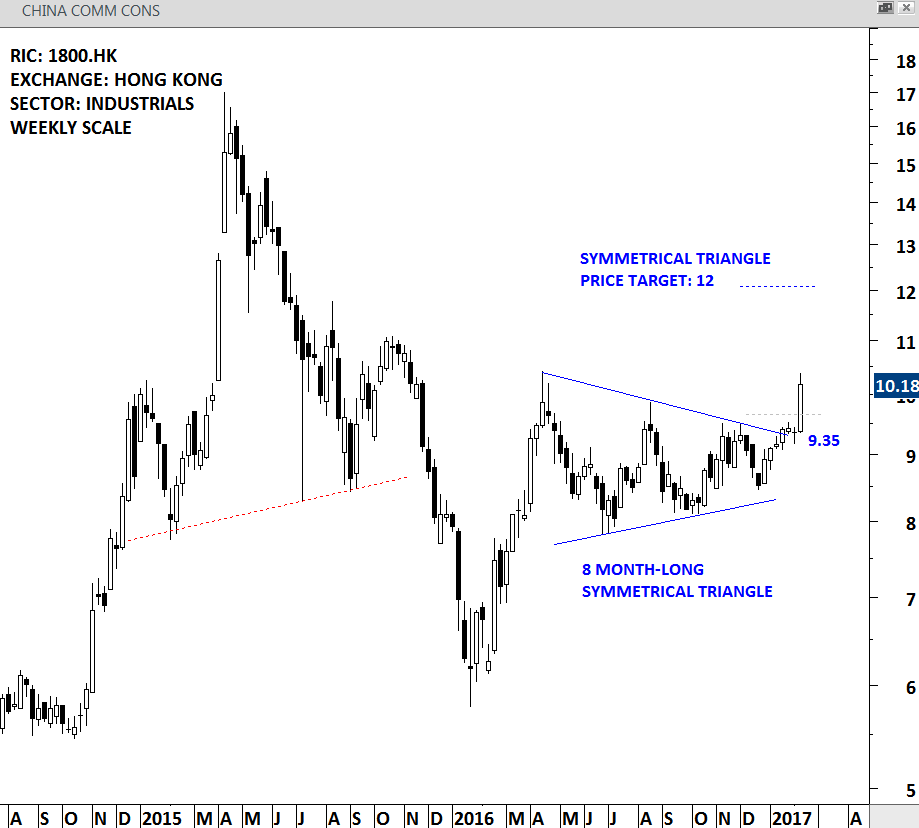
CHINA COMM CONS – WEEKLY SCALE
INTERFOR CORPORATION (IFP.TO)
Interfor Corporation, formerly International Forest Products Limited, is a Canada-based supplier of lumber products. The Company operates through solid wood segment. The Company offers lumber products to customers in North America, the Asia-Pacific region and Europe. Price chart completed a 5 month-long rectangle continuation chart pattern with a possible price target of 18.5 levels. Strong weekly price action can be the beginning of a larger scale uptrend.
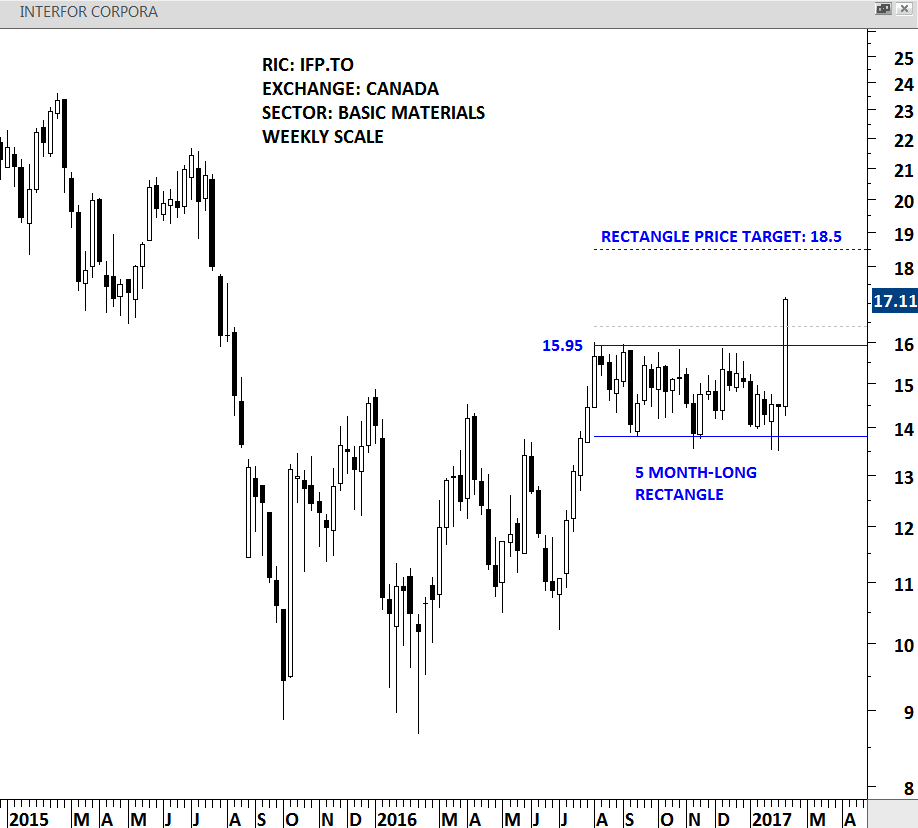
INTERFOR CORPORATION – WEEKLY SCALE