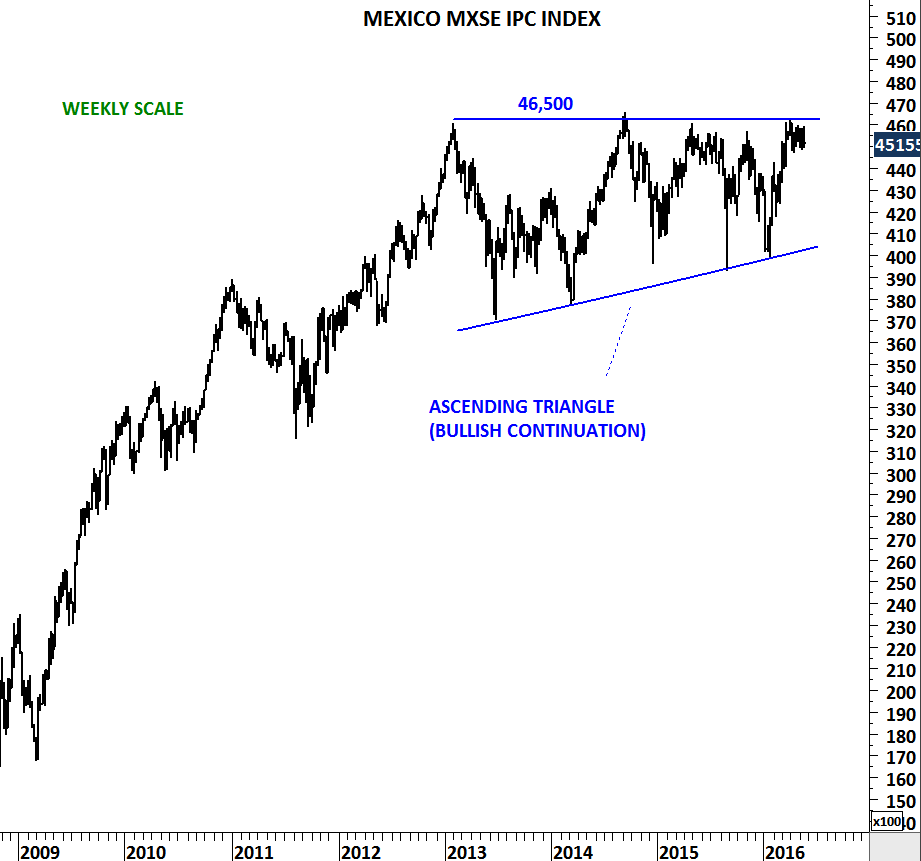
Mexico’s IPC index, denominated in local currency, is preparing for a strong breakout. During Emerging markets poor performance (2011-2016), Mexico outperformed the MSCI Emerging Markets index. Strong relative performance is also reflected on the absolute performance of the IPC index, with the national benchmark now challenging horizontal resistance for the 5th time over the past 3 years. Breakout above strong resistance can push the index to all-time high levels.
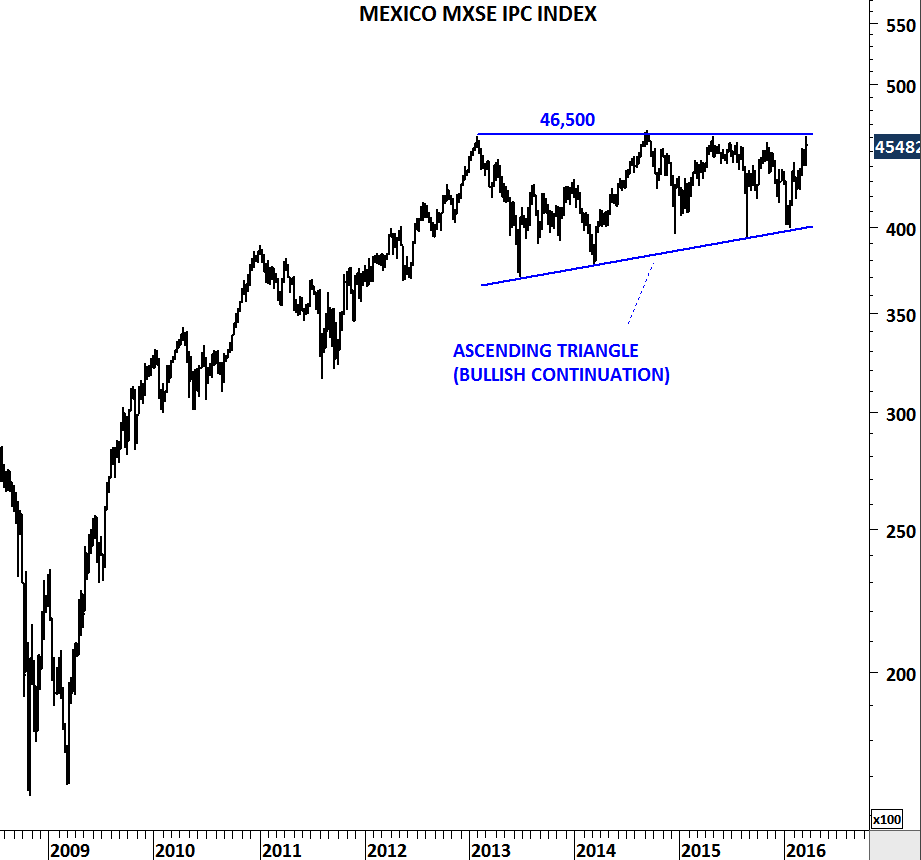
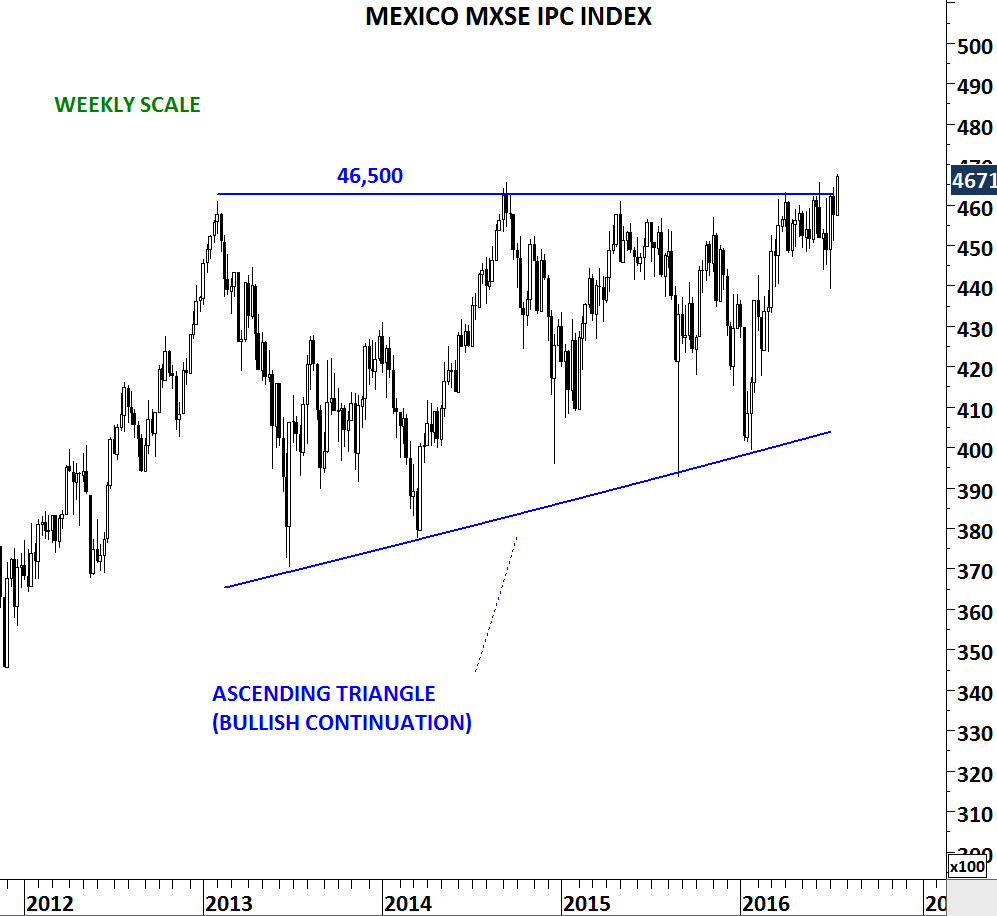
Weekly price chart of the MEXICO IPC INDEX
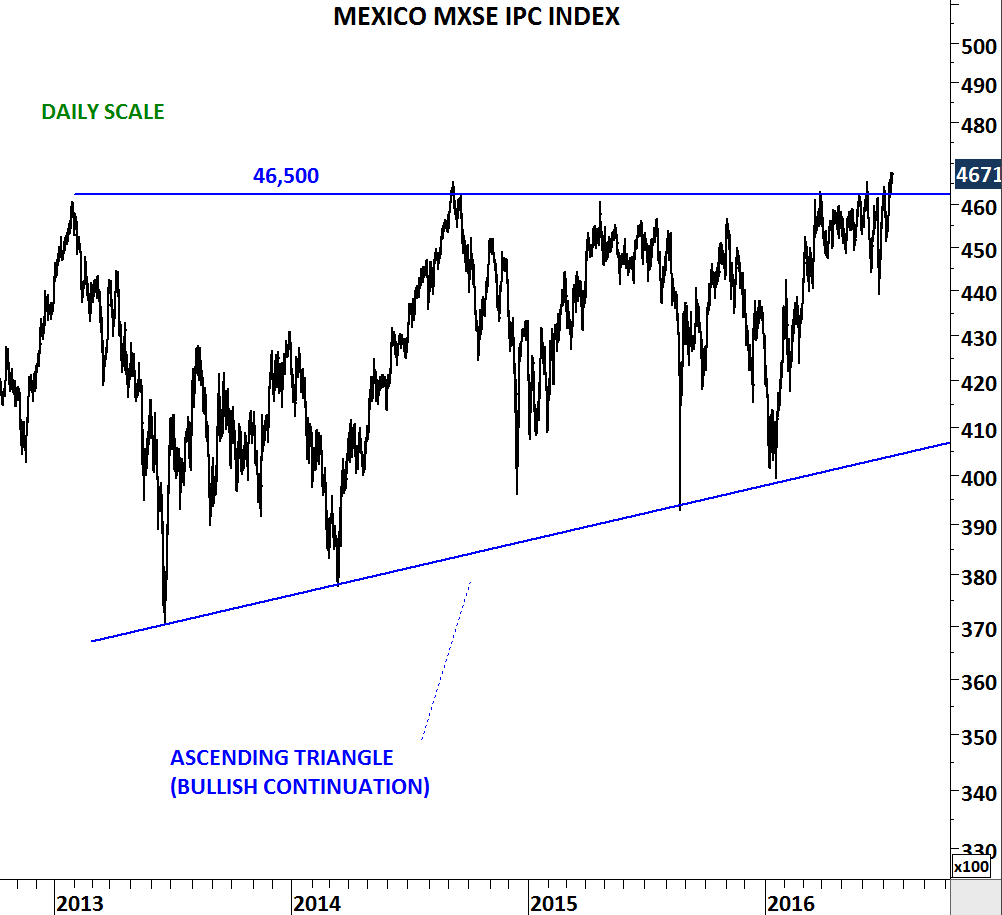
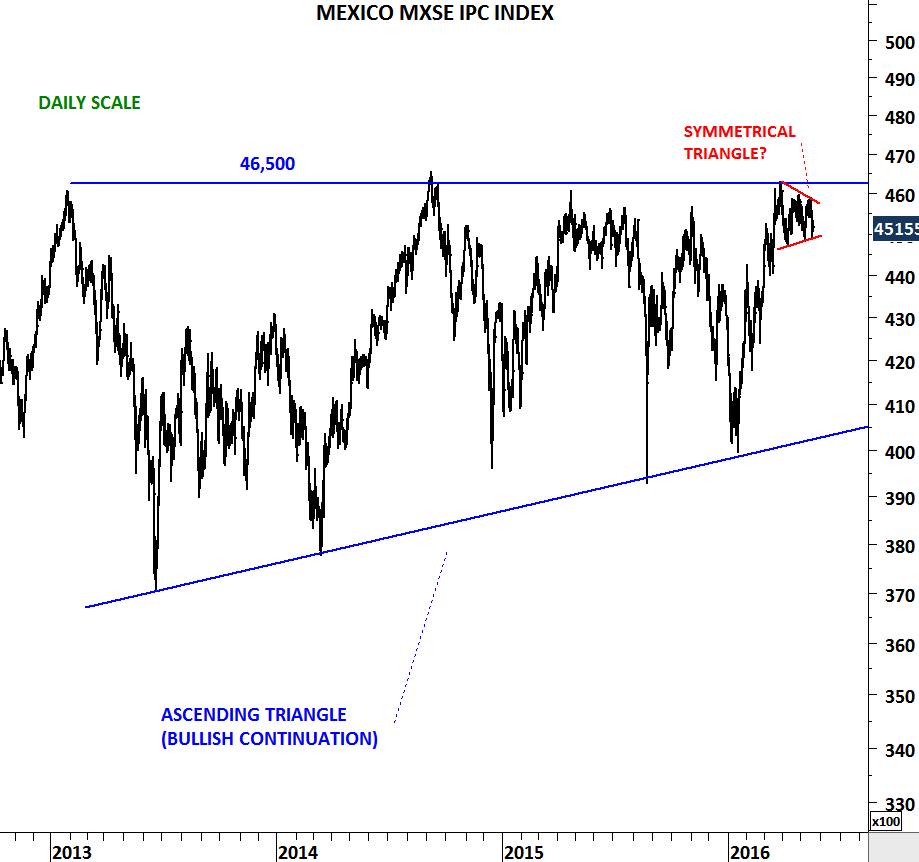
The developing chart pattern could be an ascending triangle with bullish implications. Breakout above 46,500 levels will confirm the bullish chart formation and suggest higher prices that can target 55,000 levels.
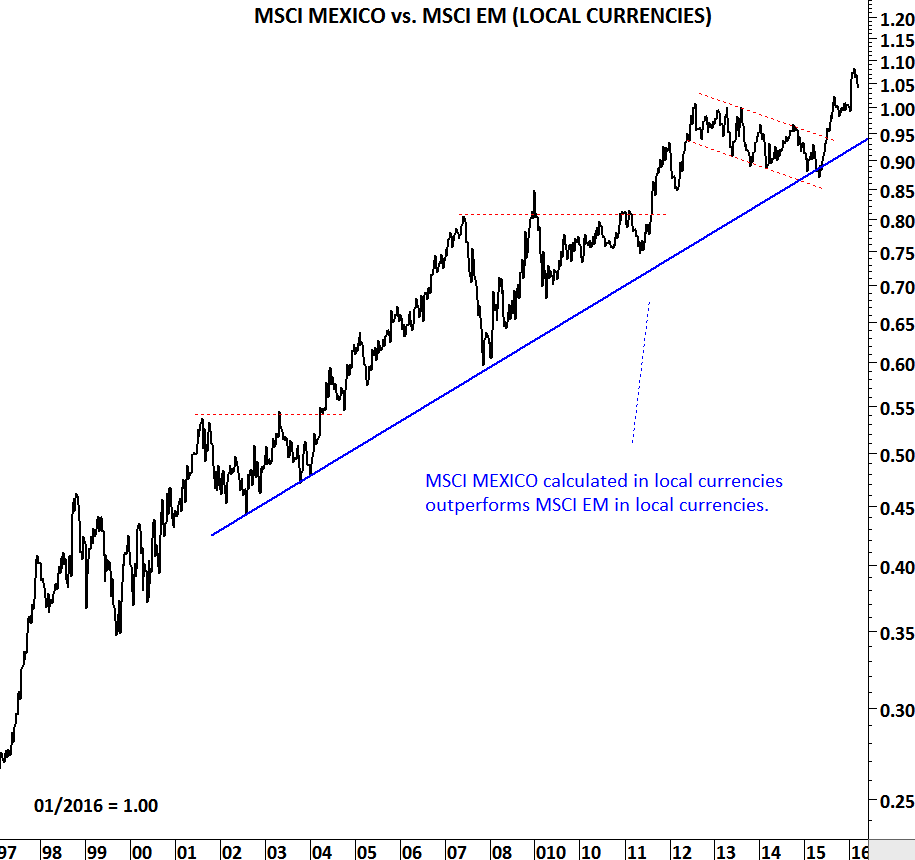
Relative performance ratio between MSCI MEXICO and MSCI EM in local currencies
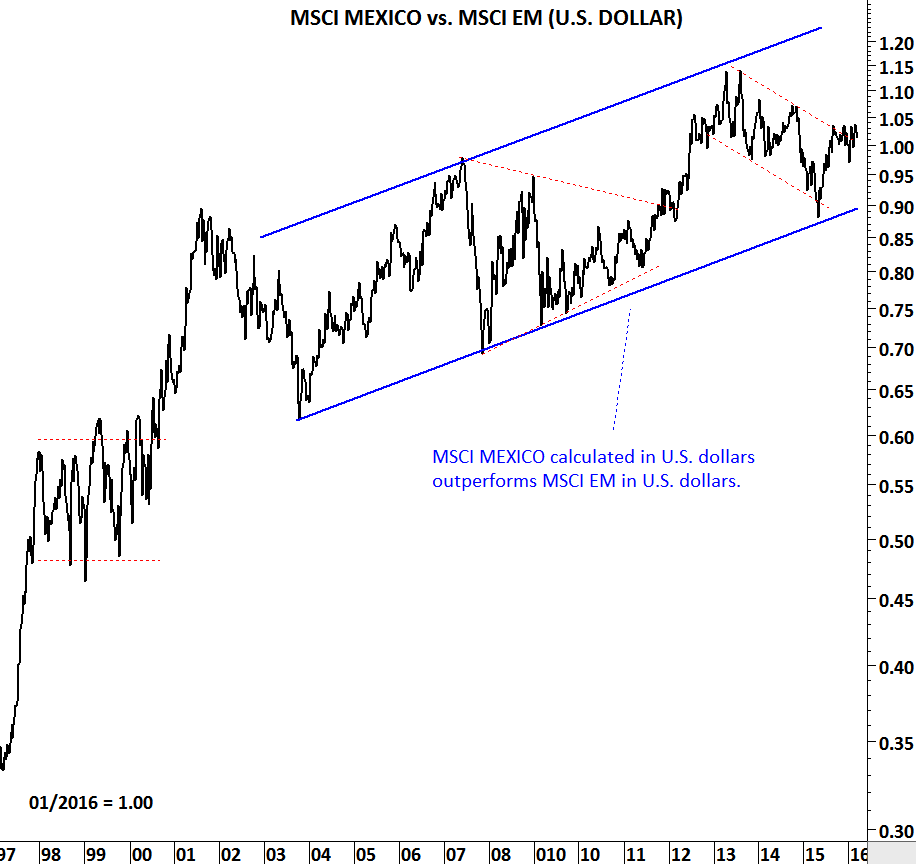
Relative performance ratio between MSCI MEXICO and MSCI EM in U.S. dollar
While the MEXICO IPC INDEX is forming a bullish ascending triangle poised for a breakout to higher levels, here are some of the constituents that have similar bullish chart set ups.
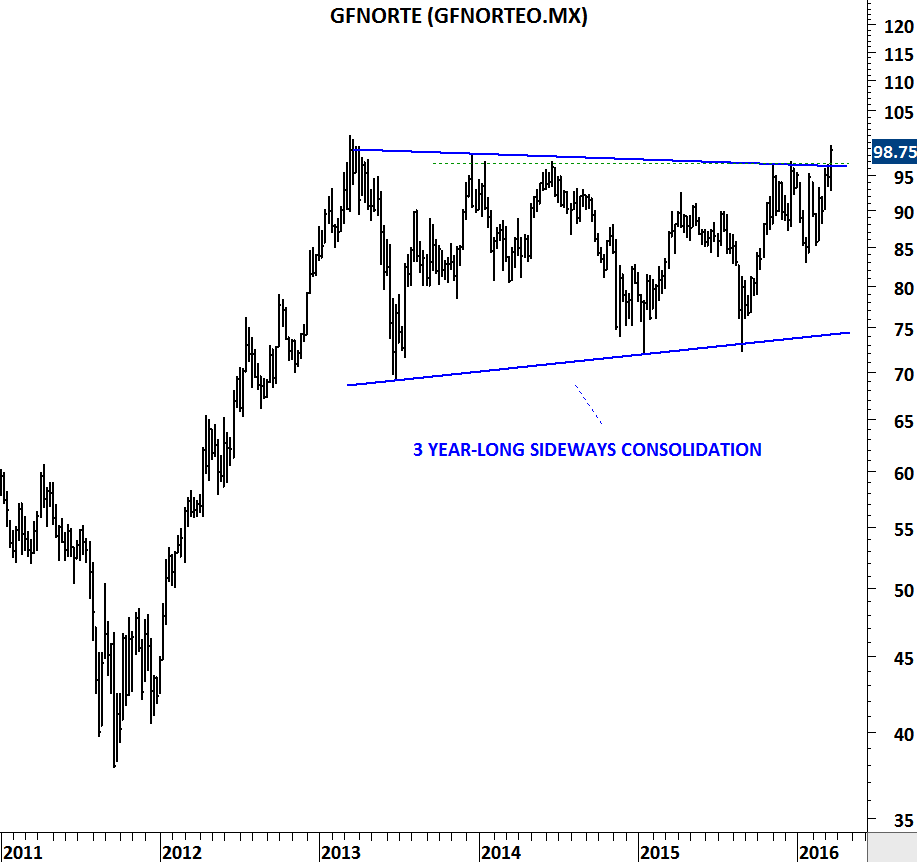
Weekly price chart
GFNORTE formed a 3 year-long sideways consolidation. Stock is now challenging historical high levels. Breakout above 100 levels will be very positive.
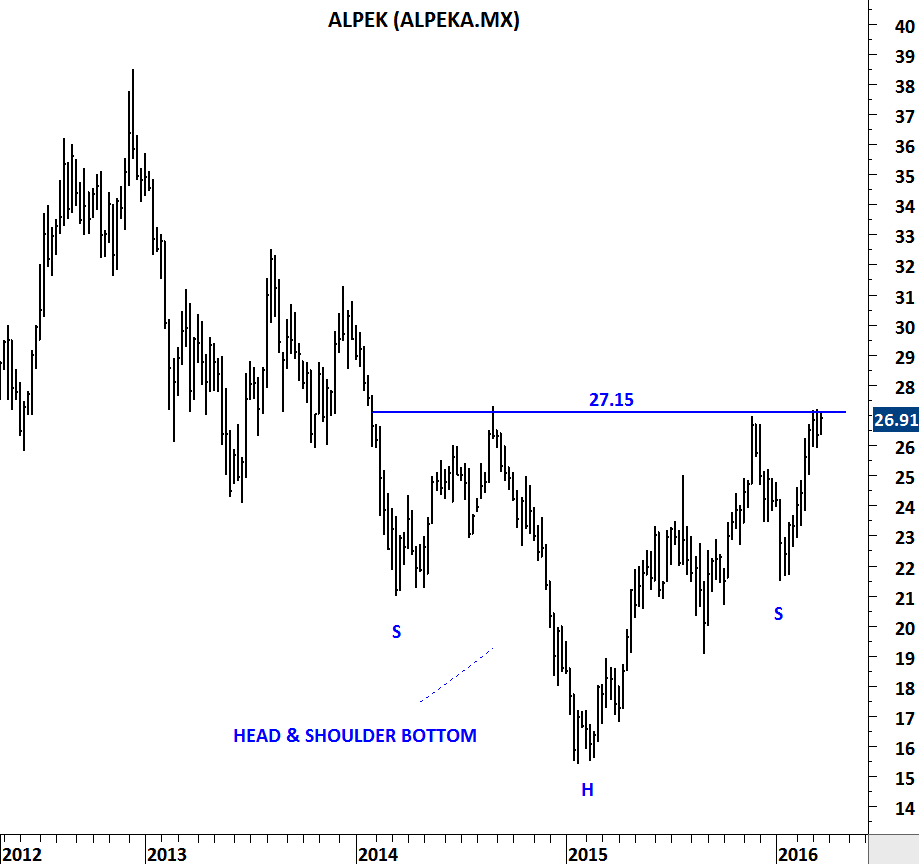
Weekly price chart
2 year-long H&S bottom on ALPEK has strong resistance at 27.15 levels. A decisive weekly break above the neckline at 27.15 will result in higher prices.