GLOBAL EQUITY MARKETS – May 13, 2017

Reminder:  Just one week left until our Founding Member launch on May 22nd!


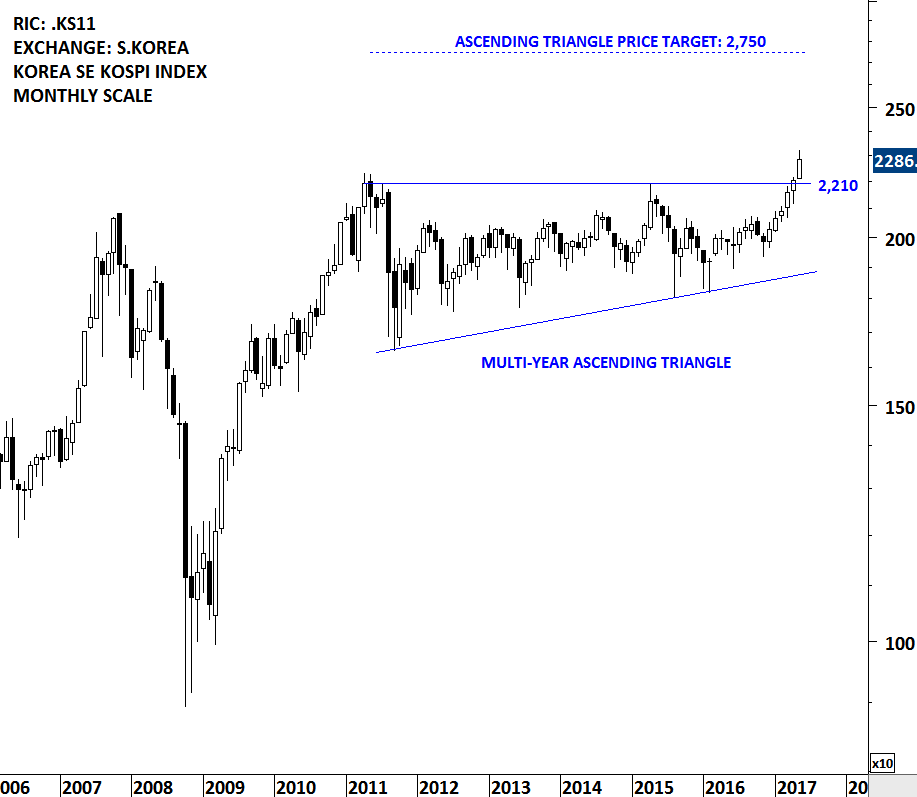
It has been a strong week for equities in emerging Asia and also a strong start for the month of May. South Korea KOSPI index is breaking out to all-time highs by clearing its 6 year-long horizontal resistance at 2,210 levels. The index possibly formed a multi-year long bullish ascending triangle. A strong monthly close will signal positive performance for the coming months. The ascending triangle chart pattern price target stands at 2,750 levels. Emerging Asia is a big component in the MSCI Emerging Markets index. As of May 11, 2017 the top 3 counties in the index are China (26.92%), S.Korea (15.34%) and Taiwan (12.20%).

While the local currency stock market index South Korea KOSPI is breaking out to all-time highs, the U.S. Dollar denominated MSCI S.KOREA price index is few percentage points away from reaching new all-time high levels. The price action is clearly positive. The 9 year-long downward sloping trend line is standing at 460 levels. MSCI S.KOREA index is trying to break out of its multi-year sideways consolidation range.

Read More

GLOBAL EQUITY MARKETS – April 29, 2017

The first round of the 2017 French presidential election was held on 23 April 2017. As no candidate won a majority, a run-off election between the top two candidates, Emmanuel Macron of En Marche! and Marine Le Pen of the National Front (FN), will be held on 7 May 2017. Global equity markets reacted positively after centrist candidate Emmanuel Macron won the first round of the weekend’s French presidential election. European equities have been performing poorly since the beginning of the global financial crash in 2008. Any positive political and economic development is likely to help European equities to catch up in the relative performance. Though, European equities might need more catalyst than an election result to reverse long-term relationships.

Two charts below show the massive under performance of the European equities vs. the U.S. equities over the past 9 years. Both the relative performance ratio between MSCI EUROPE vs. MSCI U.S. and EUROSTOXX 600 Index vs. S&P 500 Index shows a multi-year downtrend. This long-term relationship is something that we should keep a close eye on, as any major turnaround in European indices performance will result in more breakout opportunities in the European equities.

Relative performance ratio between the two indices is converted into an index to better visualize the change in value in percentage terms. 1.00 is an index value of 100. 0.42 is an index value of 42. The chart shows the index losing more than half of its value from the highest level in 2008. In other words MSCI EUROPE underperformed MSCI USA by 58% over the past 9 years. Data used for MSCI EUROPE and MSCI USA are price index in U.S. Dollar.

Read More

A New Beginning – Tech Charts Service


Dear Tech Charts followers,

The Tech Charts blog started back in 2011 as a platform to share ideas and connect with like-minded analysts and traders from around the world.  And writing publicly about the markets has kept me motivated, structured, and focused on my technical analysis and trading.

In recent years, more and more traders and investors have gained access to global equity markets through either ETFs or directly via their broker accounts. This expanded access has allowed me to multiply my search for classical charting opportunities in the global equity space.

Read More

GLOBAL EQUITY MARKETS – April 22, 2017

It was a mixed week for Global equity market performance due to each countries own political and geopolitical developments. However, the benchmark for Global equities, the MSCI ALL COUNTRY WORLD INDEX still shows a clear uptrend. MSCI ALL COUNTRIES WORLD INDEX captures large and mid cap representation across 23 Developed Markets and 23 Emerging Markets countries. With 2,481 constituents, the index covers approximately 85% of the global investable equity opportunity set. iShares has an MSCI ACWI ETF that seeks to track the MSCI ALL COUNTRIES WORLD INDEX. The ETF is listed on the Nasdaq Stock Exchange.

Since the beginning of 2016, MSCI ACWI ETF (ACWI.O) is in a clear uptrend. Over the past two months the price has been challenging the resistance at 63 levels. The continuation of the uptrend will depend on the strength around this resistance level.

iSHARES MSCI ACWI ETF (ACWI.O)

Last one month's price action can be identified as a possible pennant formation. Pennants are short-term continuation patterns that mark a small consolidation before the previous move resumes. Pennants, which are similar to flags in terms of structure, have converging trendlines during their consolidation period and they last from one to three weeks. Breakout above 63 levels can renew upside momentum both on daily and weekly scale. Strong support area remains between 62 and 62.5.

This week there are 3 new chart pattern breakout signals.

Read More

GLOBAL EQUITY MARKETS – April 14, 2017

A relatively short but eventful trading week is behind us. Volatility increased due to geopolitical tensions. Equity indices came under pressure with bonds moving higher. There were 4 new chart pattern breakout signals during the week. Irrespective of general market direction, I try to feature those breakouts and breakdowns from well-defined trading ranges as they develop.

#TECHCHARTSALERT


CBOE VOLATILITY INDEX (VIX)

Over the past 5 months, the VIX consolidated between 10 and 15 levels. Price tested the horizontal resistance at 14.75 for 3 times over the course of the 5 month-long consolidation. Since the beginning of April, volatility index has been inching higher towards the strong resistance. The daily close above 15.15 levels completed the 5 month-long consolidation. Our focus is now on two important levels. First one is 14.75, that will act as support during any possible pullback. Failure to hold above 14.75 will put the interpretation of higher levels into question. Second one is the chart pattern price target at 19 levels. Price target is calculated by taking the width of the 5 month-long consolidation and adding it to the breakout level.

Read More

GLOBAL EQUITY MARKETS – April 8, 2017

It has been a volatile week in the Global equity markets. There were 2 new breakout alerts. Both stocks cleared strong multi-month horizontal resistances.

#TECHCHARTSALERT


TINGYI CAYMAN ISLANDS HOLDING CORP (0322.HK)

Tingyi (Cayman Islands) Holdings Corp. is a Hong Kong-based investment holding company principally engaged in the production and sales of instant noodles, beverages and instant food products. The stock is listed on the Hong Kong Stock Exchange. Price chart formed a 15 month-long H&S bottom with the right shoulder in the form of a 6 month-long rectangle. The neckline of the H&S bottom standing as a resistance at 9.85 has been tested for 4 times over the past year. The daily close above 10.15 confirmed the breakout from the multi-month base formation. 9.85 levels will now become support. Possible chart pattern price target stands at 13.15 levels.

Read More

GLOBAL EQUITY MARKETS – March 12, 2017

This week there has been 7 additions to the #TECHCHARTSWATCHLIST. Most of the chart patterns are bullish as major global equity indices continue to remain in a uptrend.

#TECHCHARTSWATCHLIST


SSY GROUP LTD (2005.HK)

SSY Group Limited is an investment holding company principally engaged in the research, development, manufacture and sale of pharmaceutical products. The stock is listed on the Hong Kong Stock Exchange. Price chart of SSY GROUP formed a 10 month-long rectangle with the strong horizontal resistance standing at 2.78 levels. Rectangle is a continuation chart pattern. A daily close above 2.86 will confirm the breakout from the bullish chart pattern. Possible price target for the rectangle stands at 3.2 levels.

SSY GROUP - WEEKLY SCALE

Read More

GLOBAL EQUITY MARKETS – March 4, 2017

The MSCI Emerging Markets index is created by Morgan Stanley Capital International (MSCI) designed to measure equity market performance in global emerging markets. It is a float-adjusted market capitalization index that consists of indices in 23 emerging economies Brazil, Chile, China, Colombia, Czech Republic, Egypt, Greece, Hungary, India, Indonesia, Korea, Malaysia, Mexico, Peru, Philippines, Poland, Qatar, Russia, South Africa, Taiwan, Thailand, Turkey and United Arab Emirates.

Initiated in 1988, the MSCI Emerging Markets Index (MSCI EMI) represented 10 nations with a total world market capitalization of less than 1%. In 2016, the index has since grown to incorporate 23 countries that comprise about 10% of global market cap. Hence, the MSCI EMI is appropriately used as a benchmark for performance by many emerging market growth mutual funds.

The iShares MSCI Emerging Markets ETF seeks to track the investment results of MSCI Emerging Markets Index. This ETF does not include any currency hedging. This means investors in this product gain exposure to the underlying securities and the currencies in which they are denominated. It is an efficient way to take advantage of trends in the emerging markets and cyclical movements related to emerging markets local currencies.

Last week's update drew attention to the developing bearish candlestick reversal pattern, a shooting star, usually suggests lower prices following its completion. This week's lower opening and weak closing confirms the short-term pull-back in emerging markets equities.

ISHARES MSCI EMERGING MARKETS ETF - WEEKLY SCALE

ISHARES MSCI EMERGING MARKETS ETF - WEEKLY SCALE

Read More