INDIA BOMBAY SE SENSEX INDEX

INDIA BSE SENSEX

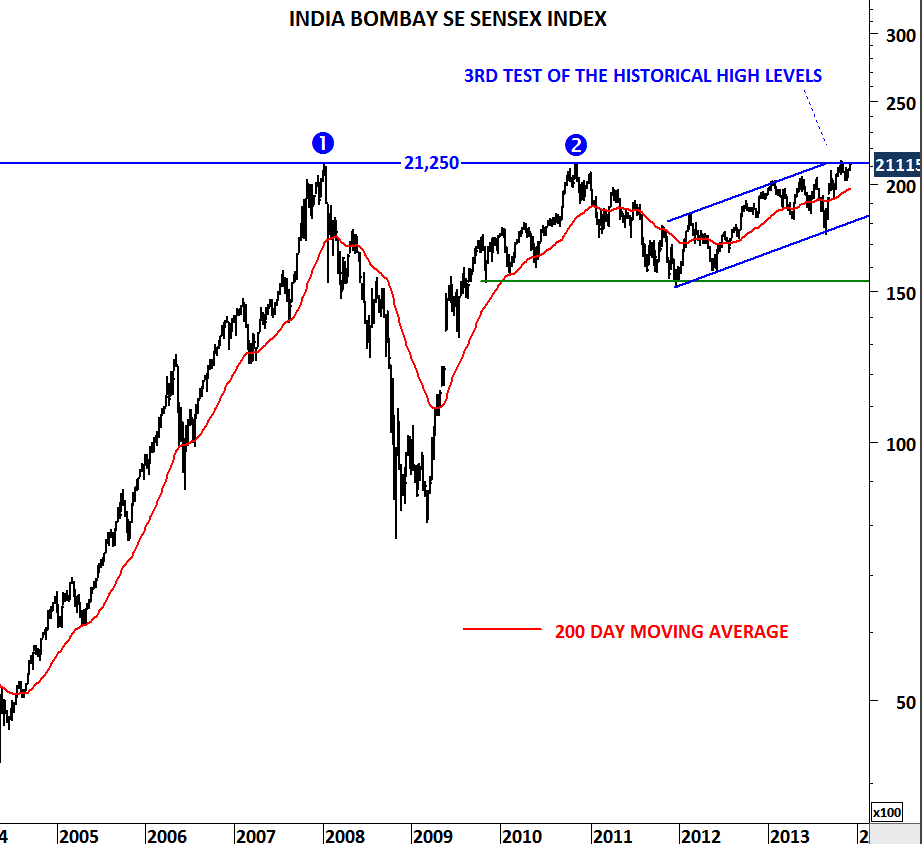
Strength in India’s BSE Sensex Index is no surprise as the benchmark has been testing historical high levels. In September I shared an analysis showing similarities between India and South Africa equity index chart patterns. I think consecutive tests of the historical high levels on the BSE Sensex Index will lead to a breakout and higher levels in the following months. There are usually “double tops” in technical analysis but rarely we see “triple tops”. 3rd test of the historical high level at 21,200 could be a preparation for a decisive breakout. Let’s wait for confirmation. A breakout above 21,200 with a strong weekly bar will be very bullish for this market.

MSCI EMERGING MARKETS

High volatility in May is followed by a calm period in June. After the sharp sell-off in almost all asset classes during May we are now seeing short-term rebounds. Even though some commodities, equity indices and currency pairs are resuming their slide. MSCI Emerging Markets is a widely followed index that found support in the beginning of June. Index rebounded from an extremely critical level. MSCI EM formed a 3 year-long head and shoulder top reversal with the neckline standing at 890 levels. Head and shoulder top hasn’t been confirmed yet. For confirmation we need to see a decisive “weekly” close below 890 levels. Given the symmetry between the left and the right shoulders on the H&S top, there is a high chance of this chart pattern being a classical head & shoulder top.

A decisive break below 890 levels will target 650 levels in the medium/long-term. Head and shoulder tops or bottoms do fail. A failure will occur only if the index breaches above the peak of the right shoulder at 1,070 levels. For now we continue to follow MSCI EM index with a bearish outlook and watch this major chart pattern as a Head & Shoulder top.