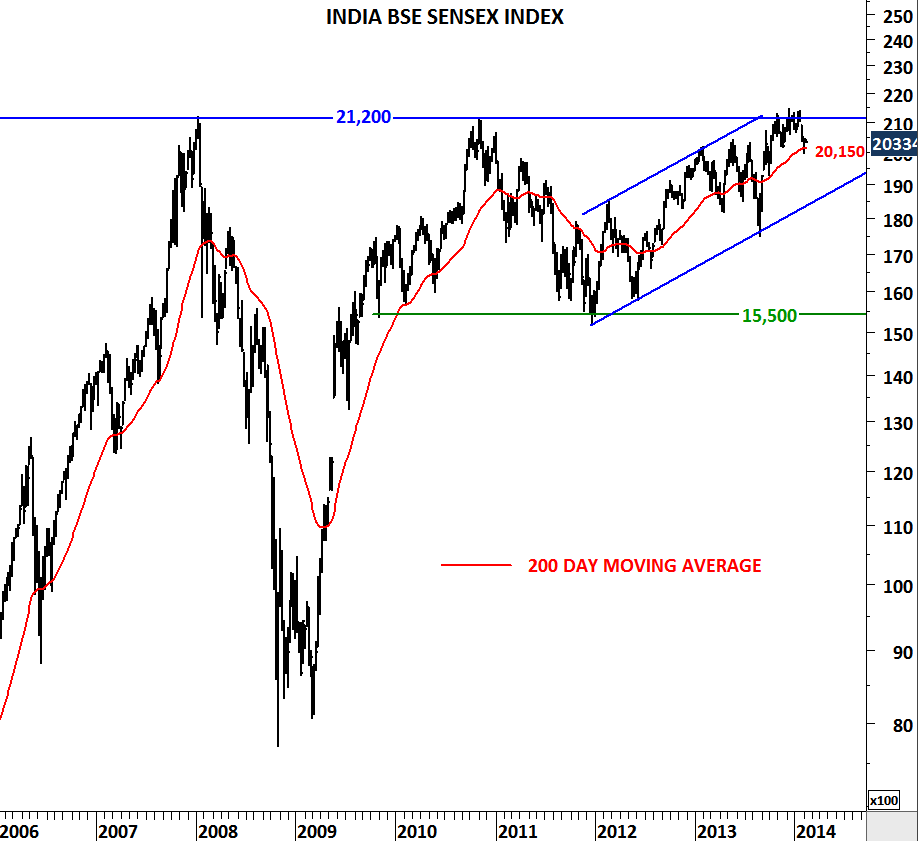
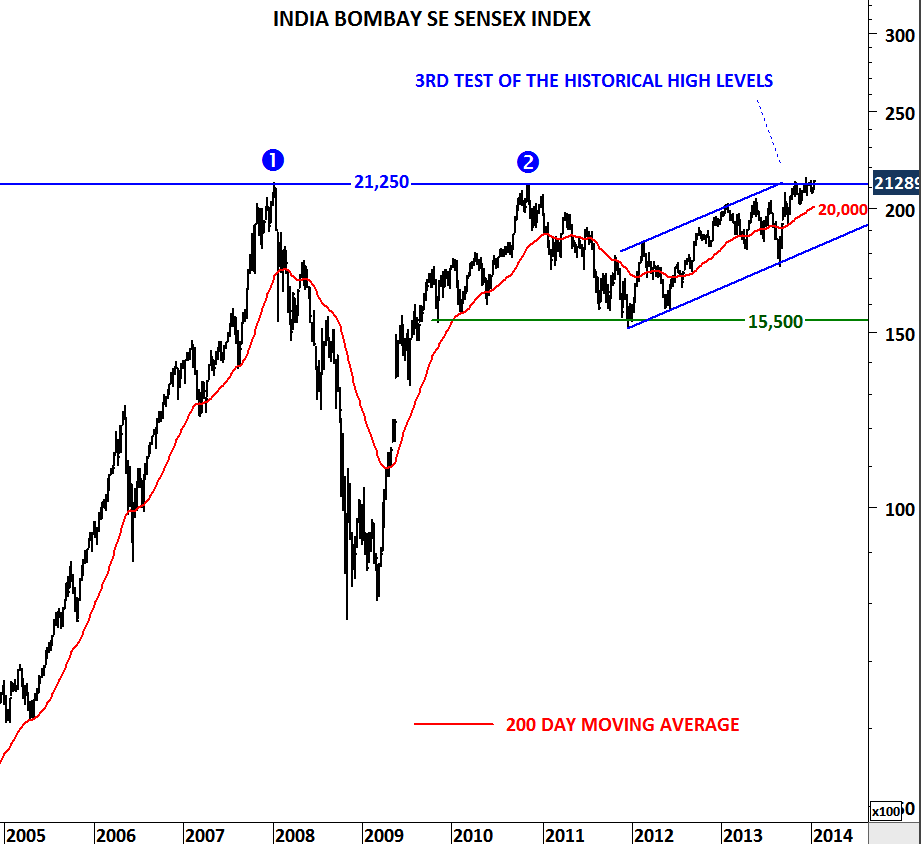
INDIA BSE SENSEX

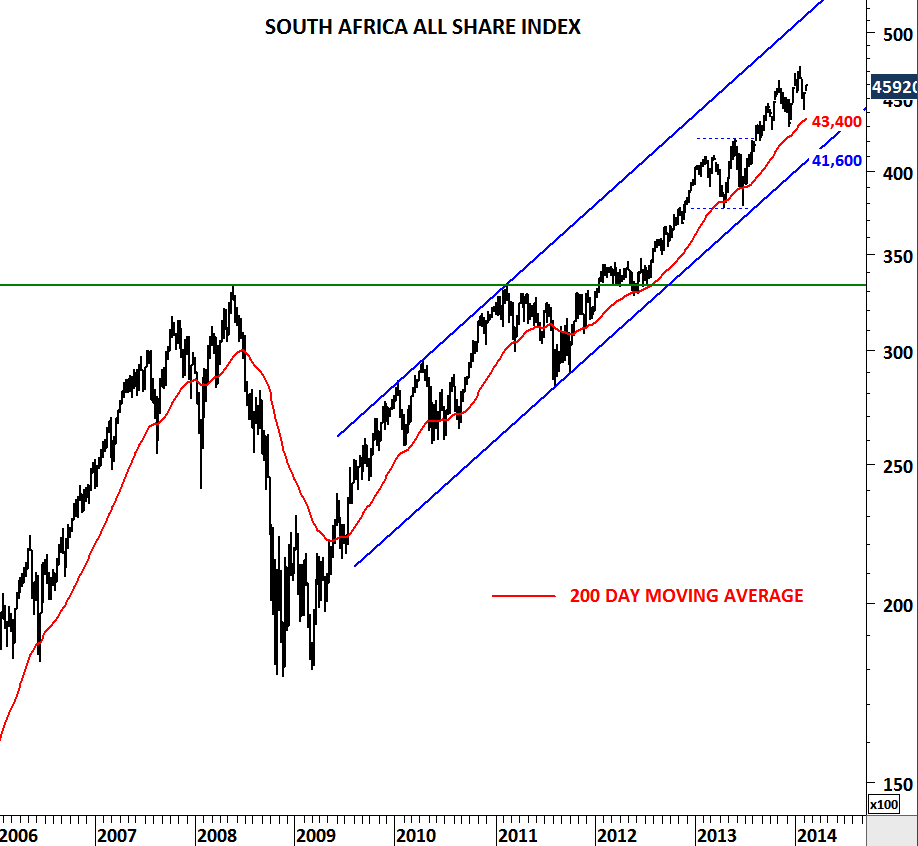
Markets that breakout to all time high levels usually don’t look back. Price enters the uncharted territory where it doesn’t meet any resistance. Some breakouts fail and fall back below the resistance they breached earlier. At that point we know that something was wrong with the earlier breakout. However most of the breakouts to all time high levels are so powerful and decisive that they don’t leave the price action in question. India’s breakout has been one of those set-ups where breakout to historical high levels from low volatility period is now being followed by a strong upward trend. This is extremely positive for Indian equities and suggests higher prices in the medium-term. I attached below similar breakouts to all time high levels on South Africa All Share index and S&P 500 index. (For earlier analysis on India you can refer here)

INDIA BSE SENSEX

SOUTH AFRICA ALL SHARE

S&P 500 INDEX

PERU LIMA IGRA INDEX

Peru’s IGRA index has been one of the weakest from the emerging market equities. After testing 23,850 levels for the third time in the beginning of 2012 IGRA index fell to 14,600 levels. Index formed a clear downtrend below its long-term moving average. Over the past year rebounds have been weak. Index is now testing the horizontal support at 14,600 levels for the third time. Breakdown below 14,600 will be negative for Peru’s IGRA index. Unless the index reverses above the 200-day moving average at 16,150, downward pressure will remain intact.

PERU LIMA SE IGRA INDEX

Similarly, cross rate against the U.S. dollar is challenging the resistance level at 2.82. 200-day moving average is forming support at 2.77. Peruvian Nuevo Sol remains in a downtrend against the U.S. dollar and unless USD/PEN reverses below 2.77 levels outlook will remain negative for the local currency.

USDPEN

MSCI TURKEY, YIELDS and USD/TRY

Over the past few weeks we have seen stability in the Turkish equity and currency markets. Turkey started outperforming the MSCI Emerging markets index after its massive underperformance. MSCI Turkey/MSCI Emerging Markets ratio rebounded from multi-year support. This is positive news for the Turkish equities and this trend should resume.  Meanwhile recovery in the emerging markets helped the MSCI Emerging Markets index rebound from the lower boundary of its 3 year-long sideways consolidation. This also suggests some positive sentiment for the emerging markets going forward.

MSCI EM

MSCI TURKEY vs MSCI EM

USD/TRY which took a parabolic shape and reached 2.40 levels, reversed sharply lower and started pulling back to its 200-day moving average. Expect stronger Turkish lira in the short/medium-term.

USDTRY

Turkish government bond yields are now close to strong resistance area between 10.5 and 11.8. Failure to break the strong resistance area could result in lower yields in the following months.

TR 2YR GOVT YIELDS

EMERGING MARKETS – EQUITIES

Are emerging markets really weak? There are outflows from the emerging markets but how are their equity market performances so far? Are their long-term uptrends challenged? Has there been significant technical damage during the latest so-called weakness?

If a market is holding above its long-term moving average (200-day moving average), I classify this a uptrend. Likewise, if a market is recording higher highs and higher lows, this is also considered an uptrend. Below I analyzed 21 emerging market equity indices. Most of the markets are still healthy and they are either in a uptrend or moving sideways (no major downtrend as of now). For some emerging market weakness is not a new phenomena. They have been weak over the past 3 years. Yes, some markets have experienced weakness, but to conclude for further weakness we should see major breakdowns. At this stage I don’t see major breakdowns on the charts. On the contrary, I’m analyzing more sideways consolidations and possibility of rebounds from strong support areas.

Markets that are weakening: CHILE, THAILAND

Markets that have been weak but now close to strong support: BRAZIL, COLOMBIA, PERU, CHINA, MOROCCO, TURKEY

Markets that are moving sideways: MEXICO, INDONESIA, KOREA, PHILIPPINES, TAIWAN, HUNGARY, POLAND, CZECH REPUBLIC, RUSSIA

Markets that are in an uptrend:  INDIA, MALAYSIA, EGYPT, SOUTH AFRICA.

MSCI EM III

CHILEAN IGPA INDEX

BRAZIL BOVESPA INDEX

COLOMBIA COLCAP INDEX

MEXICO MXSE IPC INDEX

PERU LIMA SE IGRA INDEX

CHINA SSE 50 INDEX

INDIA BSE SENSEX

INDONESIA JSX 45 INDEX

KOREA KOSPI INDEX

MALAYSIA KLSE INDEX

PHILIPPINES SE INDEX

TAIWAN SE WEIGHTED INDEX

THAILAND SET INDEX

HUNGARY BUDAPEST SE INDEX II

POLAND WIG 20 INDEX

PRAGUE SE INDEX

RUSSIA MICEX INDEX

EGYPT EGX 30 INDEX

MOROCCO ALL SHARE INDEX

SOUTH AFRICA ALL SHARE INDEX

TURKEY ISE 100 INDEX

BIST 100 (TURKEY) and INDUSTRIAL SECTOR

From politics to its financial markets and its currency, news flow on Turkey has been negative. Can the financial markets in Turkey return to stability?  I’d like to draw attention to an interesting correlation between BIST 100  and the relative performance ratio between Industrial sector and BIST 100 index. Relative performance ratio is calculated by dividing the Industrial index (XUSIN) to BIST 100.

BIST 100 INDEX III

XUSIN XU100

Few findings:

1) Correction periods on the BIST 100 index resulted in outperformance for the Industrials and undeperformance for the Financials.

2) Since 2004, 0.93-0.95 area acted as strong resistance for the relative performance ratio between XUIND/XU100.

Few conclusions:

1) As the relative performance ratio reached strong resistance area, we are likely to see a change in trend favoring financials.

2) Change in sector performance (Underperform: Industrials, Outperform: Financials) could have a positive effect on the BIST 100 index.

We are at the early stages of this development and we should wait for the initial reaction (confirmation) on both the relative performance ratio and the BIST100 index.

Update: TURKEY YIELDS and BIST 100

Below are two updated charts on an earlier theme I discussed on this blog. Relative performance ratio between 2 year government bond yields and 10 year government bond yields is breaking above a critical threshold and repeating the same cycle of late 2011. Short-term yields are outperforming the long-term yields and the selling pressure remains intact on the equity index. As long as the 2YR / 10YR ratio trends higher, equity market will remain under pressure and yields will suggest further upside.

2YR vs 10YR II

BIST 100 INDEX II

TURKEY YIELDS and BIST 100

Over the analyzed period when Turkey 2YR Bond yields outperformed the 10YR, equity index entered into a correction and vice versa. This is an interesting correlation. Patterns on the relative performance chart of the 2YR Bond Yields vs. 10YR Bond Yields can reveal some important information on the direction of the markets in the following months.

Technical outlook on the 2YR/10YR chart is very similar to the second half of 2011. Since the beginning of 2011 BIST 100 was in a correction. Equity index resumed its downtrend after the 2YR/10YR broke above 0.97 levels. Relative performance reached 1.17 levels and BIST 100 reached the lowest level for that year.

Relative performance ratio between the short and long-term yields are now challenging the previous resistance at 1.00 levels. Breakout above this level could send the ratio towards 1.10-1.15 area once again and the equity index lower to test 60,000 levels. Failure to break above 1.00 levels will help the ratio to ease back towards 0.90 and the BIST 100 to hold above 65K.

2YR vs 10YR

BIST 100 INDEX

INDIA, U.K. and JAPAN

Over the past few years equity markets had strong performance. Developed markets did better than the emerging markets but overall it has been positive for equity asset class. In this update I’m sharing with you 3 long-term charts that can be the center of attention in 2014. Possible breakouts in these 3 markets can add fuel to the equity strength in the following months. India’s BSE Sensex index, U.K. FTSE 100 index and Japan’s NIKKEI 225 index are testing their long-term trend resistances. Breakout above these long-term strong technical levels can result in a multi-month uptrend and attract more investors.

INDIA BSE SENSEX INDEX

UK FTSE 100 INDEX

JAPAN NIKKEI 225 INDEX

INDIA BSE SENSEX and USD/INR

INDIA BSE SENSEX INDEX

Strong price action should be followed by a decisive breakout on the BSE Sensex Index. Since 2007, Sensex tested 21,250 levels for three times and over the past few months price action suggests a breakout to all time highs is very likely. Confirmation of the breakout should come after a decisive weekly closing above the strong resistance at 21,250 levels. 200-day moving average should act as medium-term support at 20,000 levels if the index fails to clear the strong resistance. Breakout above 21,250 levels will push the index towards 25,000 levels in a short period of time.

USDINR

Indian rupee gained strength against the U.S. dollar and this trend is likely to continue towards 58-60 area. Strong equity market should bode well for the local currency.

INDONESIA JSX 45 INDEX and USD/IDR

USDIDR

2 year-long depreciation for the Indonesian Rupiah should be over with the USD/IDR reaching long-term trend resistance at 12,400 levels. In 2012, I’ve analyzed several emerging market currency weakness against the U.S. dollar. USD/IDR was one of the charts that formed major base reversal (inverted head & shoulder). Since then, the asian currency depreciated from 9,000 levels to 12,000 levels. 2 year-long uptrend on the USD/IDR is due for a pullback. 12,400 levels is a strong resistance and only a decisive break above this level would put more pressure on the Rupiah. Otherwise expect the local currency to strengthen over the next few months.

INDONESIA JSX LIQUIDITY 45 INDEX

Strength on Indonesian rupiah should have a positive effect on the equities as well. JSX Liquidity 45 index found support at the lower boundary of its uptrend and now it is challenging the 200-day moving average at 746 levels. Equities should resume their uptrend as long as the trend channel remains intact. Strong support for the equity index is between 650 and 700 levels.