TURKEY, SOUTH AFRICA and BRAZIL
It started with weakness in emerging market currencies (archive for emerging market currencies) then it spread to equity markets and now emerging market yields are under pressure. From commodity exporting economies to energy importers, almost all emerging markets experienced high volatility. Charts are telling us that the high volatility is here to stay and possibly spread to other investment areas. This update shows the technical damage on the 3 major emerging market economies; Brazil, South Africa and Turkey. By looking at these charts one would wonder how much more shocks can these markets absorb. It looks like the bond markets can experience some heat in the following months.
BRAZIL
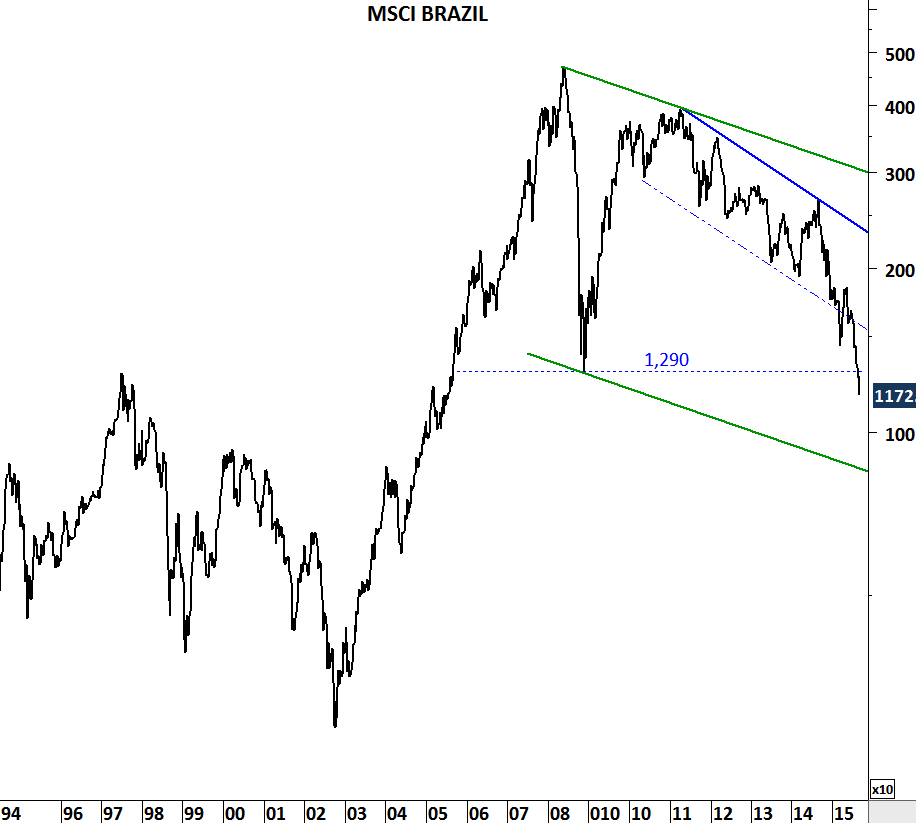
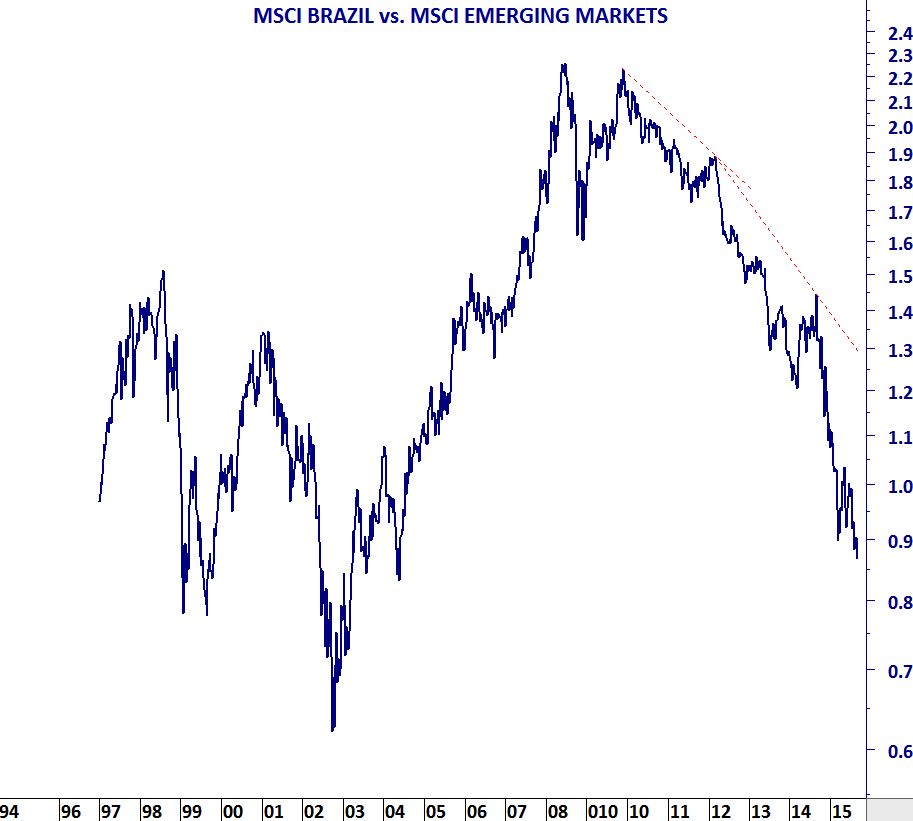
Sharp sell-off in Brazilian equities breaks down 2008 low levels. MSCI Brazil underperforms the MSCI Emerging Markets index.
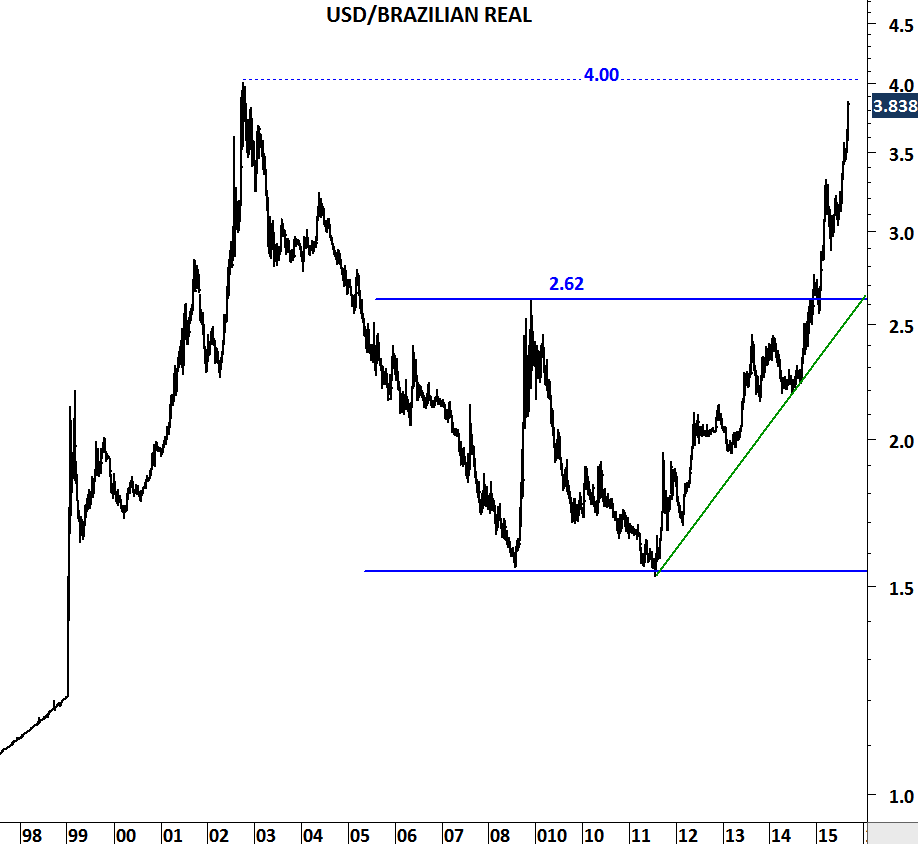
U.S. Dollar vs. Brazilian Real is now close to 4 levels. Since the breakout above 2.62 levels, depreciation in Brazilian Real has taken a parabolic shape. Breakout above 4 levels will push the cross rate to uncharted territory.
10 year government bond yields completed 7 year-long base formation, suggesting a price target of 18 levels.
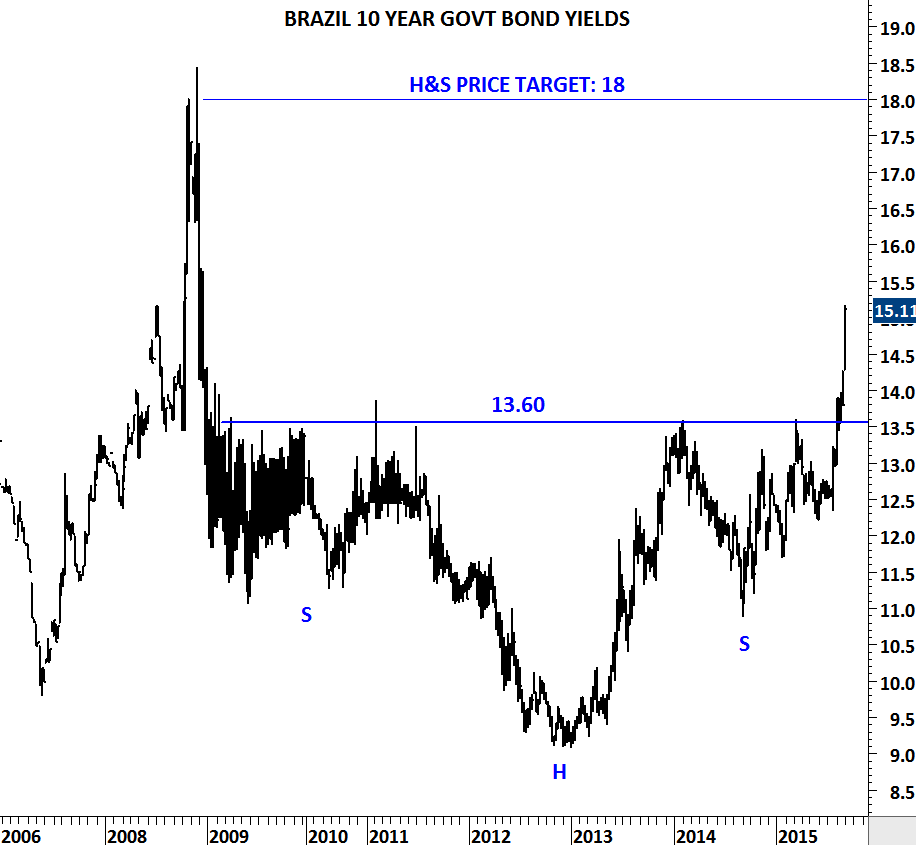
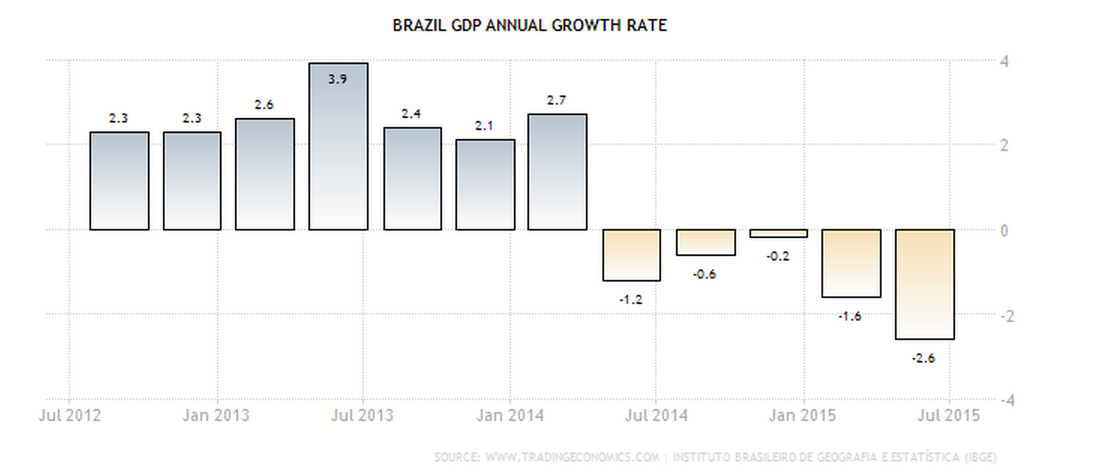
Source: www.tradingeconomics.com
SOUTH AFRICA
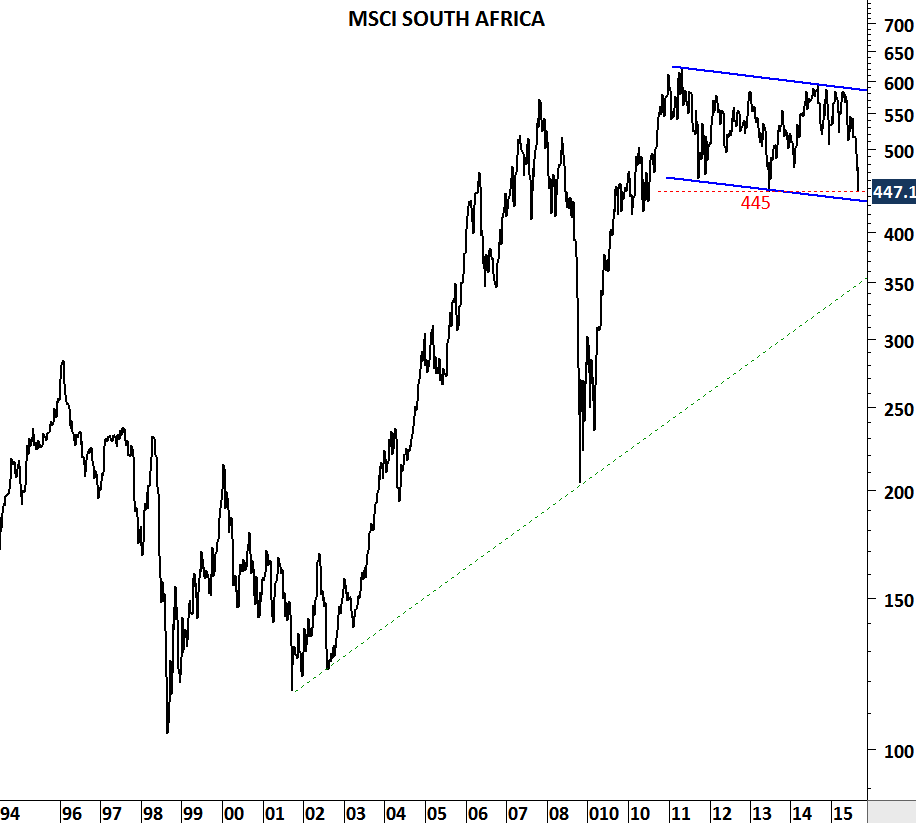
MSCI South Africa is now testing strong support at 445 levels. Breakdown below this level can push the index towards 350 levels.
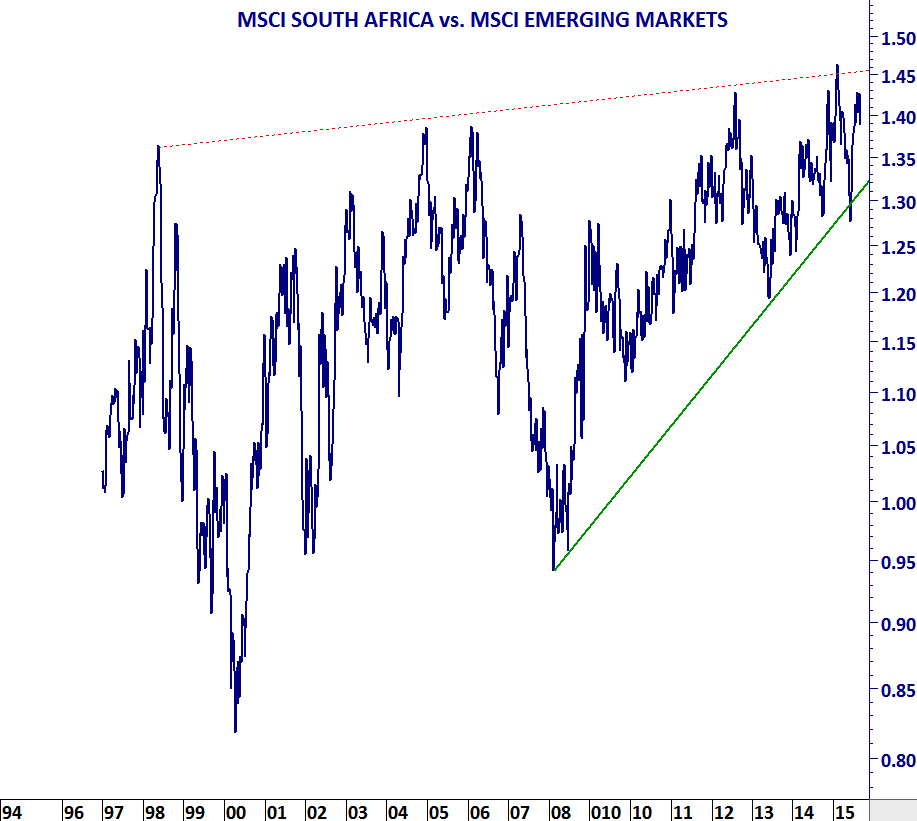
MSCI South Africa has outperformed the MSCI Emerging Markets index. This is positive on a relative basis.
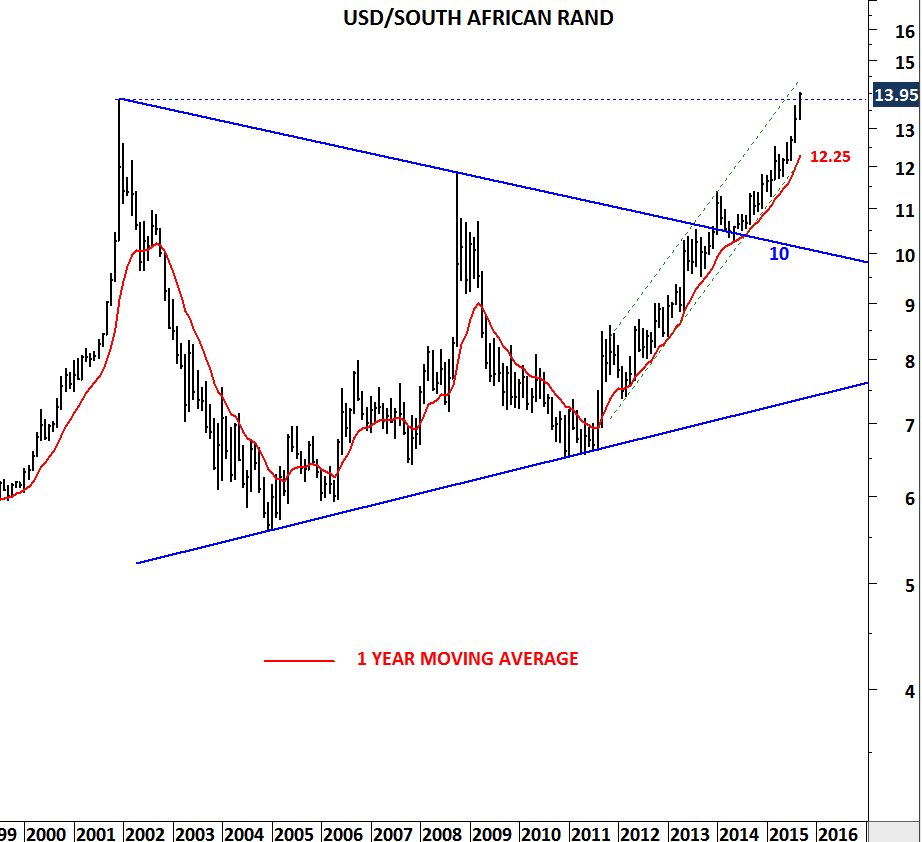
U.S. Dollar vs. South African Rand is now challenging all-time high levels. Depreciation against the U.S. dollar resumes…
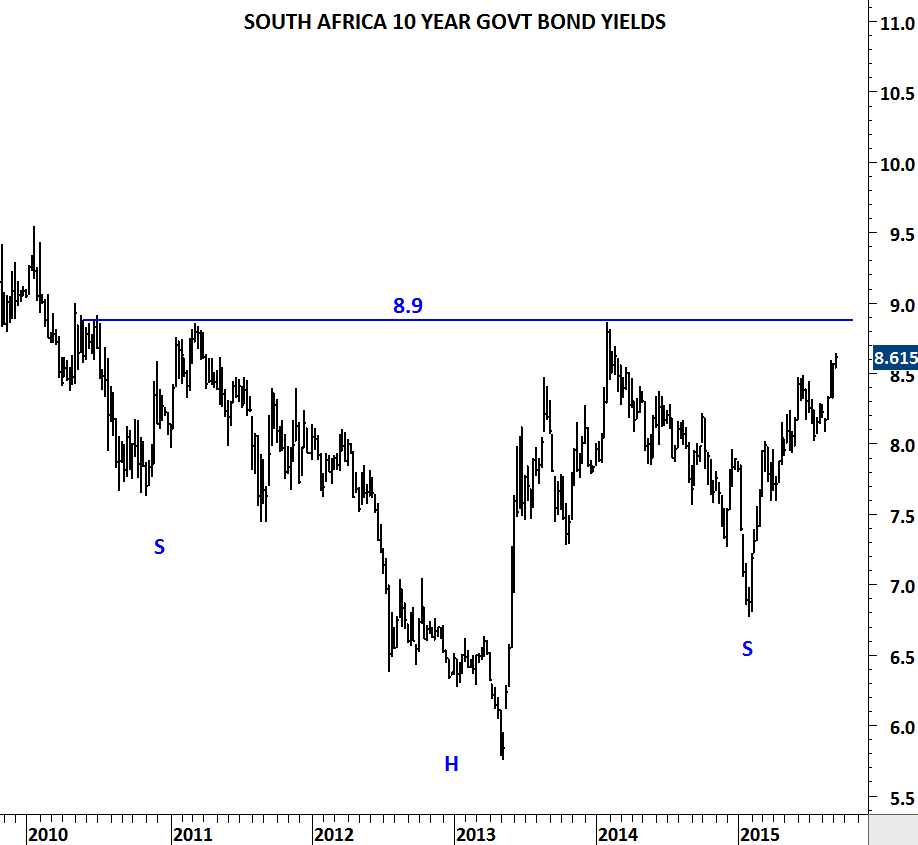
South Africa 10 year government bond yields are completing a massive 5 year-long base formation. Breakout above 8.9 levels can result in a similar move that we have seen on the Brazilian government bond yields.
Source: www.tradingeconomics.com
TURKEY
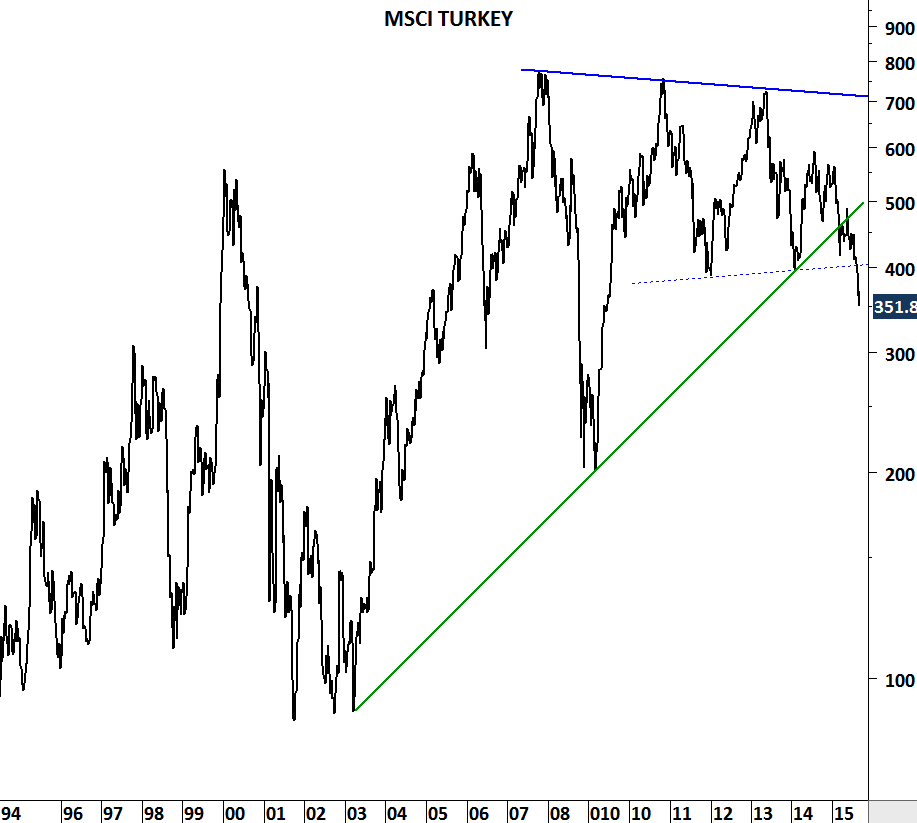
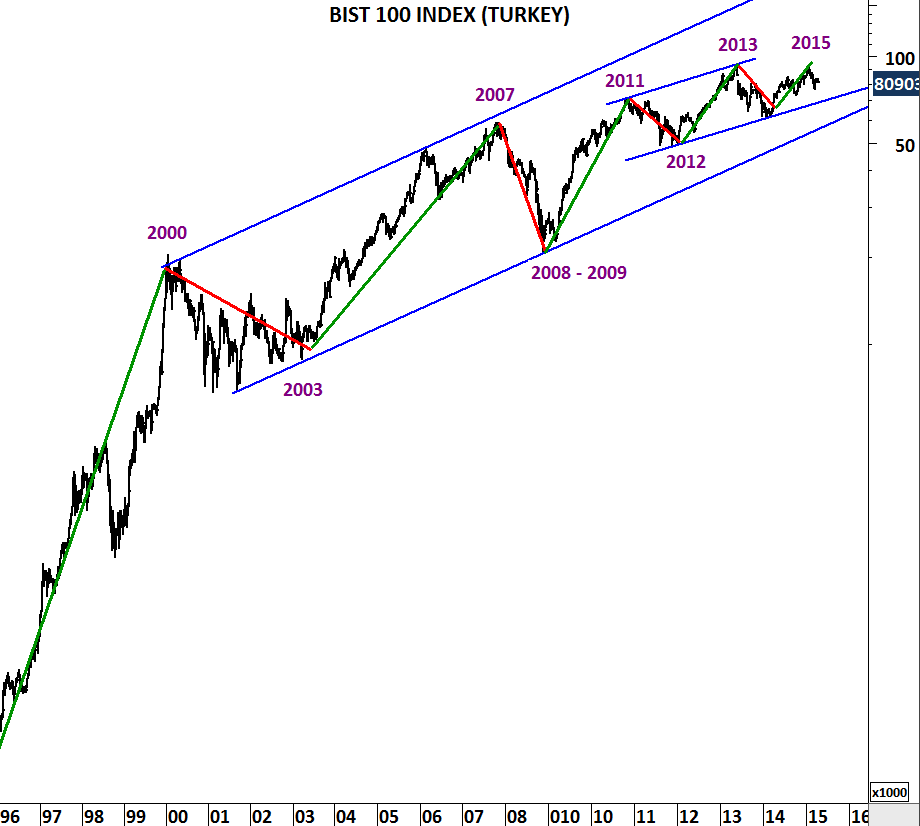
MSCI Turkey breaks down decade-long trend line support. Also the index breached the 5 year-long support at 400 levels.
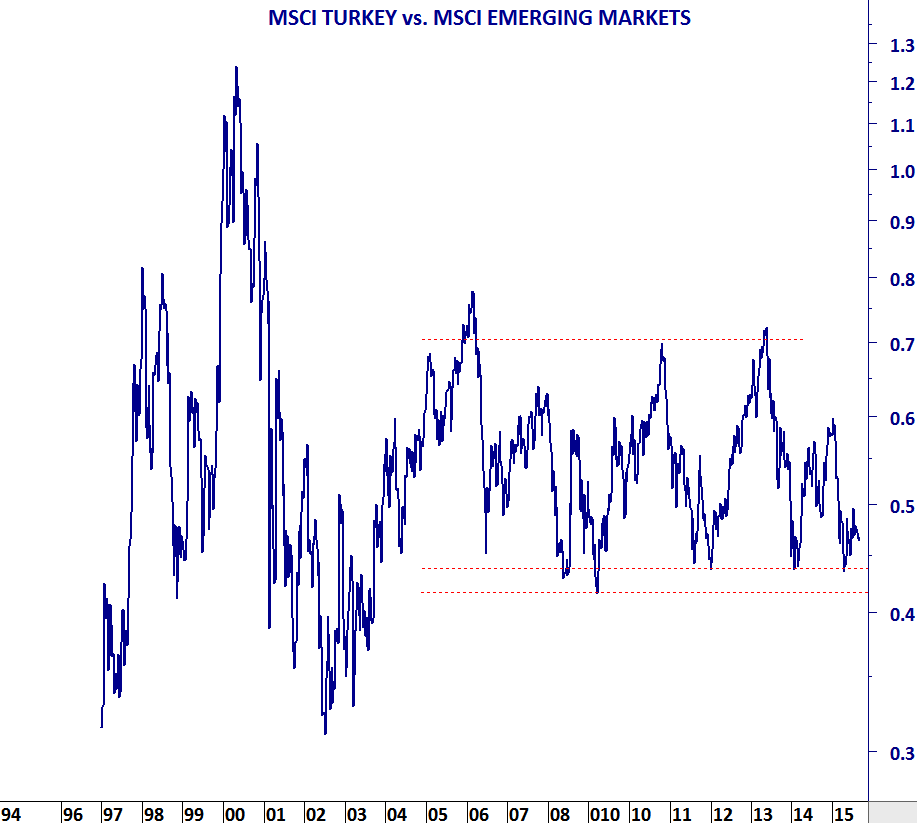
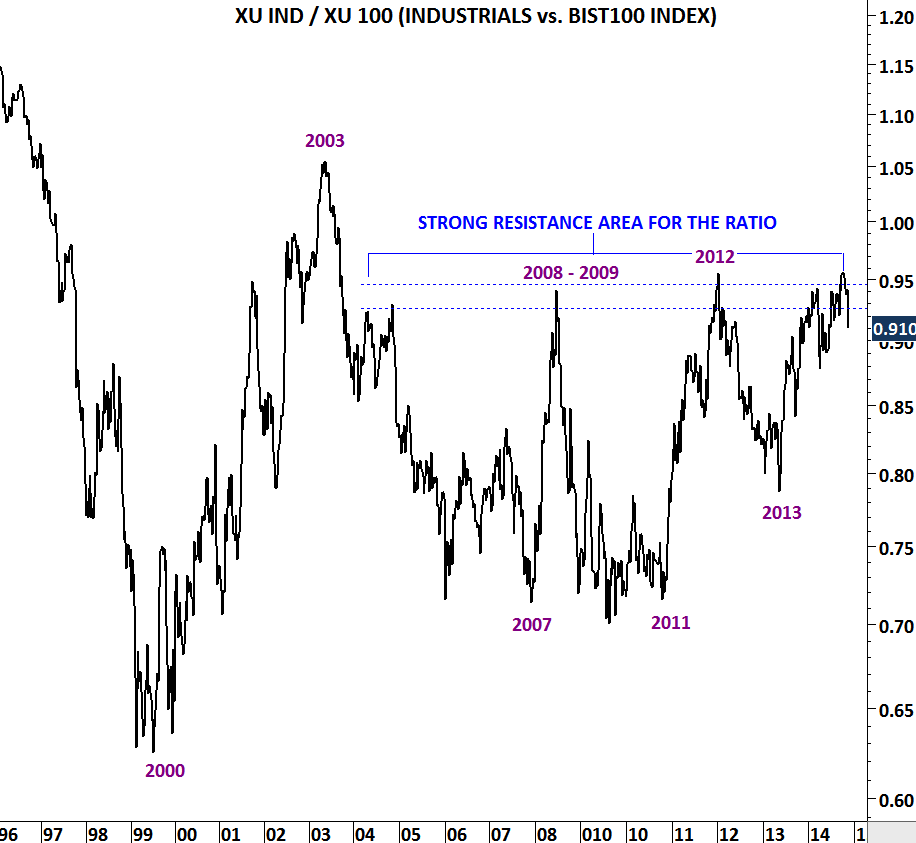
If we take the relative performance of MSCI Turkey vs. MSCI Emerging Markets we can conclude that the index have been flat since 2004!
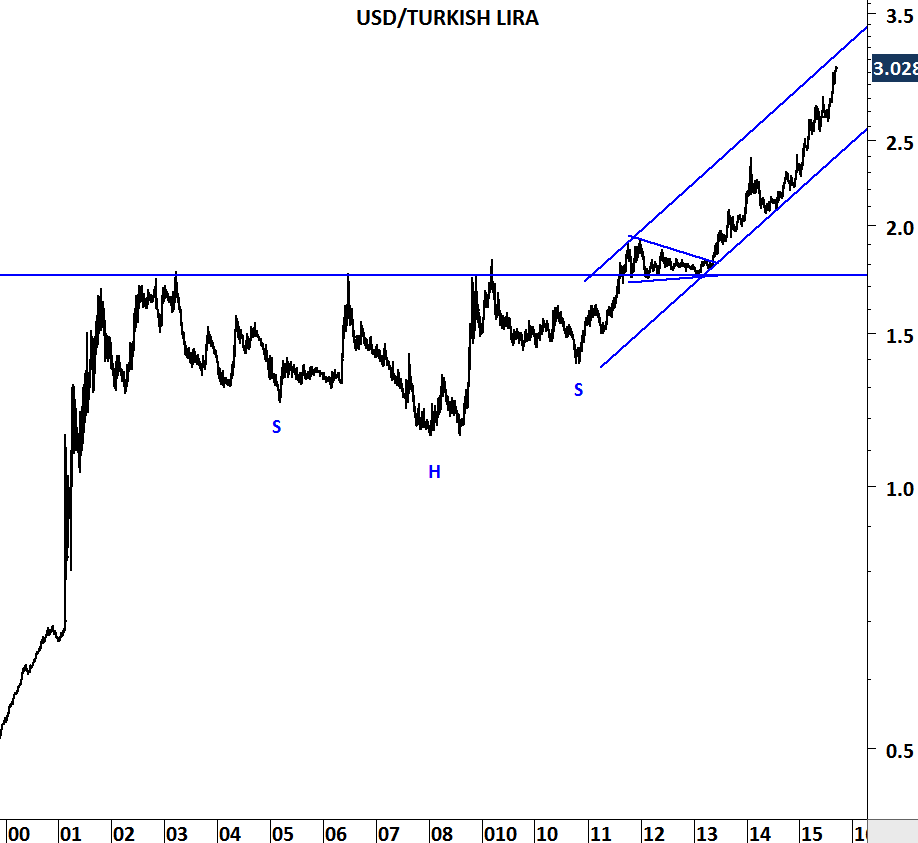
After completing its decade-long consolidation which took the form of a continuation head and shoulder U.S. Dollar/Turkish Lira broke out above 1.8 levels and since then the sharp depreciation pushed the Lira to historical high levels. Added to the emerging market weakness, political uncertainty and security issues put further pressure on Turkish economy and its financial markets.
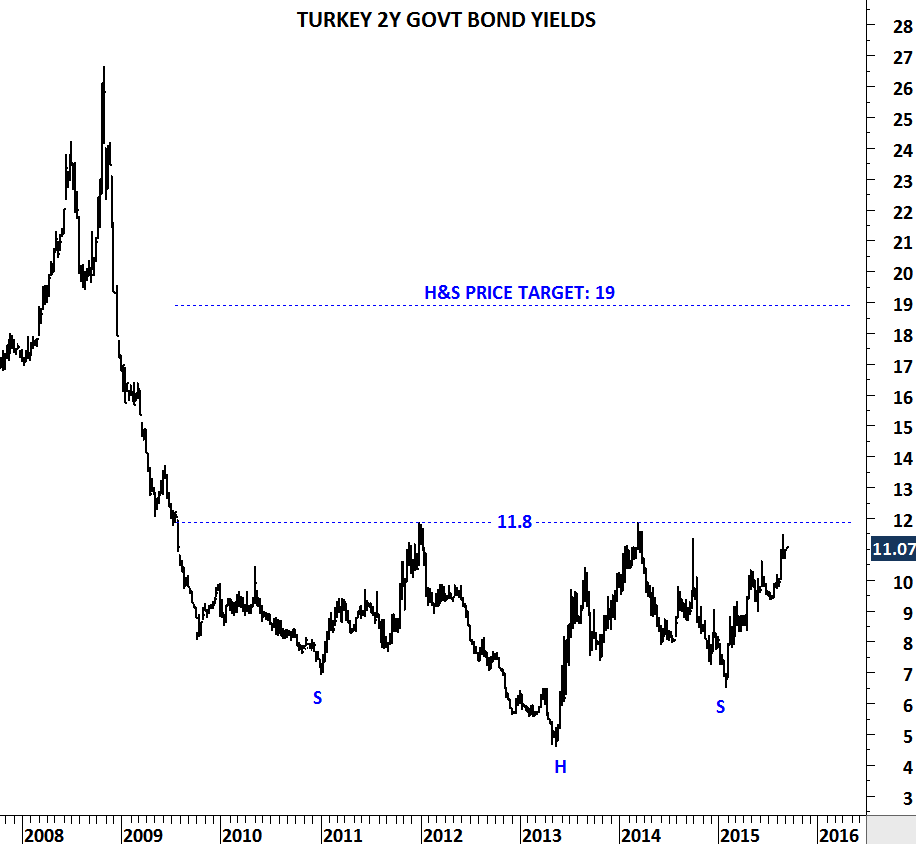
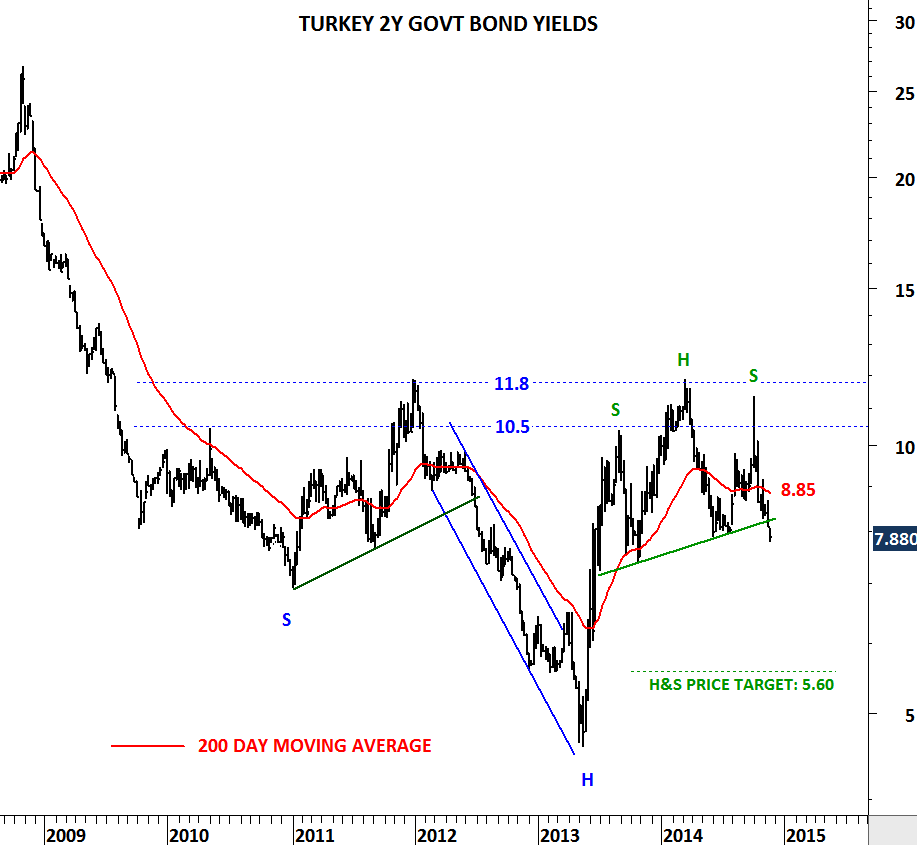
Turkish short-term yields are completing a massive 6 year-long base formation. Breakout above 11.8 levels can push the yields to 19 levels in the following months.
Source: www.tradingeconomics.com