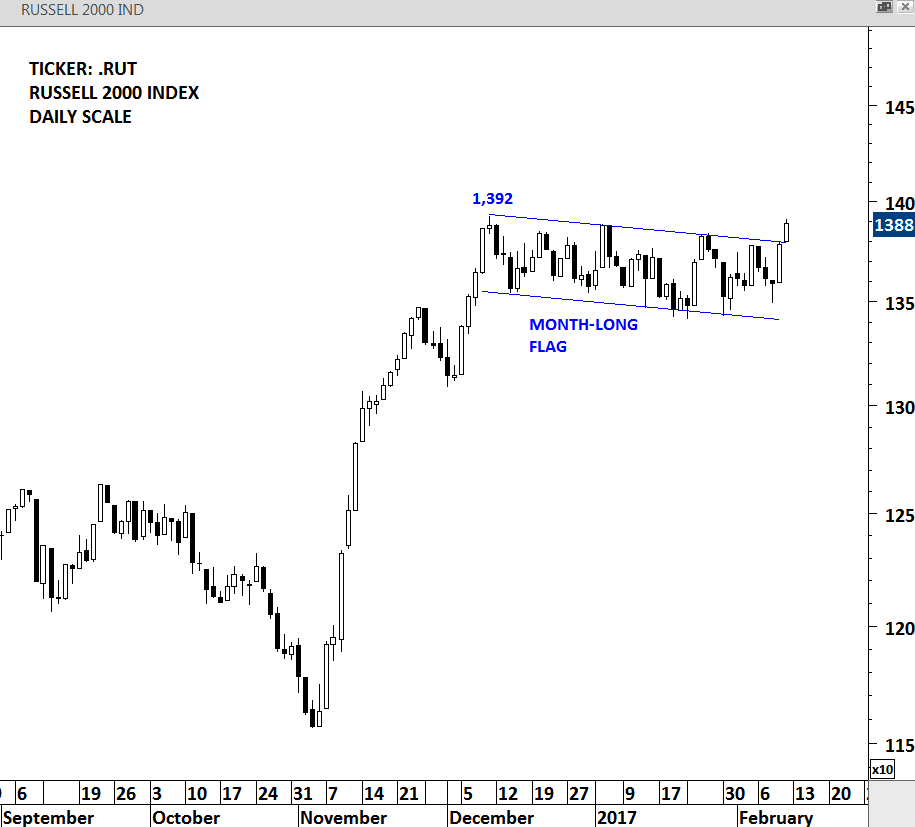
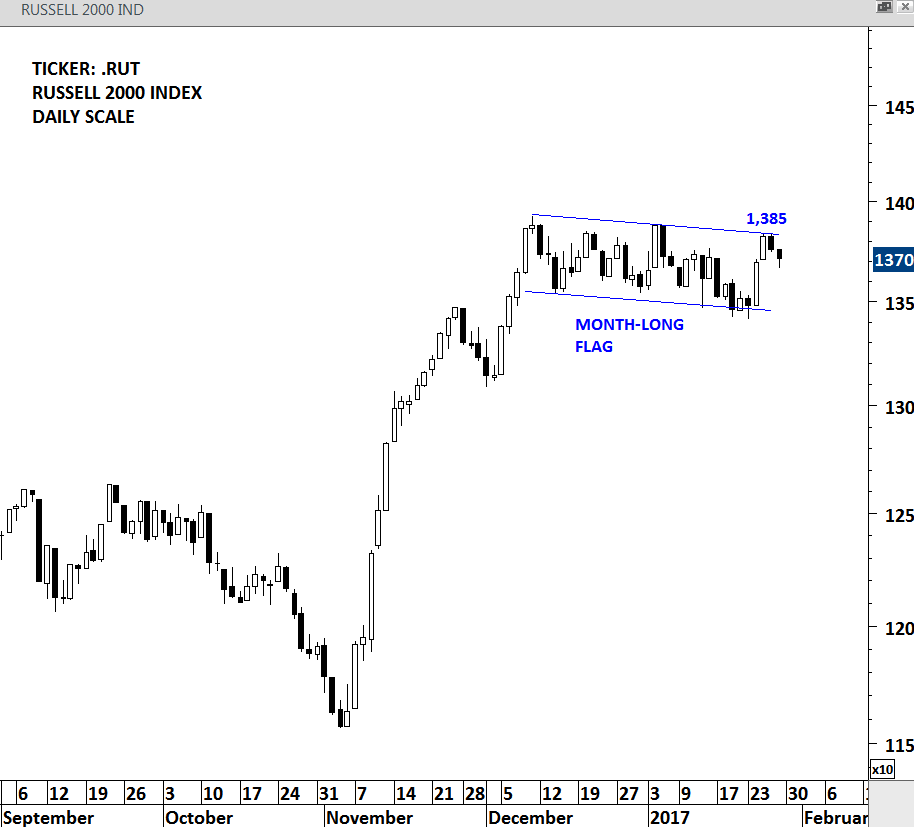
A volatile trading week finished with a strong close on Friday for most of the global equity indices. Russell 2000 index serves as a benchmark for small-cap stocks in the United States. With Friday’s strong close, once again the index reached the upper boundary of its tight consolidation range. Breakout on Russell 2000 index could bode well for the equity market performance in the coming weeks. Strong short-term resistance stands at 1,385 levels.
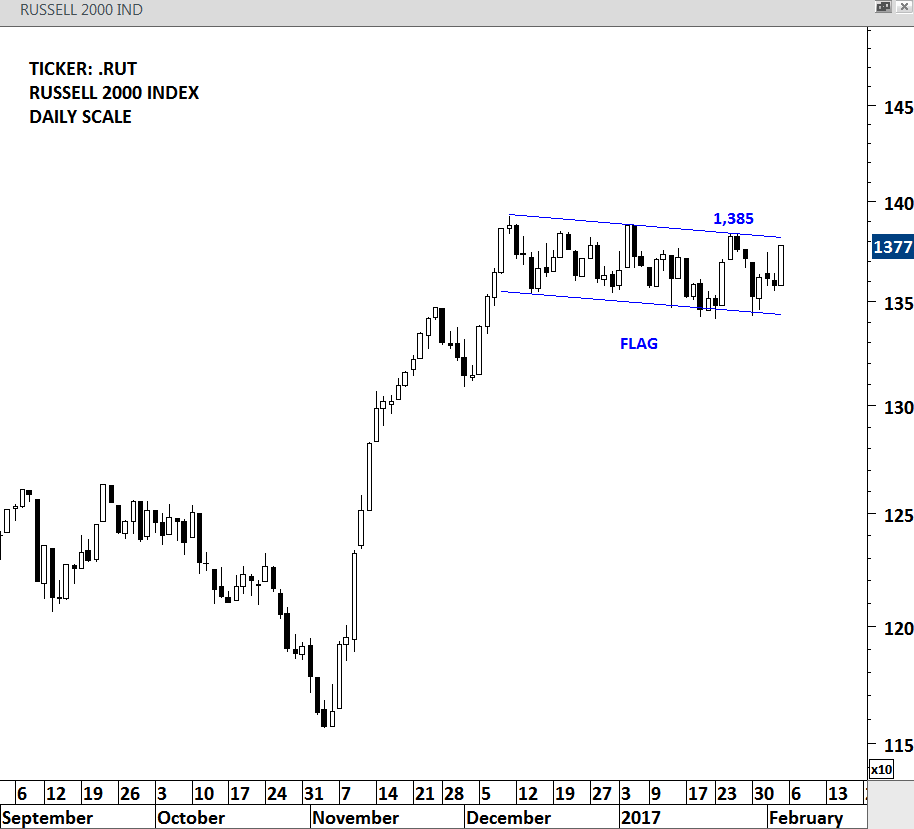
RUSSELL 2000 INDEX – DAILY SCALE
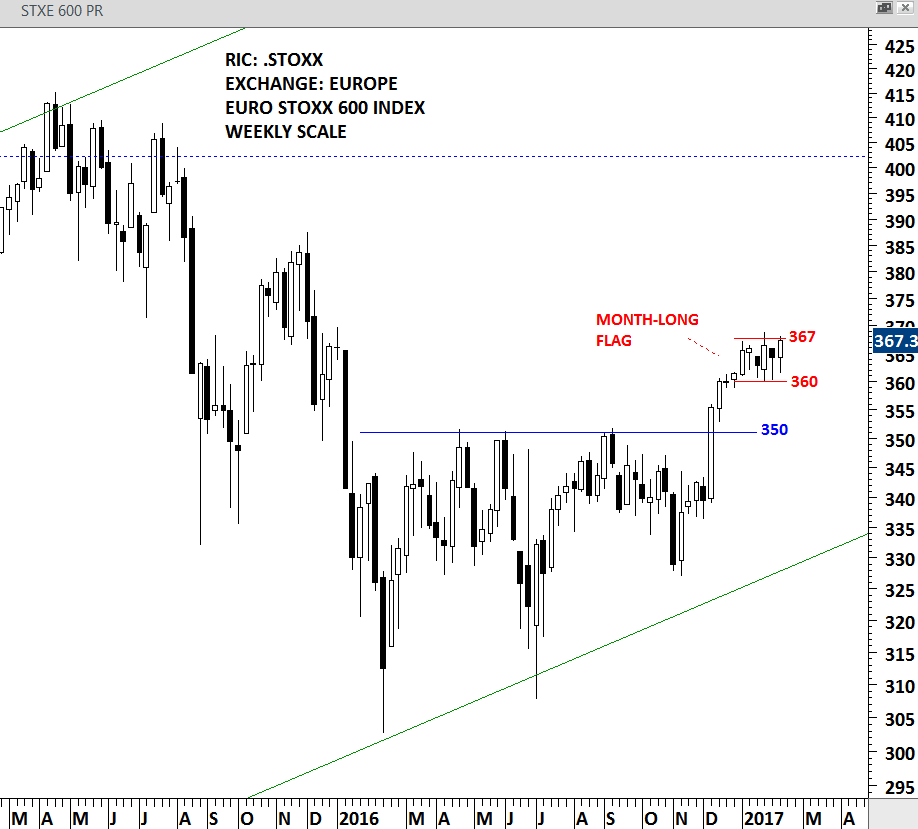
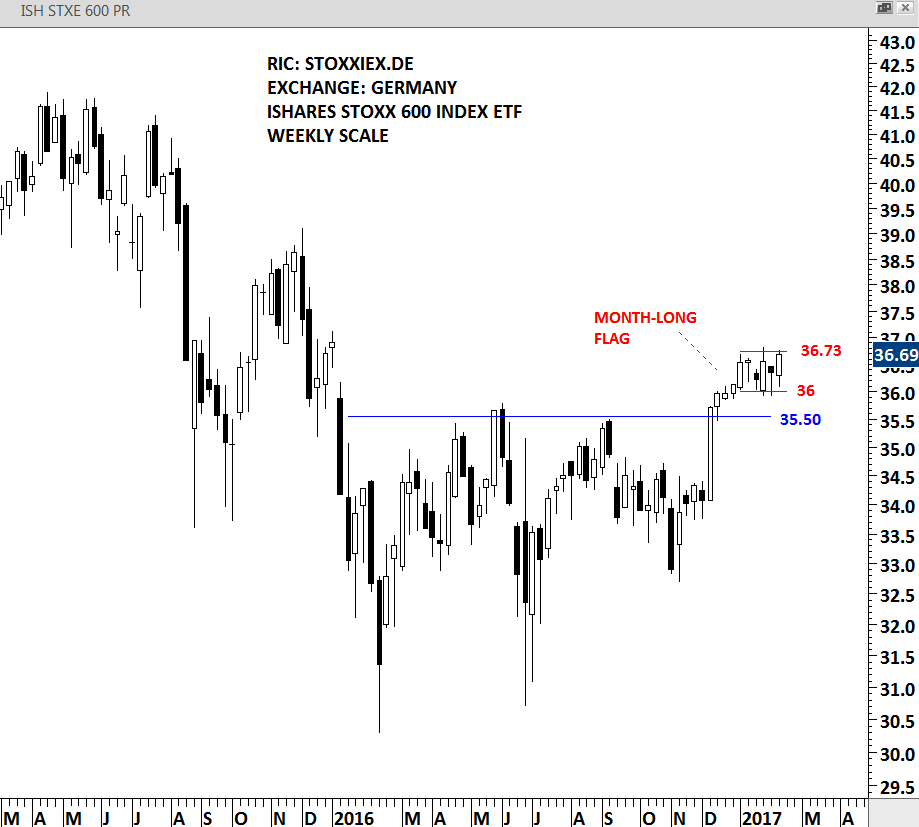
European equities hold on to their gains following the strong breakout in late 2016. STOXX 600 index cleared the 350 levels with a strong weekly bar in December 2016 and completed a year-long base formation. Over the past month, the STOXX 600 index remained in a tight range between 360 and 367 levels possibly forming a bullish flag. A flag is usually considered a pause in a trend period and classified as a continuation chart pattern. Breakout above 367 levels should resume the uptrend in the European equities.
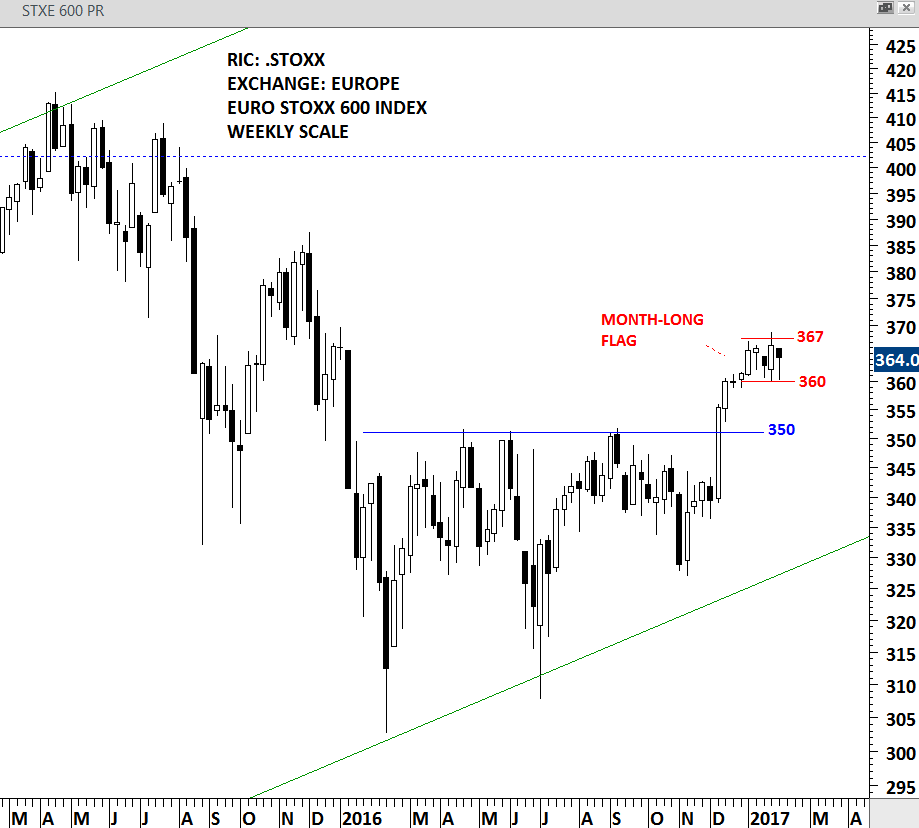
EURO STOXX 600 – WEEKLY SCALE
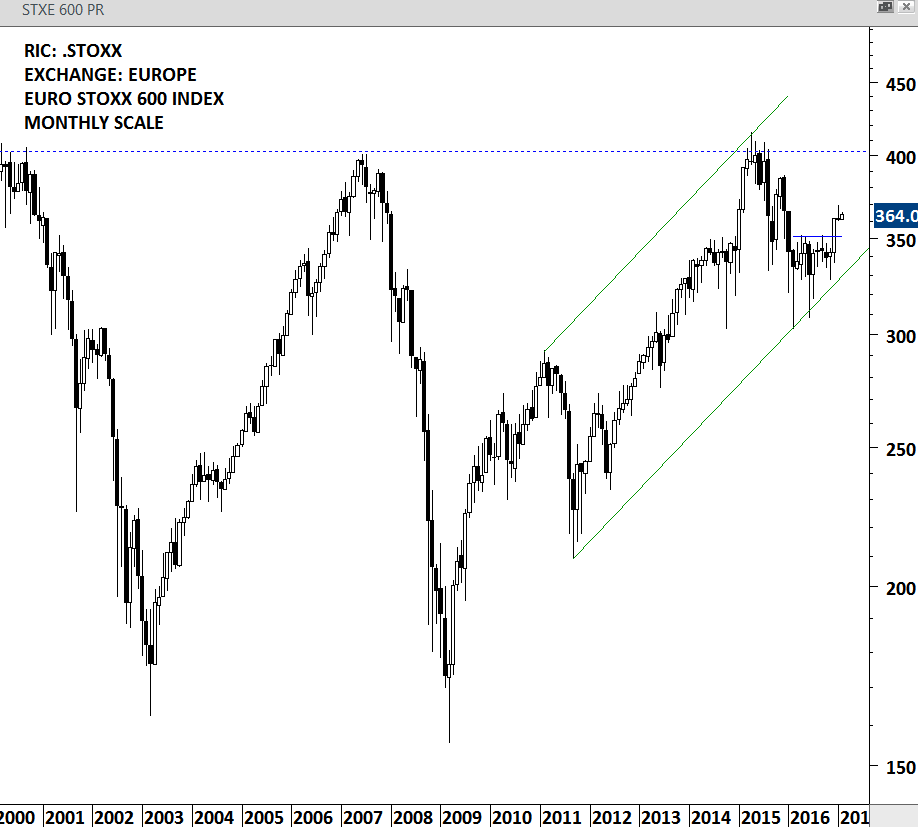
EURO STOXX 600 – MONTHLY SCALE
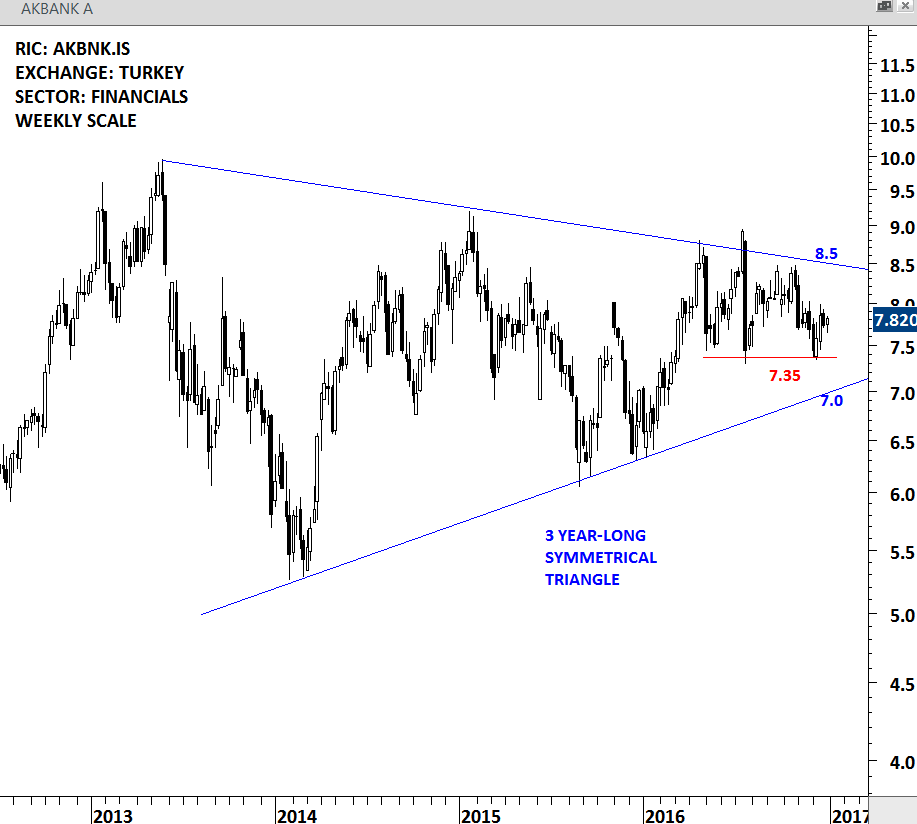
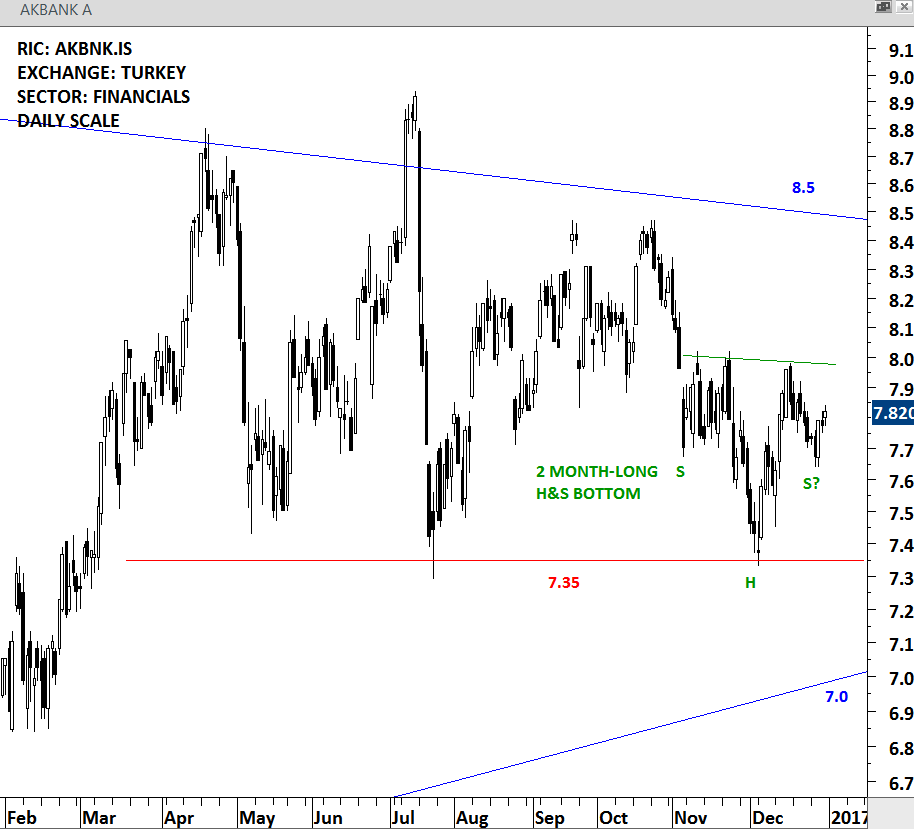
I shared several updates on the Turkish equities both on twitter and on the Tech Charts blog. As I go through several charts every week, I look for price action with well-defined boundaries, preferably forming an identifiable and mature chart pattern. Breakouts from these type of chart setups usually yield strong trend periods in the direction of the breakout. Turkey’s BIST 100 equity benchmark index is one of the best looking chart setup in the Emerging Market opportunity set. Breakout from the 3 year-long symmetrical triangle can result in a strong uptrend targeting 121K levels. Turkey BIST 100 index is setting up for a breakout that could result in a multi-month trend.
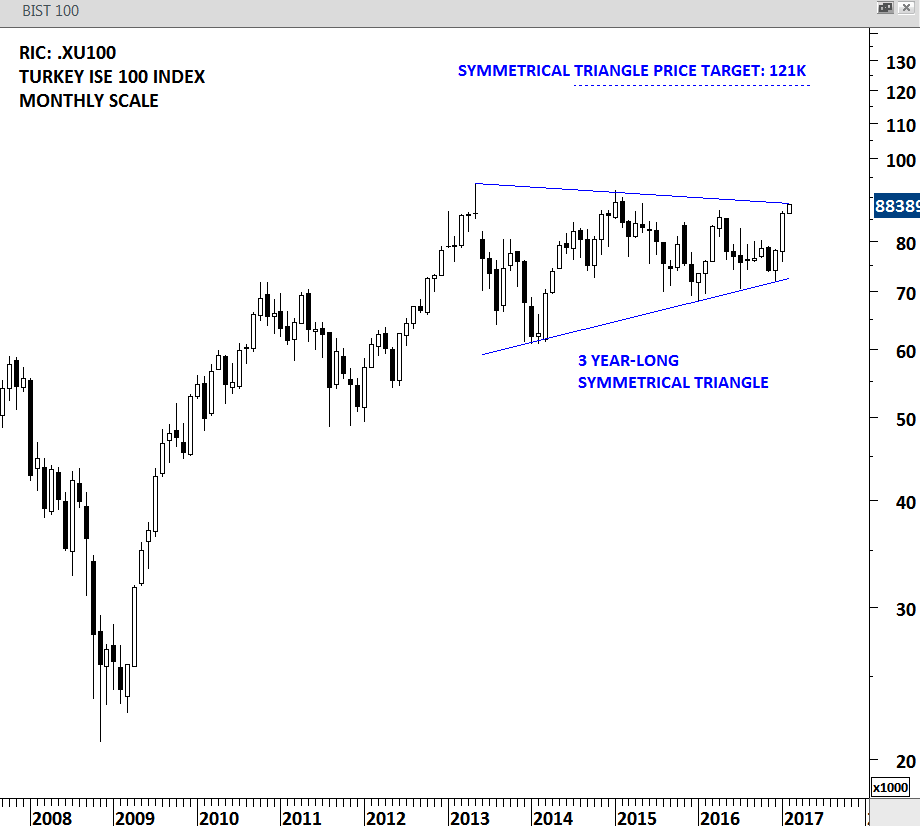
TURKEY BIST 100 INDEX – MONTHLY SCALE
Several great chart setups made it to the #TECHCHARTSWATCHLIST this week from Asia, Europe and the U.S. The length of the identifiable chart patterns range from minimum 4 months to maximum 2 years. I prefer those chart patterns with horizontal boundaries but also pay close attention to mature symmetrical triangles. Head and shoulder tops/bottoms, rectangles and ascending/descending triangles are the classic chart patterns with horizontal boundaries.
MAXITRANS INDUSTRIES (MXI.AX)
MAXITRANS INDUSTRIES is a small-cap stock listed on the Australia Stock Exchange. The company is engaged in the design, manufacture, sale, service and repair of transport equipment and related components, and spare parts. Price chart formed a 2 year-long complex H&S bottom with the strong horizontal resistance standing at 0.645 levels. A daily close above 0.665 levels will confirm the breakout from the bullish reversal chart pattern with a possible price target of 0.90. Stock is testing the horizontal resistance for the 5th time over the past 2 years.
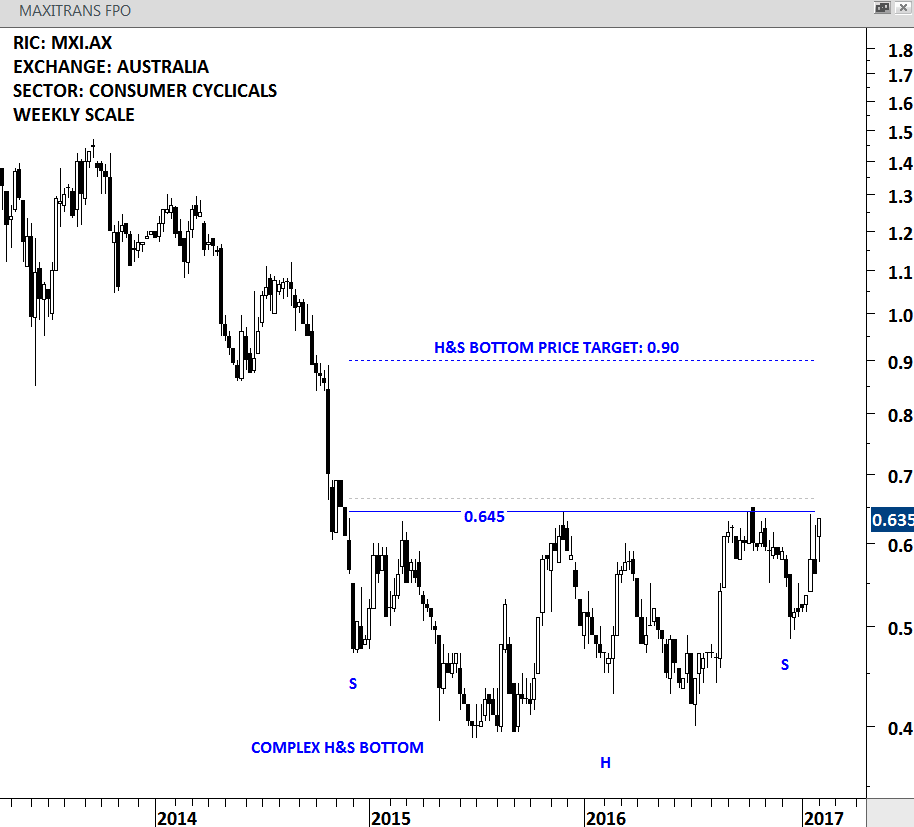
MAXITRANS – WEEKLY SCALE
SOFINA is a Belgium-based holding company that invests, directly and indirectly, in companies from various sectors. Price chart formed a 5 month-long rectangle with the resistance standing at 128.75 levels. Stock is going through a historical low volatility period and usually breakouts from these type of conditions result in strong price action. A daily close above 131 levels will confirm the breakout from the bullish continuation chart pattern.
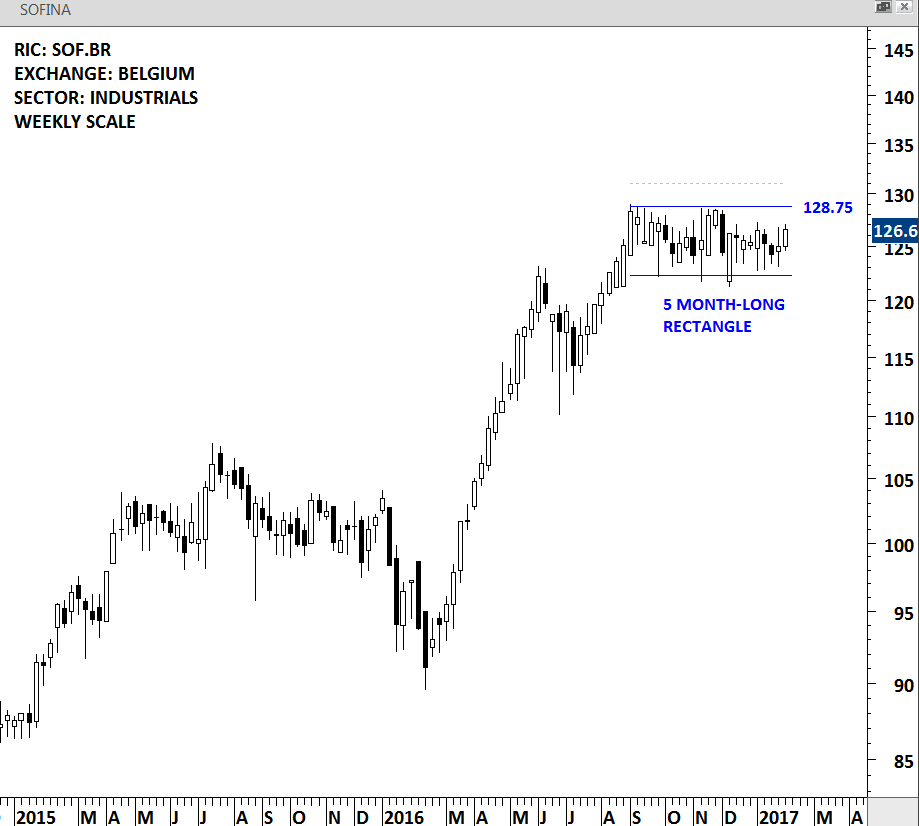
SOFINA – WEEKLY SCALE
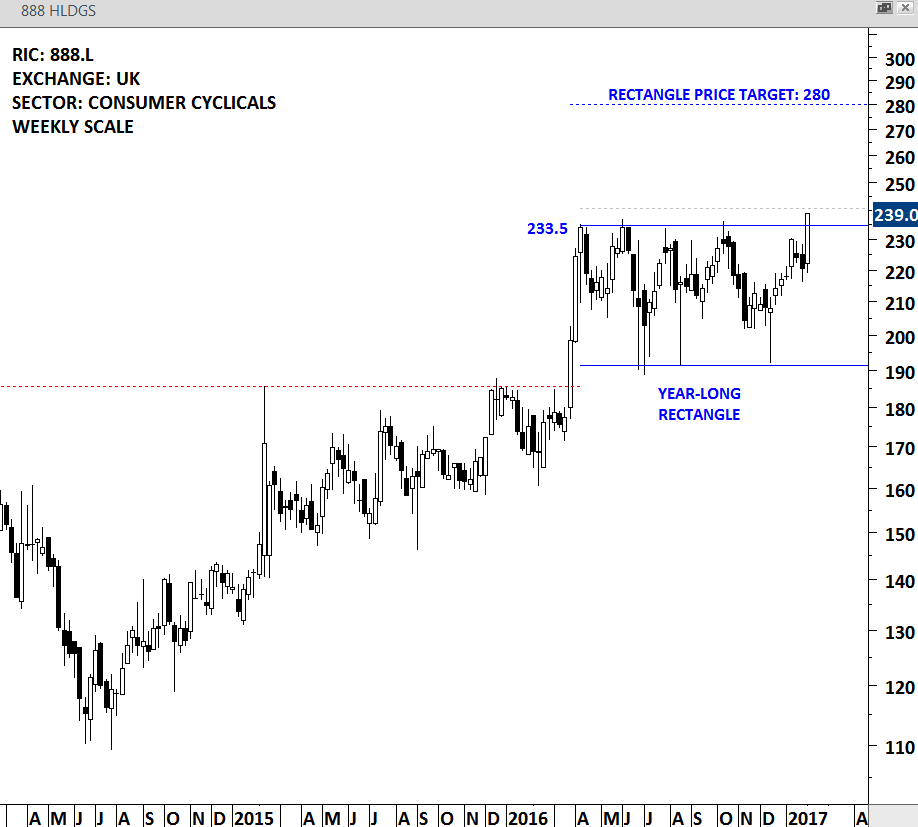
888 HOLDINGS (888.L)
888 Holdings Public Limited Company is a provider of online gaming entertainment and solutions. The company is listed on the London Stock Exchange. Price chart of 888 Holdings formed a year-long rectangle with the strong horizontal resistance at 233.5 levels. This week’s strong weekly close breached the horizontal resistance. Edwards and Magee in their book Technical Analysis of Stock Trends suggest that a stock should breakout by a min 3% margin above the resistance for a clear chart pattern breakout signal. According to this guideline, a daily close above 240.65 levels will confirm the breakout from the year-long rectangle. Rectangle chart pattern price target stands at 280 levels.
888 HOLDINGS – WEEKLY SCALE
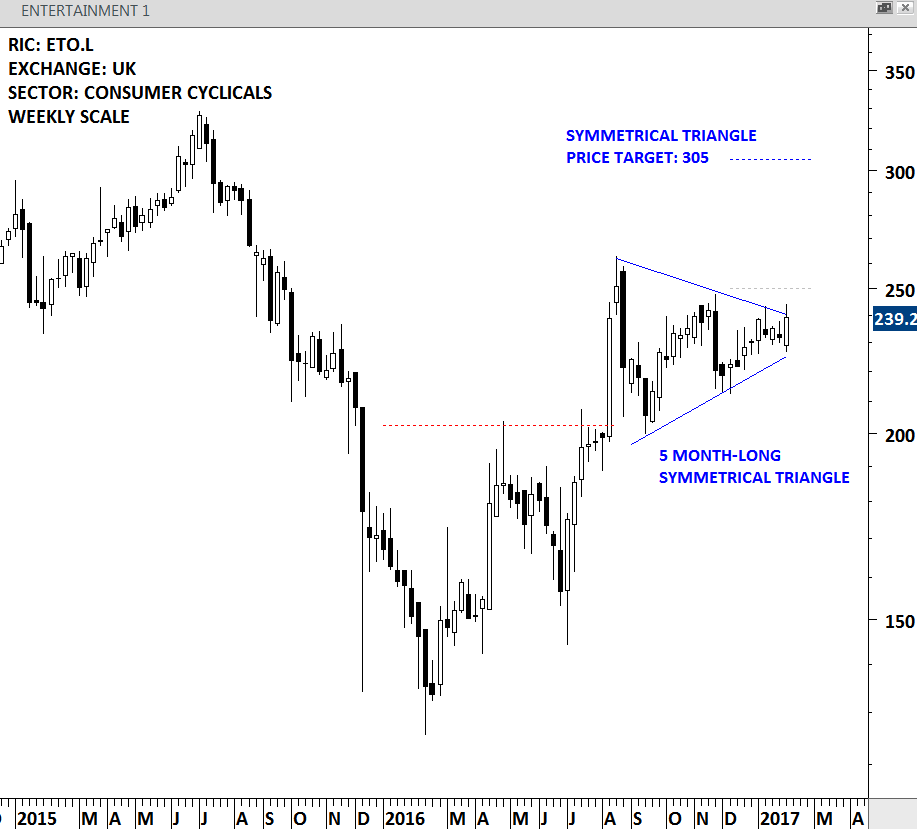
ENTERTAINMENT ONE LTD. (ETO.L)
Entertainment One Ltd. is an independent entertainment company listed on the London Stock Exchange. The Company is focused on the acquisition, production and distribution of television, family, film and music content rights across all media across the world. Price chart formed a 5 month-long symmetrical triangle that should breakout soon. A daily close above 250 levels will confirm the breakout from the tight consolidation range and possibly target 305 levels.
ENTERTAINMENT ONE – WEEKLY SCALE
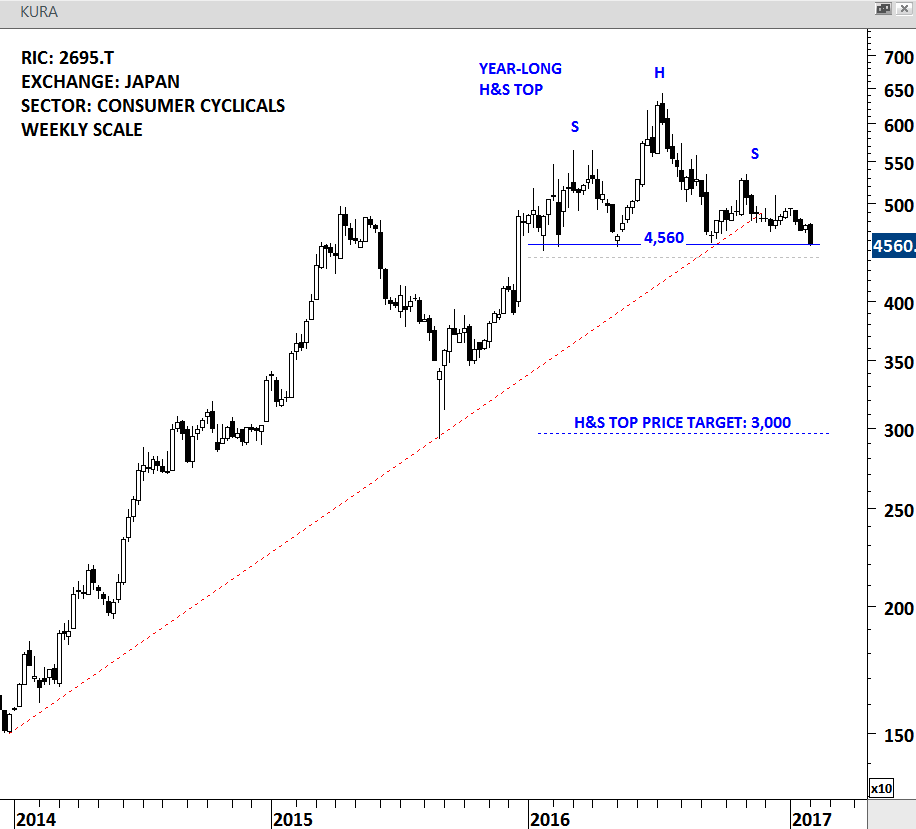
KURA CORP is a consumer cyclical company listed on the Tokyo Stock Exchange. Price chart of KURA CORP formed a year-long H&S top, a bearish reversal chart pattern. The strong horizontal support stands at 4,560 levels. The support was tested for 5 times over the past year. A daily close below 4,425 levels will confirm the bearish reversal chart pattern with a possible price target of 3,000. The symmetry between the shoulders and also several tests of the horizontal support makes this a text-book H&S top.
KURA CORP – WEEKLY SCALE
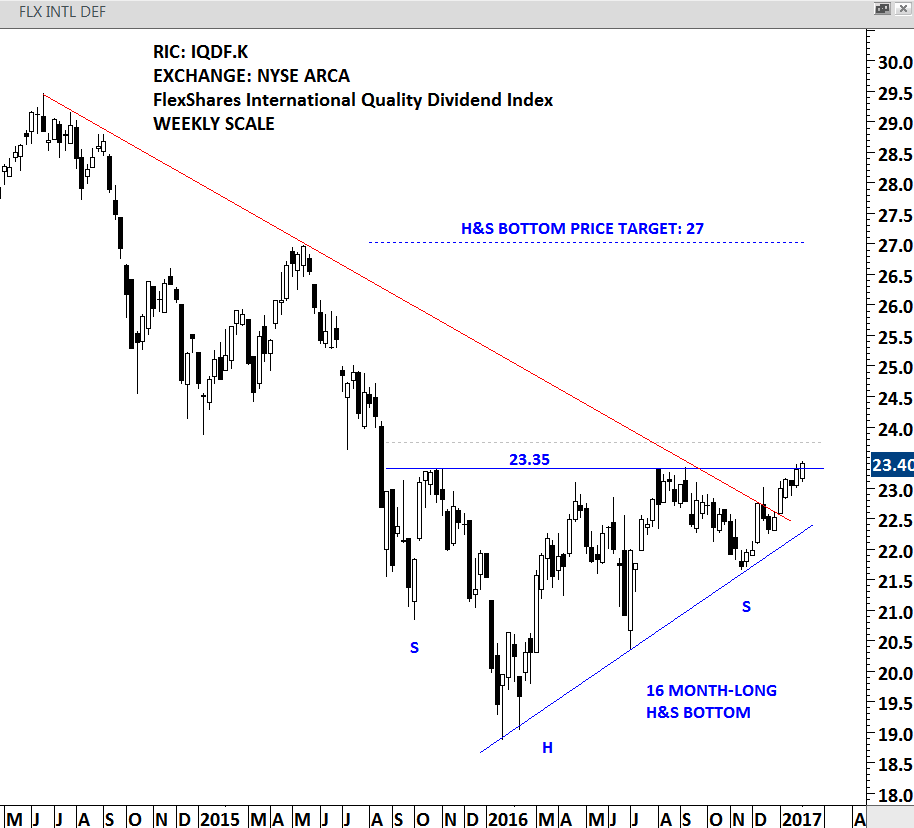
FLEXSHARES INTERNATIONAL QUALITY DIVIDEND INDEX FUND (IQDF.K)
The Fund seeks investment results that correspond generally to the price and yield performance, before fees and expenses, of the Northern Trust International Quality Dividend Index. The underlying index is designed to provide exposure to a high-quality, income-oriented portfolio of international equity securities. It’s geographical focus is global ex U.S. The fund is listed by NYSE Arca. Price chart formed a 16 month-long H&S bottom or possibly an ascending triangle that could act as a bottom reversal. The strong horizontal resistance stands at 23.35 levels. A daily close above 23.75 levels will confirm the breakout from the multi-month base formation with a possible price target of 27 levels.
FLX INTL DEF – WEEKLY SCALE
BOYD GAMING (BYD)
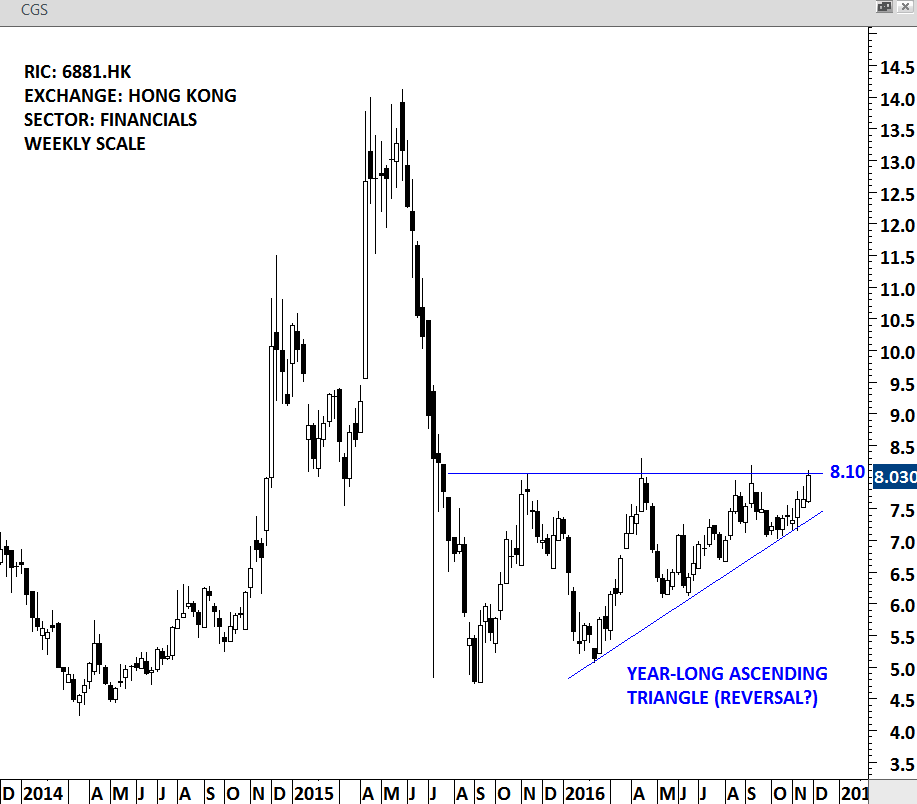
Boyd Gaming Corporation is a multi-jurisdictional gaming company. The company is listed on the NYSE. Price chart formed a year-long ascending triangle with the strong horizontal boundary standing at 21.30 levels. Ascending triangle is considered to be a bullish continuation chart pattern. A daily close above 21.95 levels will confirm the breakout after the 5th test of the upper boundary over the past year. Price target for the ascending triangle stands at 28 levels.
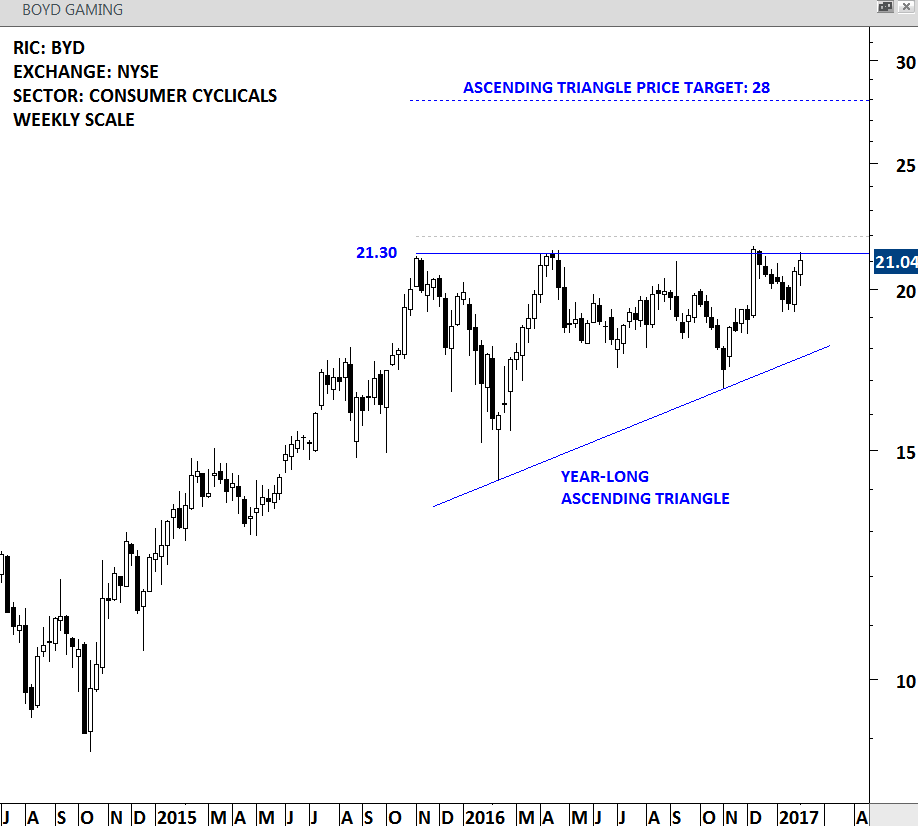
BOYD GAMING – WEEKLY SCALE
SPDR S&P BIOTECH ETF (XBI)
The Fund seeks to replicate as closely as possible the performance of an index derived from the biotechnology segment of a U.S. total market composite index. The Fund uses a passive management strategy designed to track the total return performance of the S&P Biotechnology Select Industry Index. SPDR S&P BIOTECH ETF is listed on the NYSE. Price chart formed a 4 month-long symmetrical triangle with the upper boundary at 66 levels acting as resistance. A daily close above 67.35 levels will confirm the breakout from the sideways consolidation.
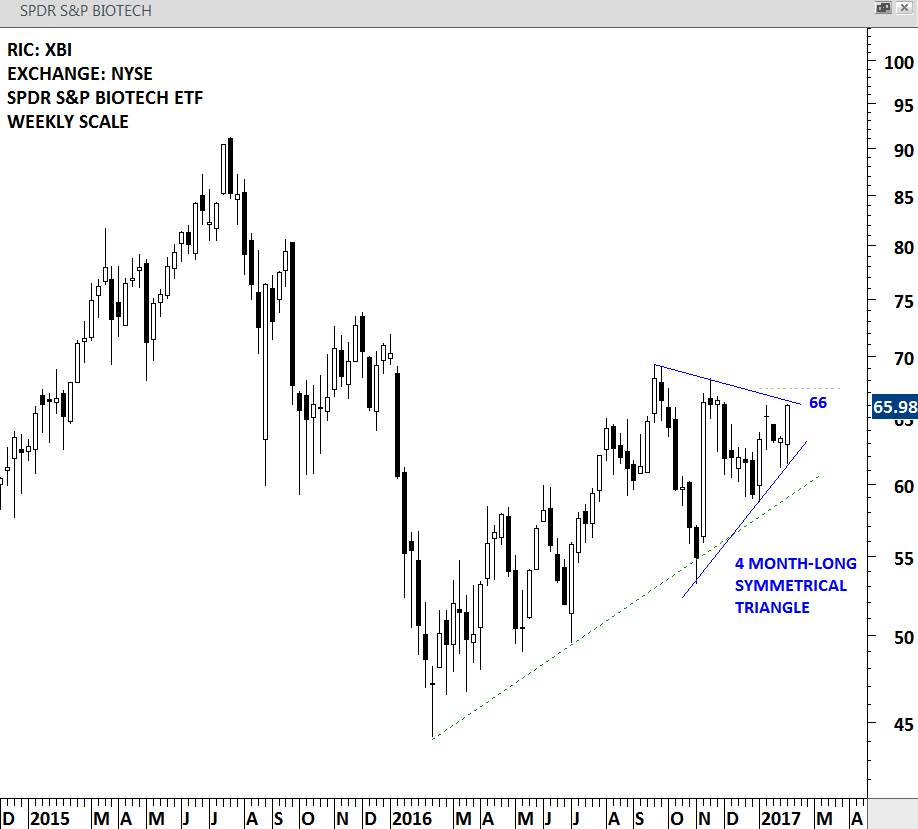
SPDR S&P BIOTECH ETF -WEEKLY SCALE
MULTIPOLAR TBK (MLPL.JK)
PT Multipolar Tbk is an Indonesia-based investment holding company. The company is listed on the Jakarta Stock Exchange. Price chart formed a 9 month-long symmetrical triangle following a sharp rise in the first quarter of 2016. The upper boundary of the symmetrical triangle stands at 406 levels. A daily close above 418 levels will confirm the breakout from the consolidation range and suggest higher levels for the stock in the coming weeks.
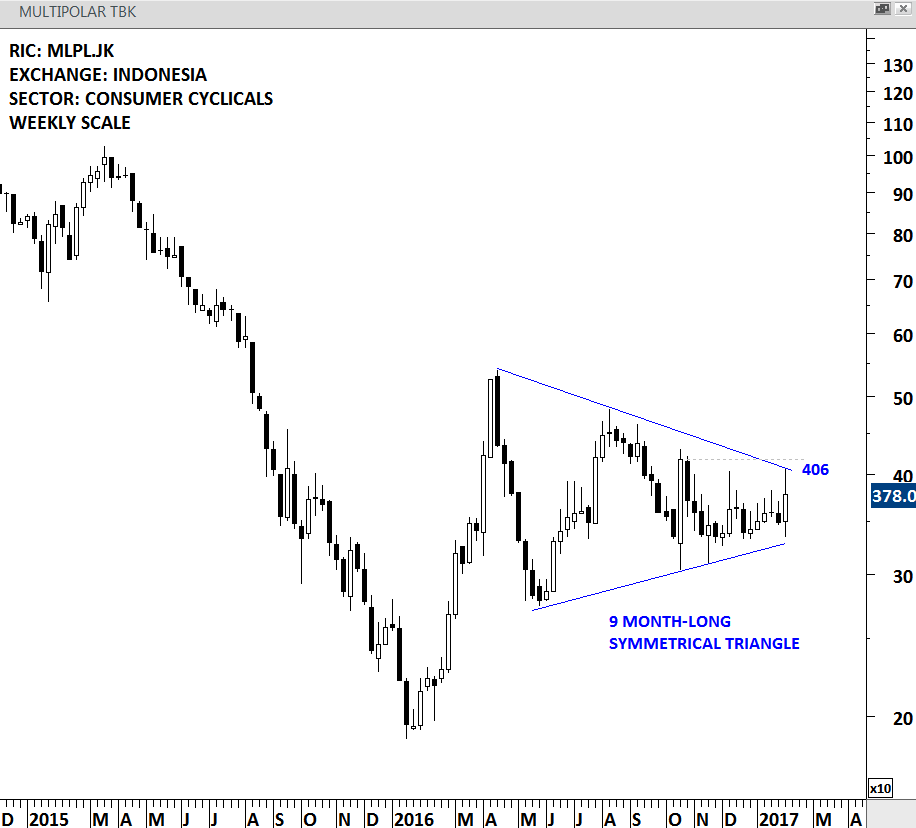
MULTIPOLAR TBK – WEEKLY SCALE
Breakouts from bullish chart patterns to all time high levels are signals a trader can’t ignore. Breakout to all time high level means that the stock doesn’t have any resistance ahead. Completion of a bullish chart pattern itself is a positive technical signal. There has been two chart pattern breakout signals that met the above conditions and made it to the #TECHCHARTSALERT this week.
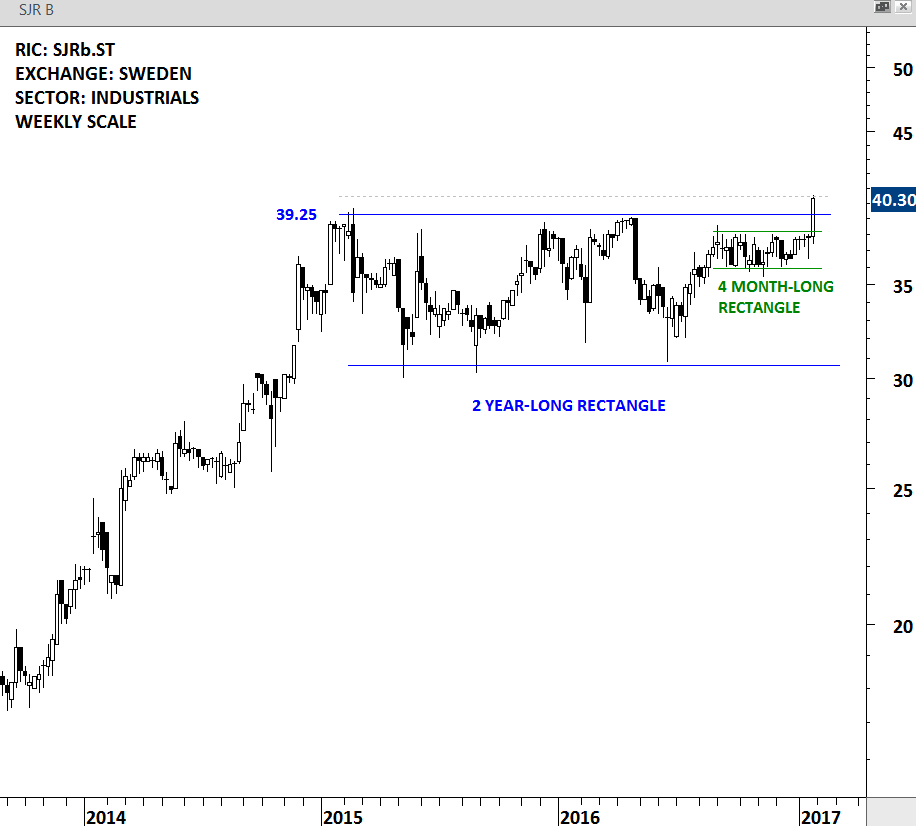
SJR IN SCANDINAVIA AB (SJRb.ST)
SJR is a small-cap Sweden-based staff recruitment company primarily focusing on the economic, banking and financial sectors. Price chart completed a 2 year-long rectangle followed by the breakout from the short-term 4 month-long rectangle. SJR IN SCANDINAVIA is at all-time high levels. Possible price target for the rectangle chart pattern stands at 48 levels.
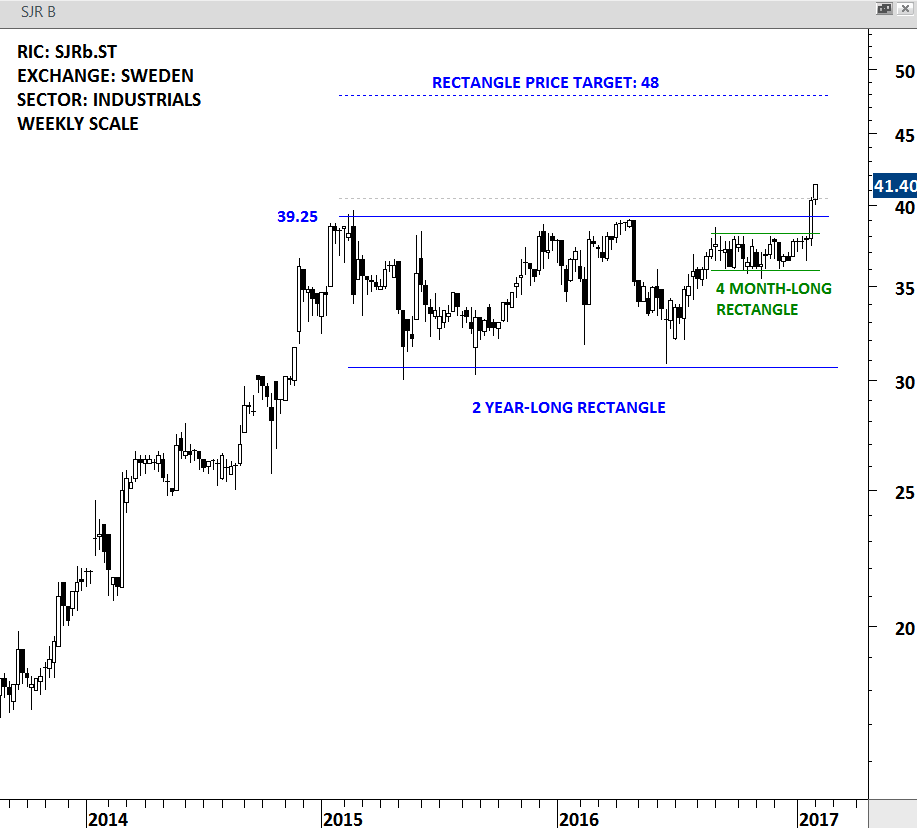
SJR – WEEKLY SCALE
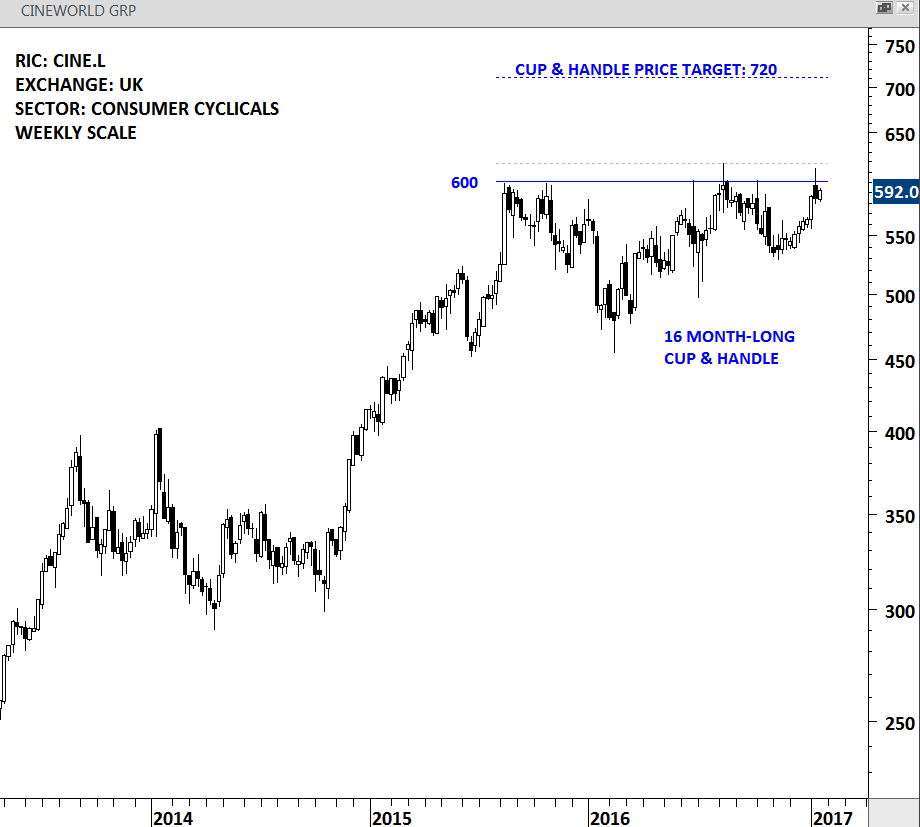
CINEWORLD GROUP (CINE.L)
CINEWORLD GROUP is a consumer cyclical company listed on the London Stock Exchange. Price chart completed a 16 month-long cup & handle chart pattern and broke out to all-time high levels. Cup & handle is a bullish continuation chart pattern and has a possible price target of 720 levels.
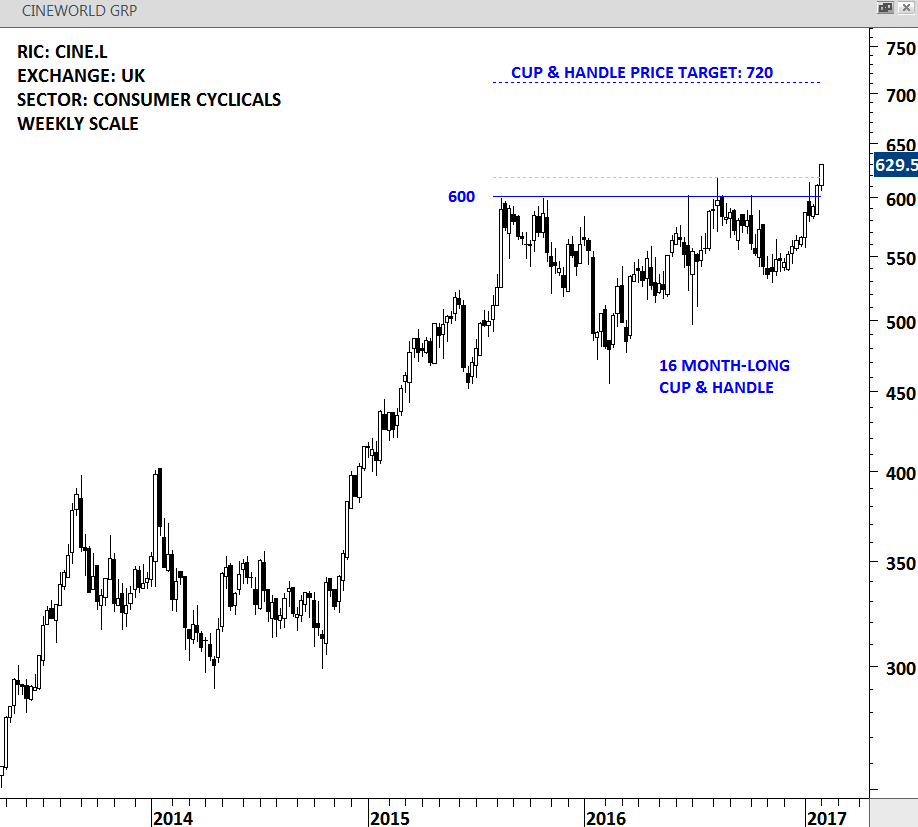
CINEWORLD GROUP – WEEKLY SCALE
TURKIYE VAKIFLAR BANKASI (VAKBN.IS)
Turkiye Vakiflar Bankasi TAO (Vakifbank) is a Turkey-based commercial bank. The company is listed on the Istanbul Stock Exchange. Price chart completed a 3 year-long symmetrical triangle followed by a medium-term 9 month-long symmetrical triangle. These are clearly bullish signals for the stock. Possible price target for the 9 month-long symmetrical triangle stands at 6 levels.
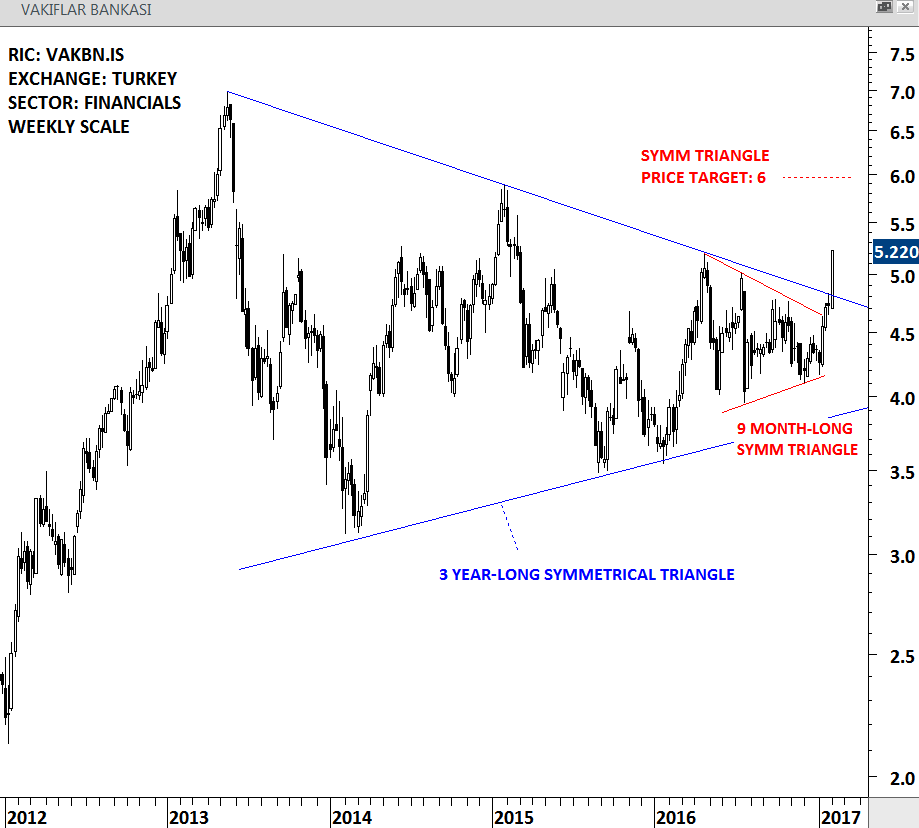
VAKIF BANK – WEEKLY SCALE
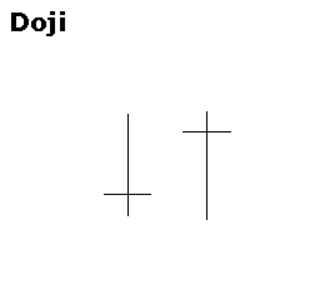
Doji are important candlesticks that provide information on their own and as components of in a number of important patterns. Doji form when a security's open and close are virtually equal. The length of the upper and lower shadows can vary and the resulting candlestick looks like a cross, inverted cross or plus sign. Alone, doji are neutral patterns. Any bullish or bearish bias is based on preceding price action and future confirmation.