
GLOBAL EQUITY MARKETS – February 25, 2017
Compared to traditional bar charts, candlestick charts can be more helpful to analyze price action. We can see the relationship between the open and close as well as the high and low. The relationship between the open and close is considered vital information and forms the essence of candlesticks. This week’s price action in global equity markets is worth analyzing with the help of candlestick chart patterns.
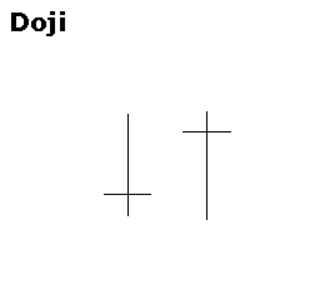
Doji are important candlesticks that provide information on their own and as components of in a number of important patterns. Doji form when a security’s open and close are virtually equal. The length of the upper and lower shadows can vary and the resulting candlestick looks like a cross, inverted cross or plus sign. Alone, doji are neutral patterns. Any bullish or bearish bias is based on preceding price action and future confirmation.
Doji convey a sense of indecision between buyers and sellers. Prices move above and below the opening level during the session, but close at or near the opening level. Neither bulls nor bears were able to gain control and a turning point could be developing. The relevance of a doji depends on the preceding trend or preceding candlesticks. After an advance, or long white candlestick, a doji signals that the buying pressure is starting to weaken.
ISHARES MSCI ALL COUNTRIES WORLD INDEX ETF (ACWI.O)
After a year-long uptrend ISHARES MSCI ALL COUNTRIES WORLD INDEX ETF (ACWI.O) reached its 2015 high levels that acted as resistance. This week’s price action formed a Doji on the weekly scale chart. Given that the preceding trend was up and strong, this week’s Doji clearly suggested that the buying power has stalled. Strong horizontal resistance stands at 63 levels. Global equities can experience a consolidation of the earlier gains and possibly a pullback towards the year-long upward trend line. Doji alone is not enough to forecast a reversal. Following week’s price action around the strong resistance will provide valuable information.
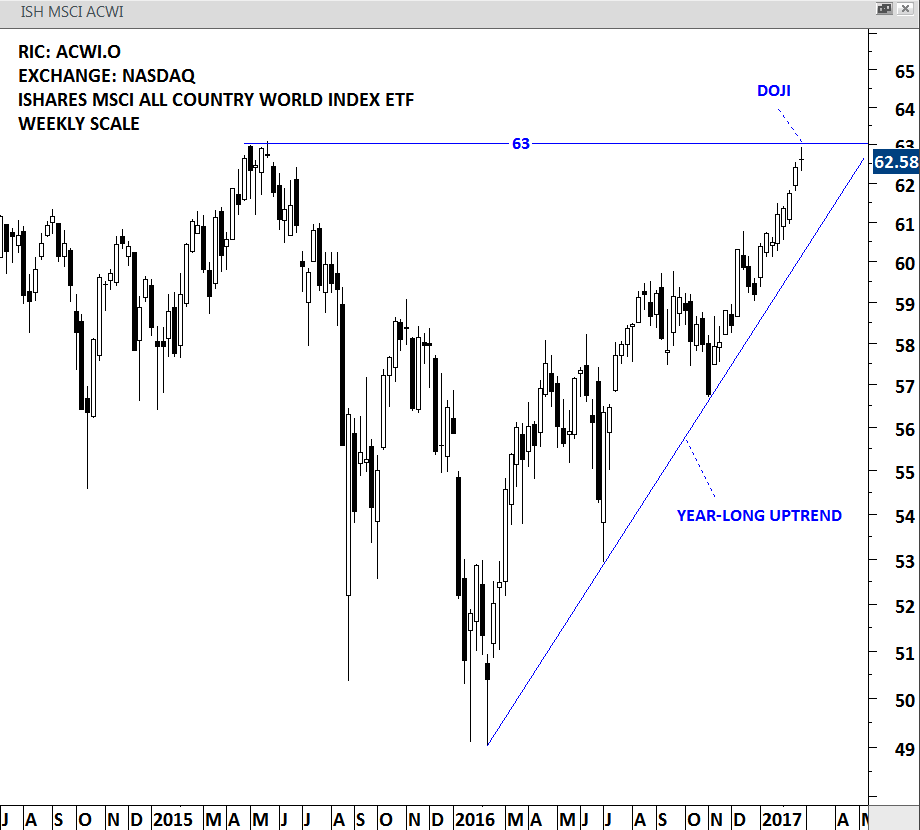
ISHARES MSCI ACWI ETF – WEEKLY SCALE
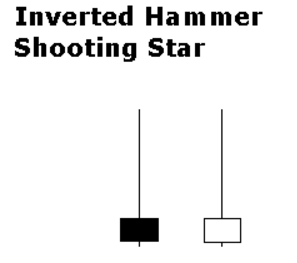
The Inverted Hammer and Shooting Star look exactly alike, but have different implications based on previous price action. These candlesticks mark potential trend reversals, but require confirmation before action. The Shooting Star is a bearish reversal pattern that forms after an advance and in the star position, hence its name. A Shooting Star can mark a potential trend reversal or resistance level. The candlestick forms when prices gap higher on the open, advance during the session and close well off their highs. The resulting candlestick has a long upper shadow and small black or white body. Bearish confirmation is required after the Shooting Star and can take the form of a gap down or long black candlestick.
ISHARES MSCI EMERGING MARKETS INDEX ETF (EEM)
 ISHARES MSCI EMERGING MARKETS INDEX ETF (EEM) has been in a choppy uptrend since the beginning of 2016. Over the past two months the ETF moved higher uninterrupted. This week’s price action reached an important resistance area and formed a Shooting Star on the weekly scale price chart. While the chandlestick chart pattern has a bearish implication, we need further evidence in the following week to call for a reversal. Though, when analyzed with the Doji on the ISHARES MSCI ALL COUNTRIES WORLD INDEX ETF, we can conclude that the buying momentum is possibly weakening in the short-term.
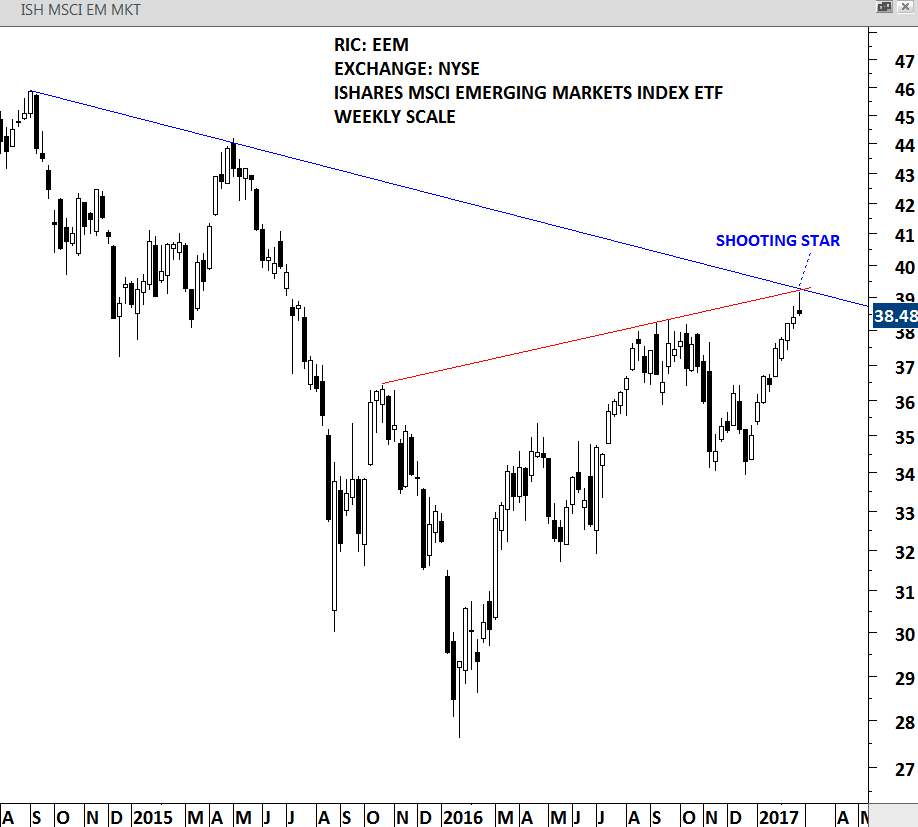
ISHARES MSCI EMERGING MARKETS ETF – WEEKLY SCALE
#TECHCHARTSWATCHLIST
KURA CORP (2695.T)
KURA CORP is a consumer cyclical company listed on the Tokyo Stock Exchange. Price chart of KURA CORP formed a year-long H&S top, a bearish reversal chart pattern. The strong horizontal support stands at 4,560 levels. The support was tested for 5 times over the past year. A daily close below 4,425 levels will confirm the bearish reversal chart pattern with a possible price target of 3,000. The symmetry between the shoulders and also several tests of the horizontal support makes this a text-book H&S top.
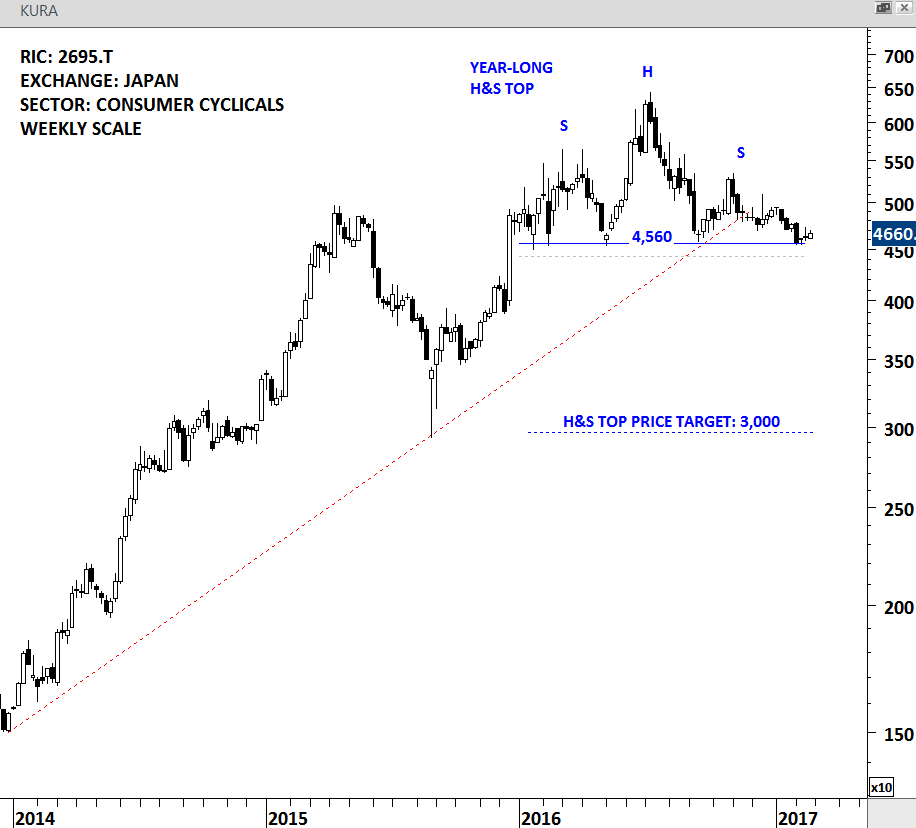
KURA CORP – WEEKLY SCALE
BAIYUNSHAN PHARMACEUTICALS HOLDINGS CO. (0874.HK)
Baiyunshan Pharmaceutical Holdings Company Limited is engaged in the pharmaceutical and healthcare industry. The stock is listed on the Hong Kong Stock Exchange. Price chart formed a 7 month-long rectangle with the strong horizontal resistance standing at 20.80 levels. Over the past 7 months, horizontal boundary was tested more than four times and a breakout above the pattern boundary can result in a strong directional move. A daily close above 21.40 will confirm the breakout from the sideways consolidation.
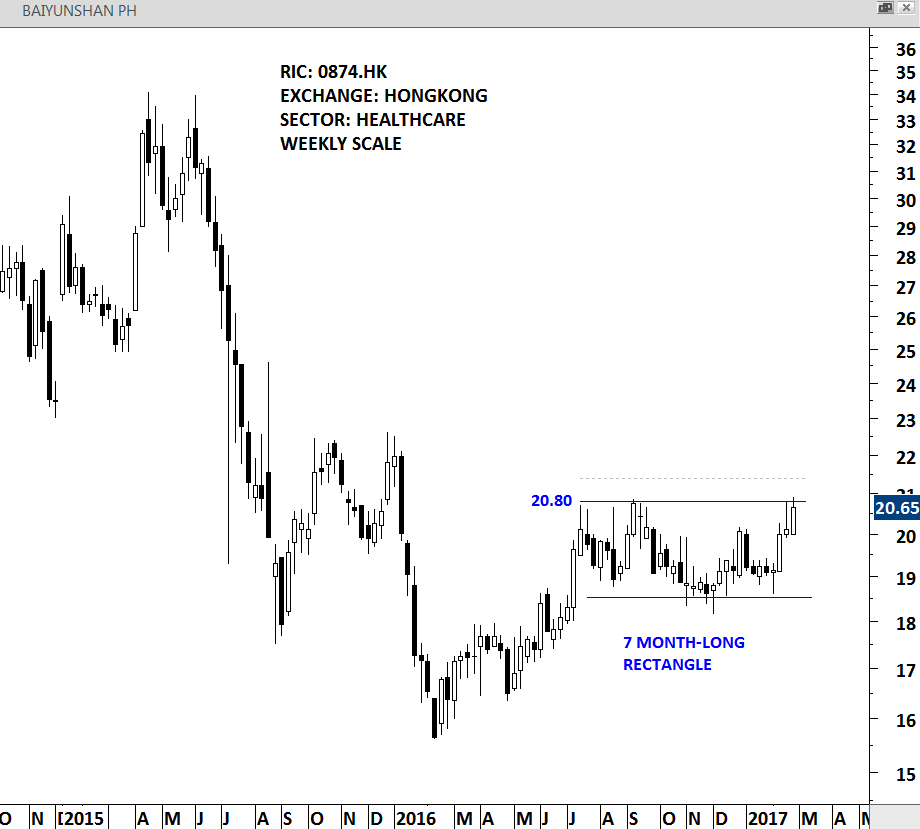
BAIYUNSHAN PHARM – WEEKLY SCALE
CITIC BANK (0998.HK)
CHINA CITIC BANK CORPORATION LIMITED is a commercial bank that is listed on the Hong Kong Stock Exchange. Price chart of the stock formed an 18 month-long H&S bottom with the neckline standing at 5.35 levels. The neckline can also be drawn as an upward sloping line. In either case a daily close above 5.50 will confirm the breakout from the multi-month base formation. H&S bottom chart pattern price target stands at 6.7 levels.
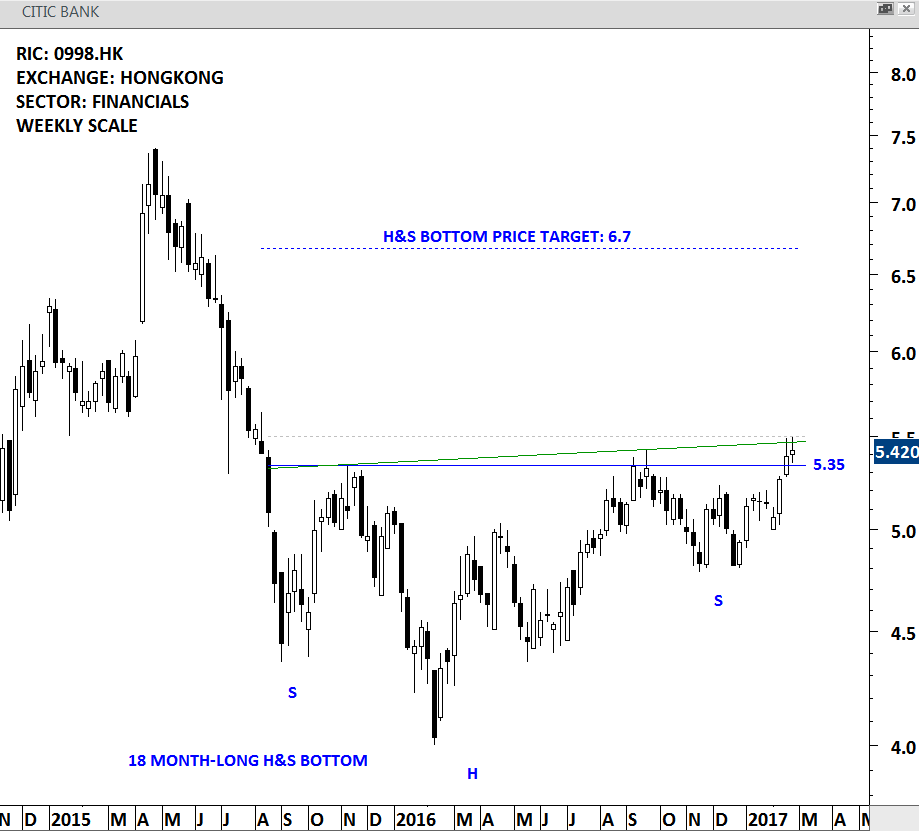
CITIC BANK – WEEKLY SCALE
IDACORP INC. (IDA)
IDACORP, Inc. is a holding company. The Company’s operating subsidiary is Idaho Power Company (Idaho Power), which is an electric utility engaged in the generation, transmission, distribution, sale and purchase of electric energy and capacity. The stock is listed on the NYSE. Price chart formed a 7 month-long H&S continuation chart pattern. The neckline of the H&S continuation chart pattern stands at 82 levels. This week’s price action closed above 82 levels. A daily close above 84 will confirm breakout from the bullish continuation chart pattern with a possible price target of 90.5.
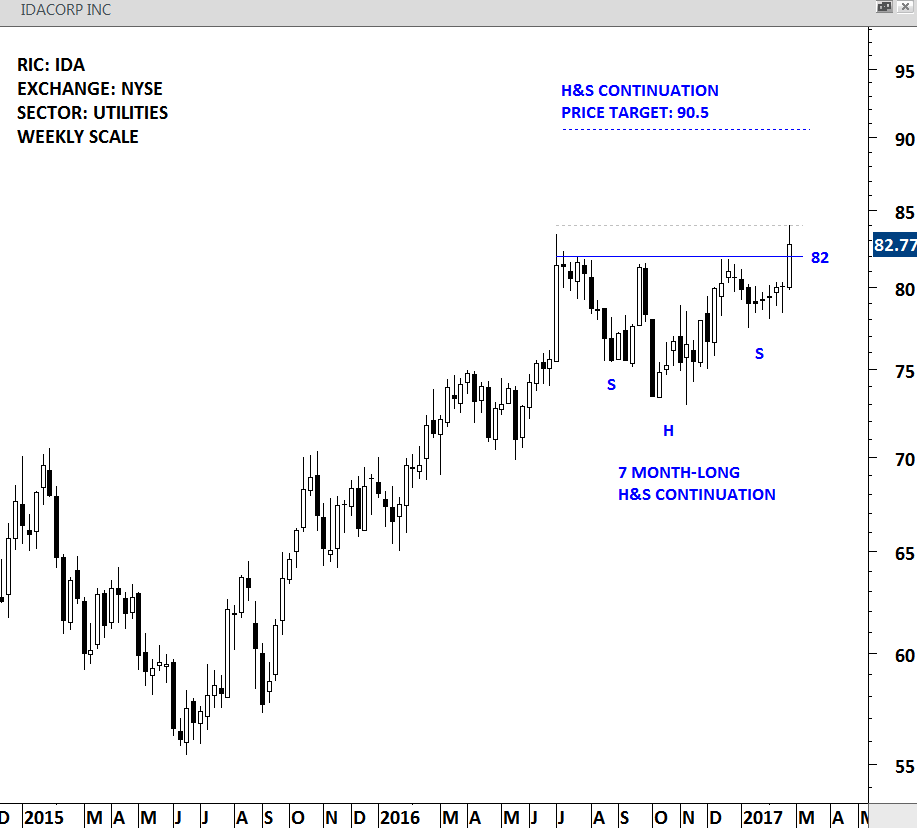
IDACORP – WEEKLY SCALE
AMDOCS LTD. (DOX.O)
Amdocs Limited is a provider of software and services for communications, entertainment and media industry service providers. The stock is listed on the Nasdaq Stock Exchange. Price chart formed a year-long ascending triangle which is considered to be a bullish continuation. Strong horizontal resistance was tested for five times over the past year. Breakout can result in a strong directional move. Horizontal resistance stands at 61.35 levels. A daily close above 62.60 will confirm the breakout with a possible chart pattern price target of 72 levels.
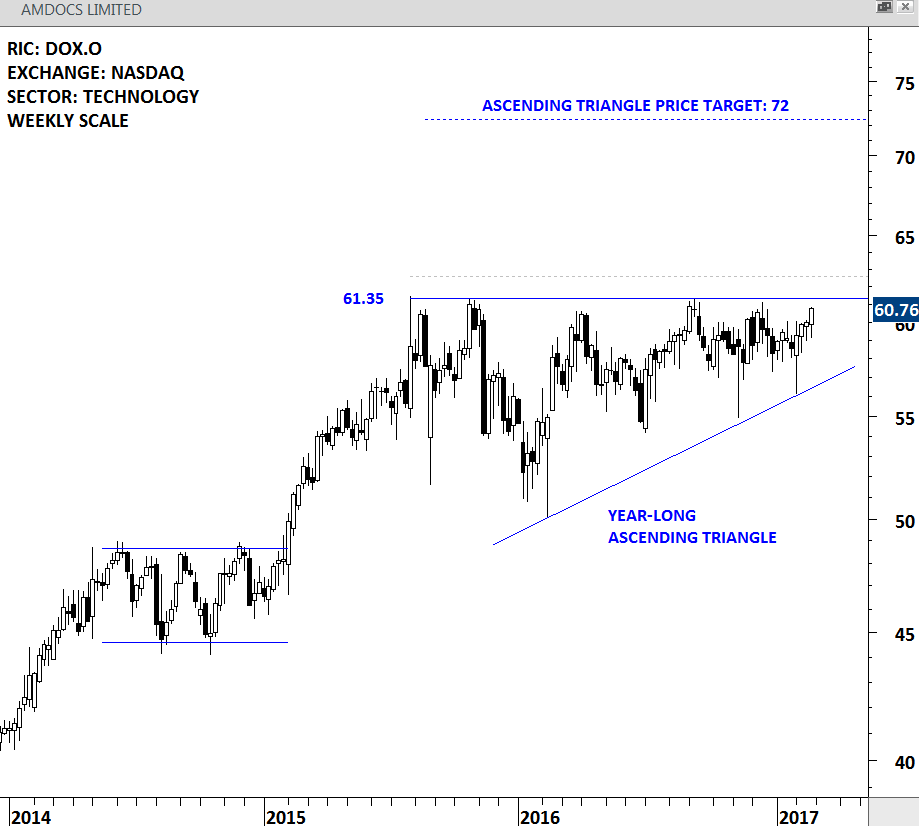
AMDOCS LIMITED – WEEKLY SCALE
#TECHCHARTSALERT
There were two new breakout alerts during the week. Both stocks cleared multi-month rectangle continuation chart patterns.
ORACLE CORP (ORCL.K)
Oracle Corporation (Oracle) provides products and services that address all aspects of corporate information technology (IT) environments, including application, platform and infrastructure. The Company’s businesses include cloud and on-premise software, hardware and services. Price chart completed a 10 month-long rectangle with the close above 42.85 levels. Strong weekly scale close added to the positive outlook. Possible chart pattern price target stands at 46 levels.

ORACLE CORP – WEEKLY SCALE
SHMOLZ & BICKENBACH AG (STLN.S)
Schmolz & Bickenbach AG, formerly Swiss Steel AG, is a Switzerland-based manufacturer of tool steel and non-corrosive long steel, as well as alloyed and high-alloyed constructional steel. The stock is listed on the Swiss Stock Exchange. Price chart completed a 7 month-long rectangle chart pattern with a daily close above 0.755 levels. Possible rectangle continuation chart pattern price target stands at 0.9 levels.
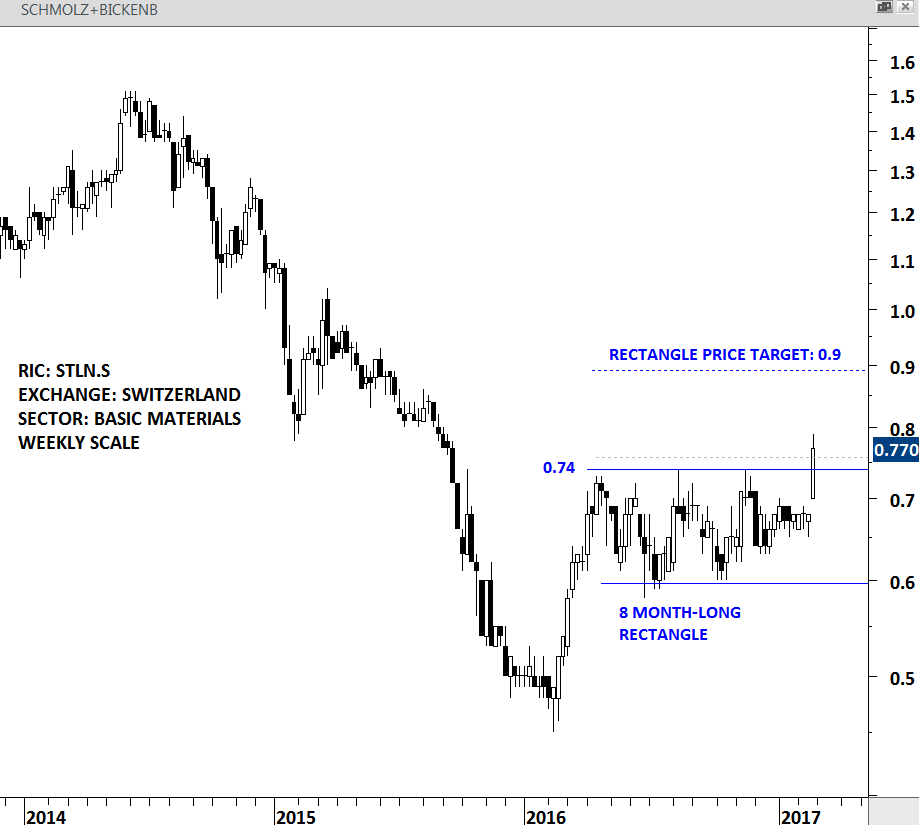
SCHMOLZ & BICKEN – WEEKLY SCALE