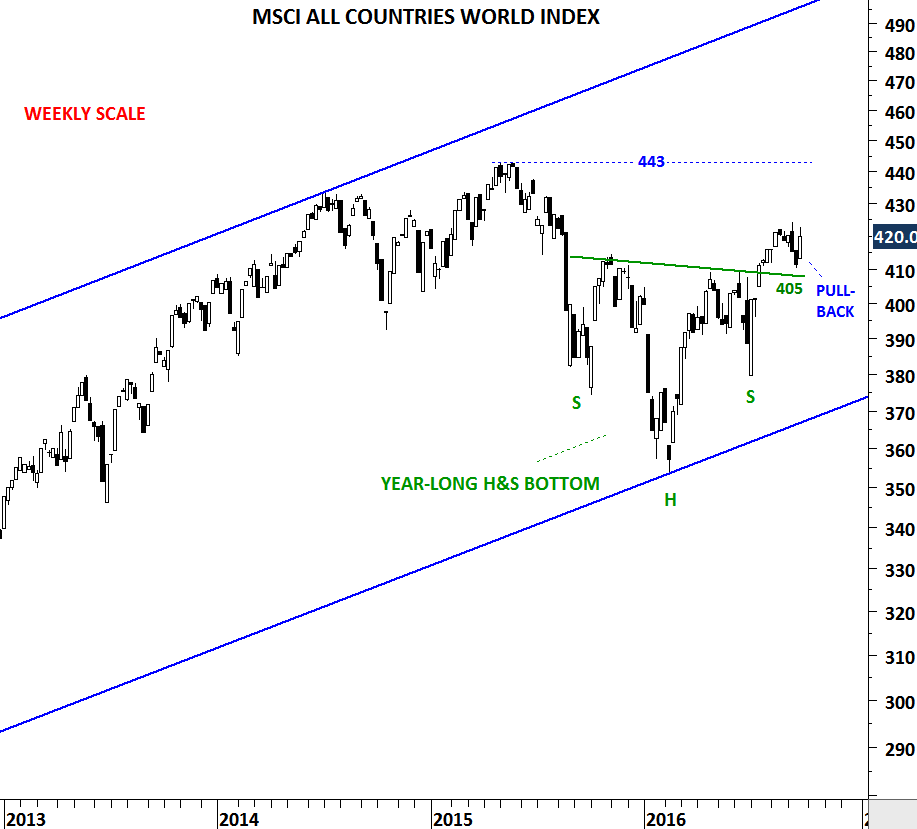
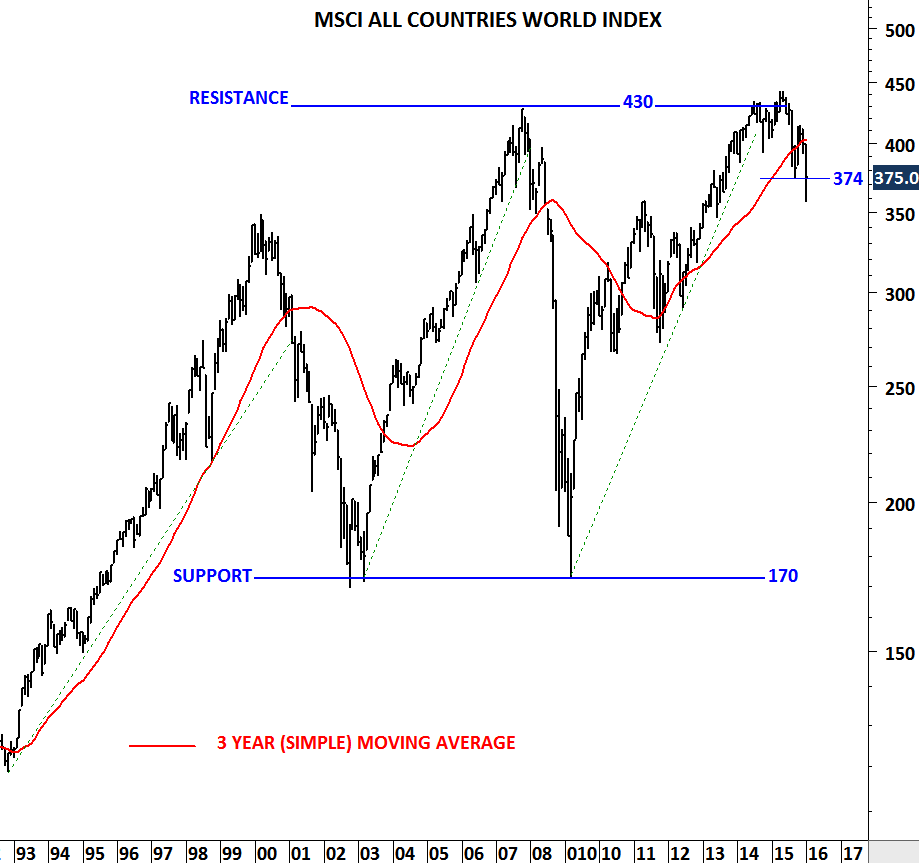
This was another strong week for global equities. Both MSCI ALL COUNTRIES WORLD INDEX and MSCI EMERGING MARKETS INDEX finished the week with strong weekly candlesticks, opening at the lower end and closing at the highest level for the week.
ISHARES MSCI ALL COUNTRIES WORLD INDEX ETF (ACWI.O)
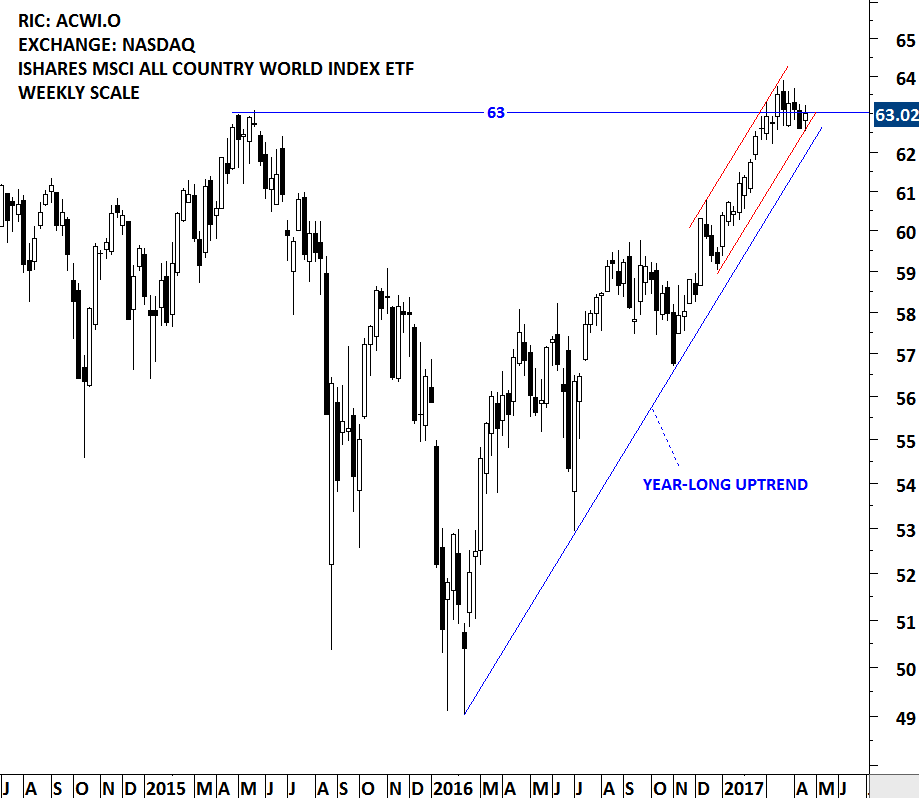
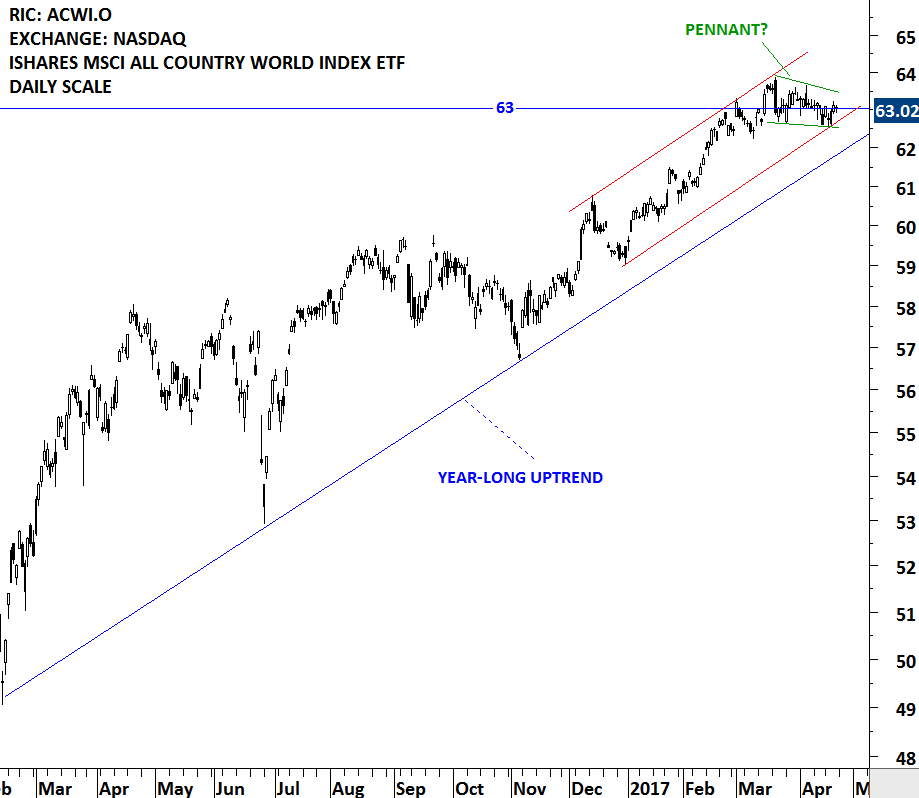
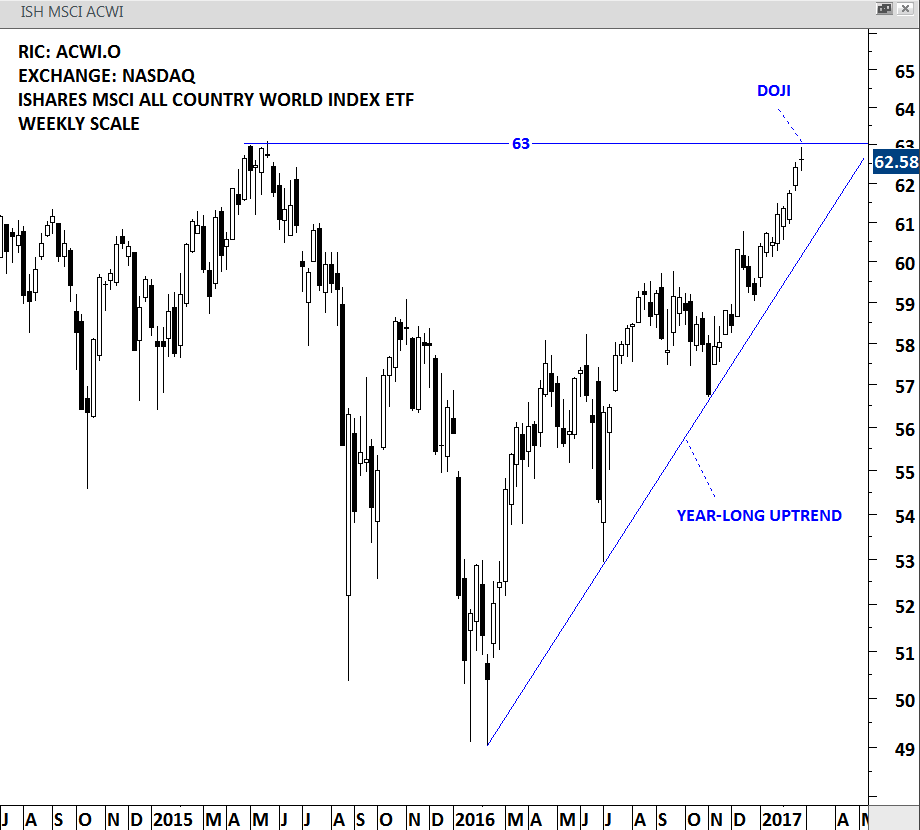
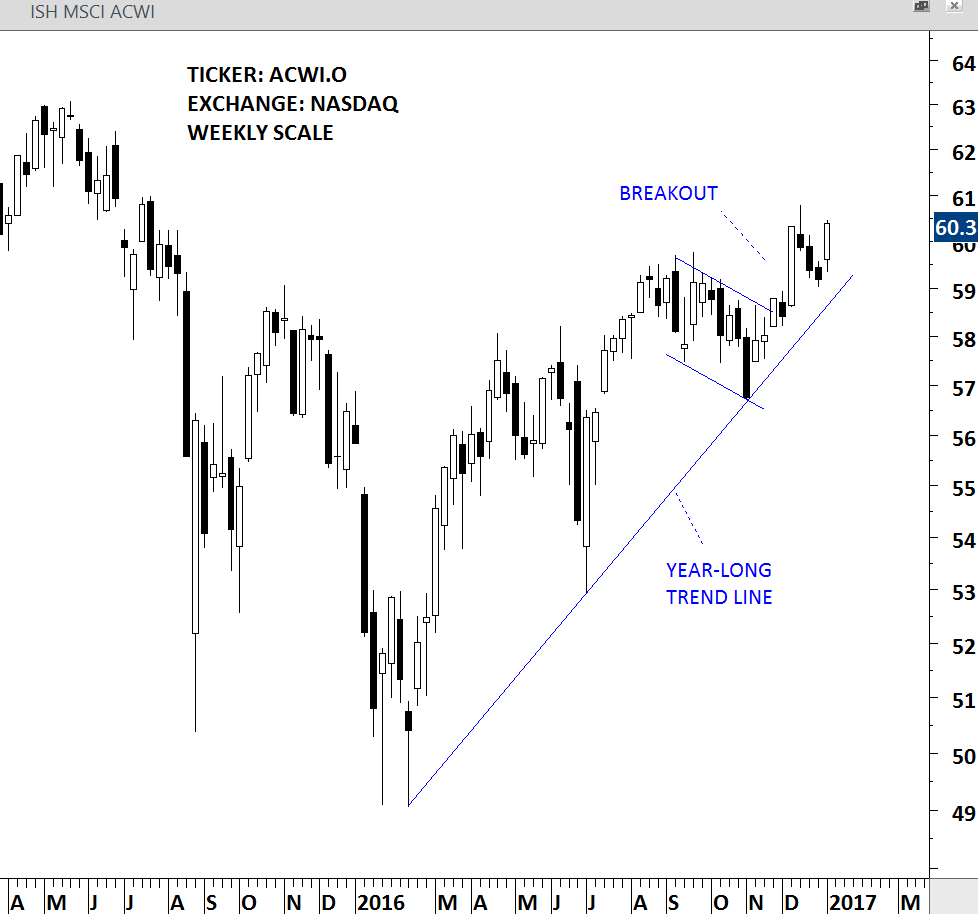
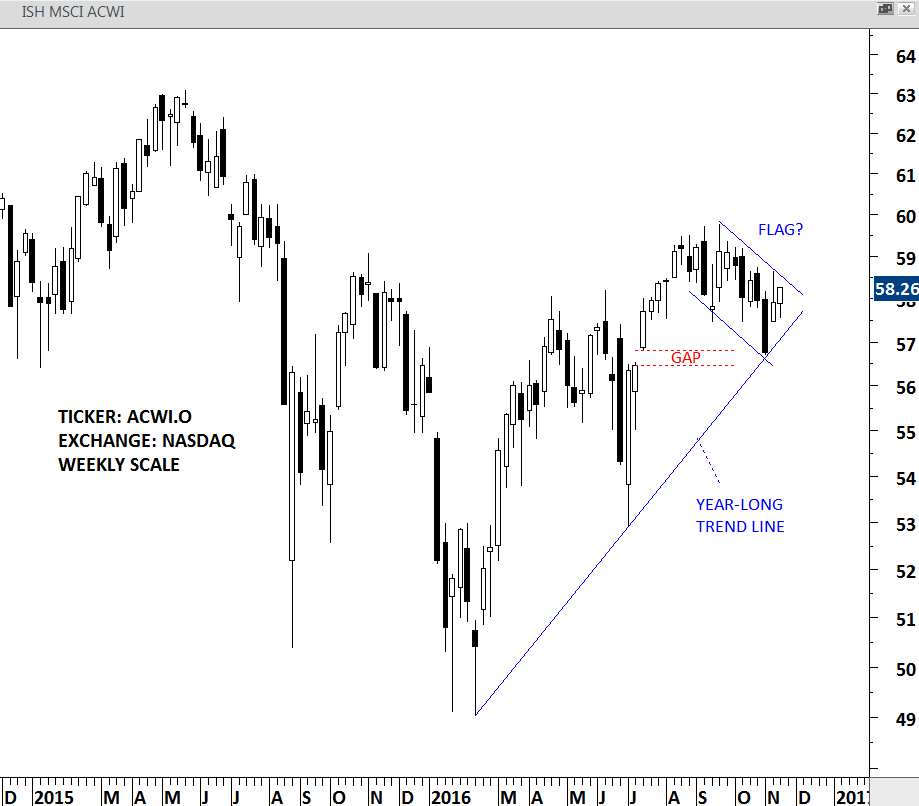
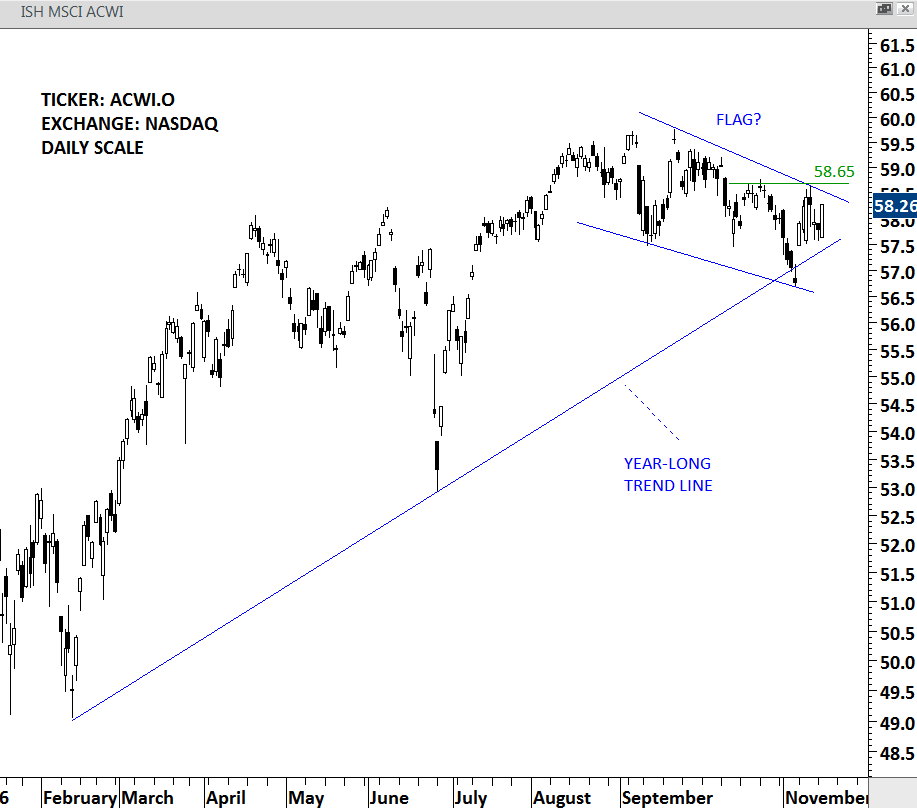
The MSCI ACWI captures large and mid cap representation across 23 developed markets and 23 emerging markets countries. With 2,486 constituents, the index covers approximately 85% of the global investable equity opportunity set. The iShares MSCI ACWI ETF seeks to track the investment results of the MSCI ACWI. The ETF is listed in the NYSE. Price chart of the iShares MSCI ACWI ETF shows the strong uptrend that started in the beginning of 2016. Year-long upward sloping trend line will act as support between 59 and 59.50 area. Until the long-term trend line is violated we should expect higher levels for the global equity benchmark.
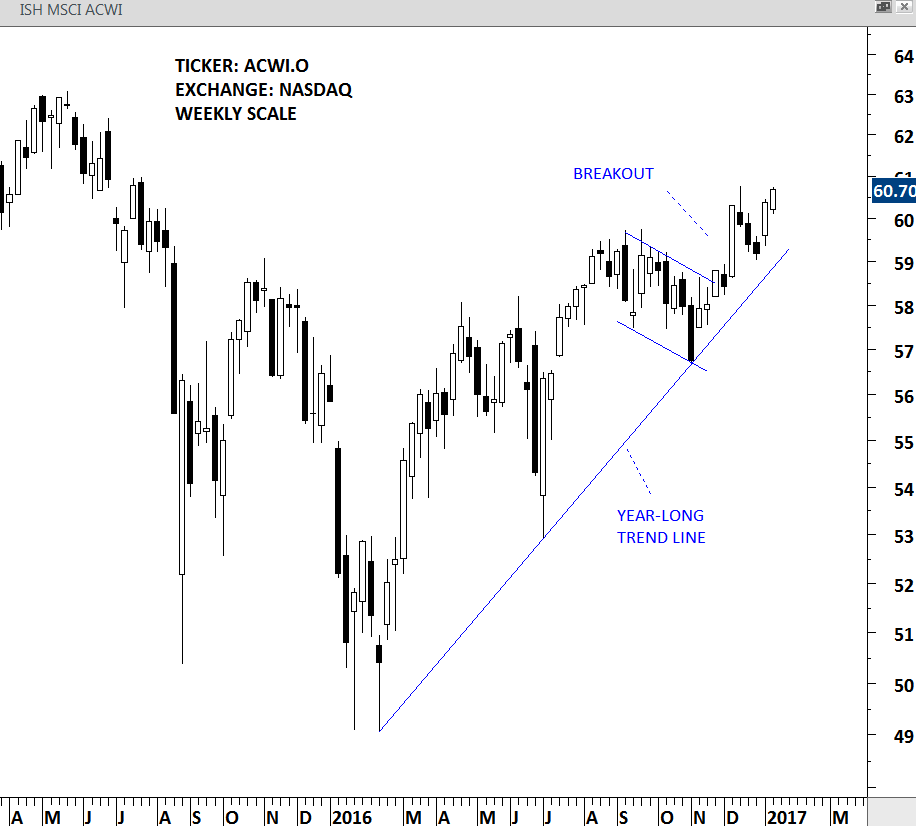
ISHARES ACWI ETF – WEEKLY SCALE
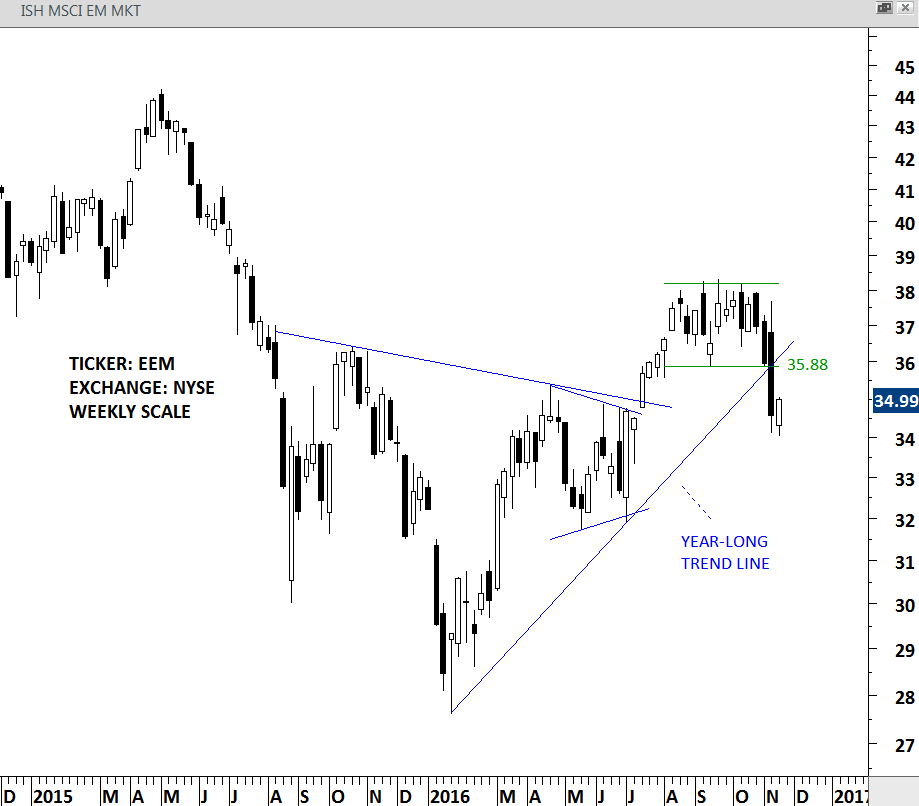
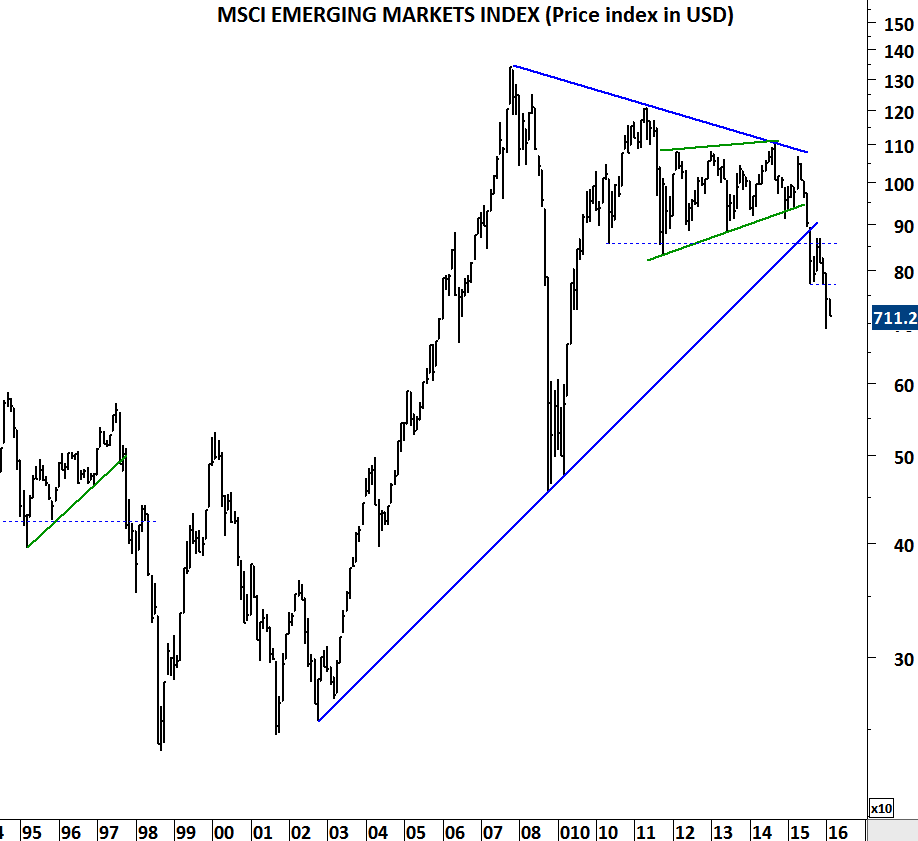
ISHARES MSCI EMERGING MARKETS ETF (EEM)
ISHARES MSCI EMERGING MARKETS ETF had a strong week. Over the past three weeks strength in the emerging markets pushed the NYSE listed iShares MSCI EM ETF from 34 levels to 36.68 levels. Last week’s price action possibly completed a double bottom. If EEM manages to hold above 36.40 levels in the following weeks, next price target could be the September 2016 high at 38.20 levels.
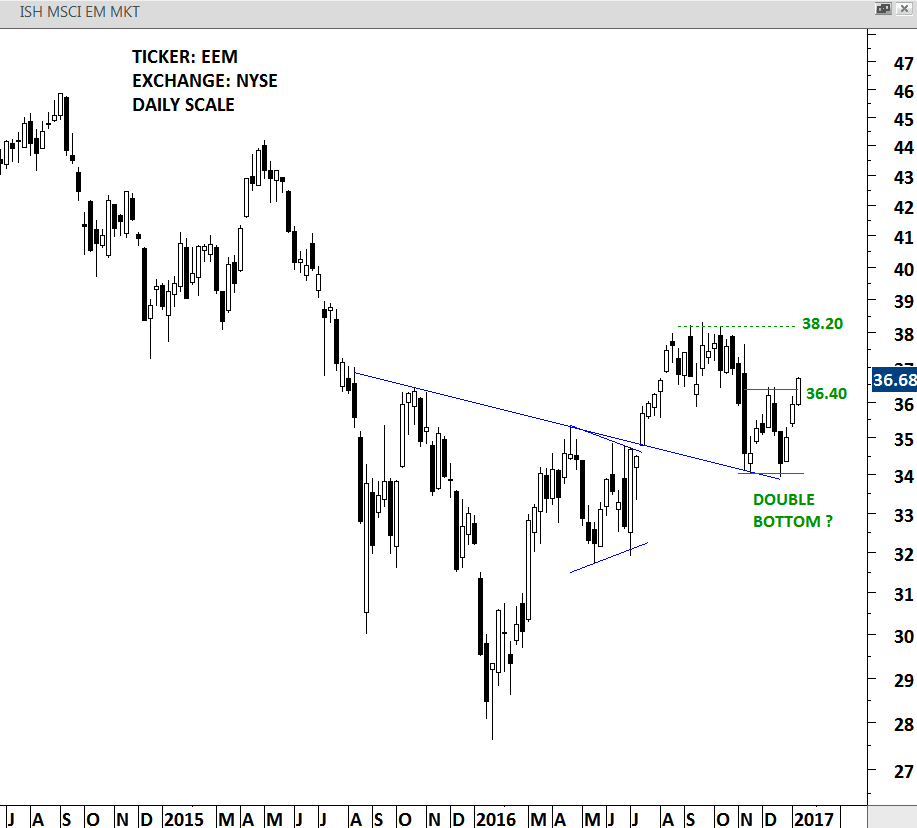
ISHARES EM ETF – WEEKLY SCALE
DJIA & RUSSELL 2000 INDEX (.DJI & .RUT)
Almost everyone who follows the financial news network must have come across the 20,000 level for the Dow Jones Industrial Average. Below chart shows the significance of the 20,000 level from a technical perspective. 20,000 has now become a short-term technical resistance other than a psychological one. Similar chart development can be seen on the Russell 2000 index. Both indices formed month-long flag consolidations. For Russell 2000, the short-term resistance stands at 1,390 levels. Flags are bullish continuation chart patterns.
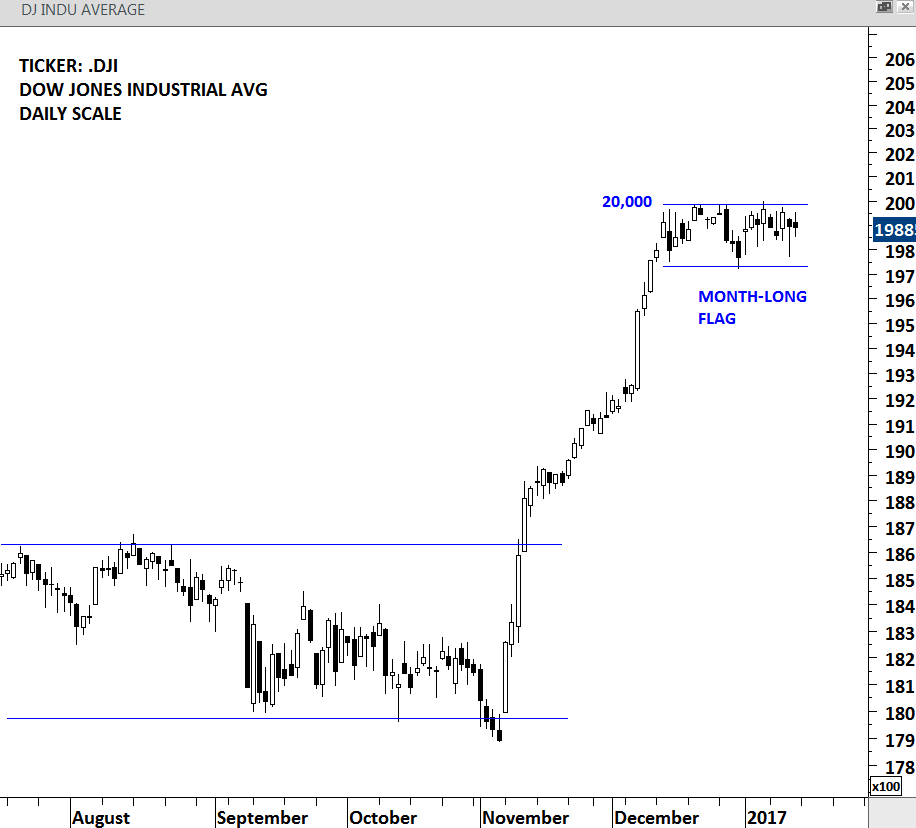
DJIA – DAILY SCALE
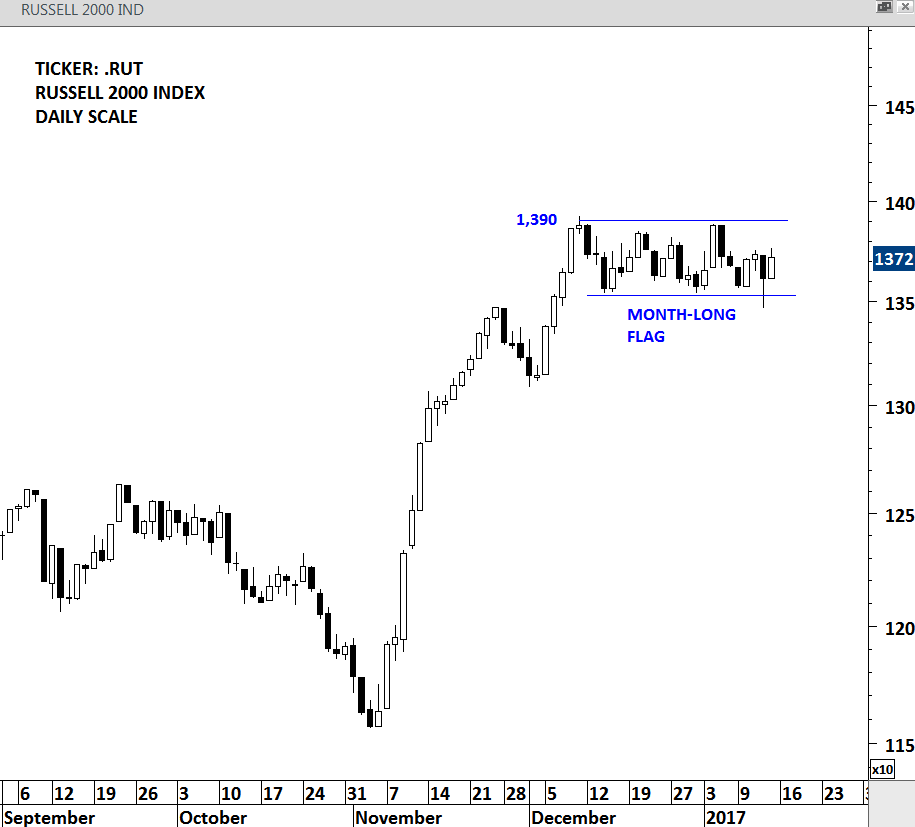
RUSSELL 2000 INDEX – DAILY SCALE
Below are the charts that generated chart pattern breakout signals during this week.
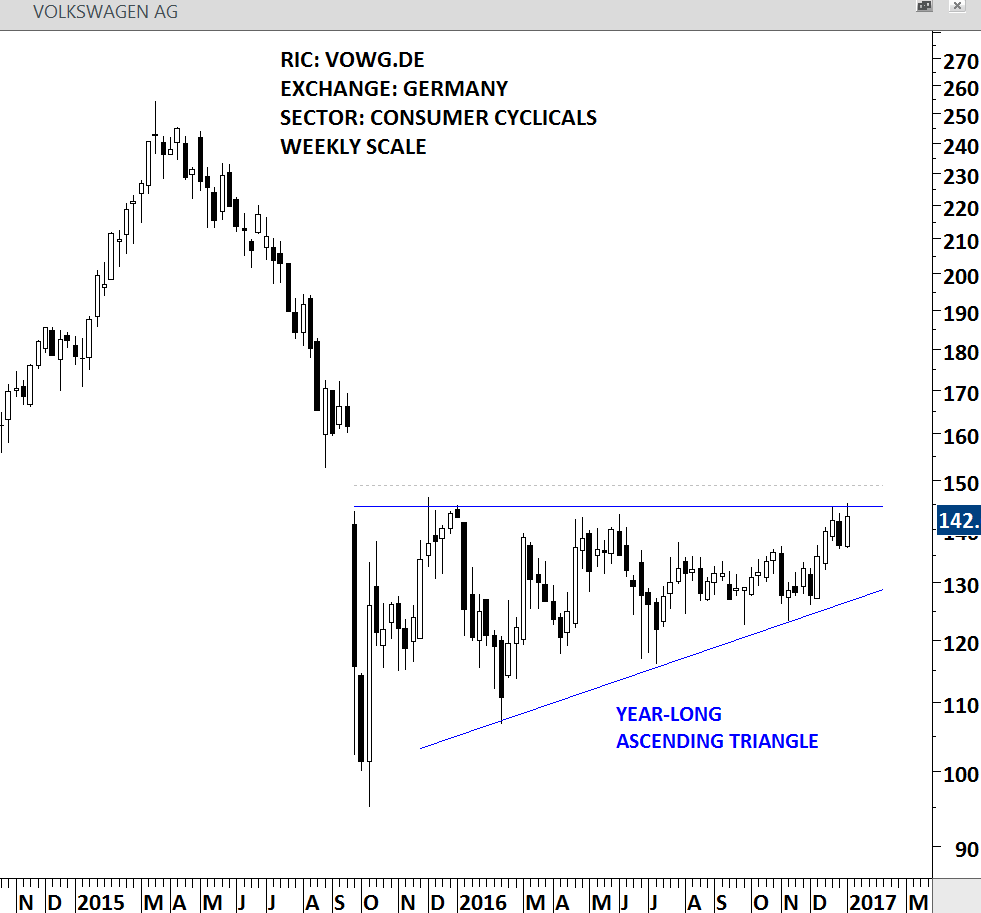
VOLKSWAGEN AG (VOWG.DE)
VOLKSWAGEN had a strong weekly close and the stock cleared the year-long horizontal resistance at 144.50 levels. Breakout above the horizontal resistance possibly completed a year-long ascending triangle that can act as a bottom reversal. Price target for the bullish chart pattern stands at 178 levels. 144.50 should act as support.
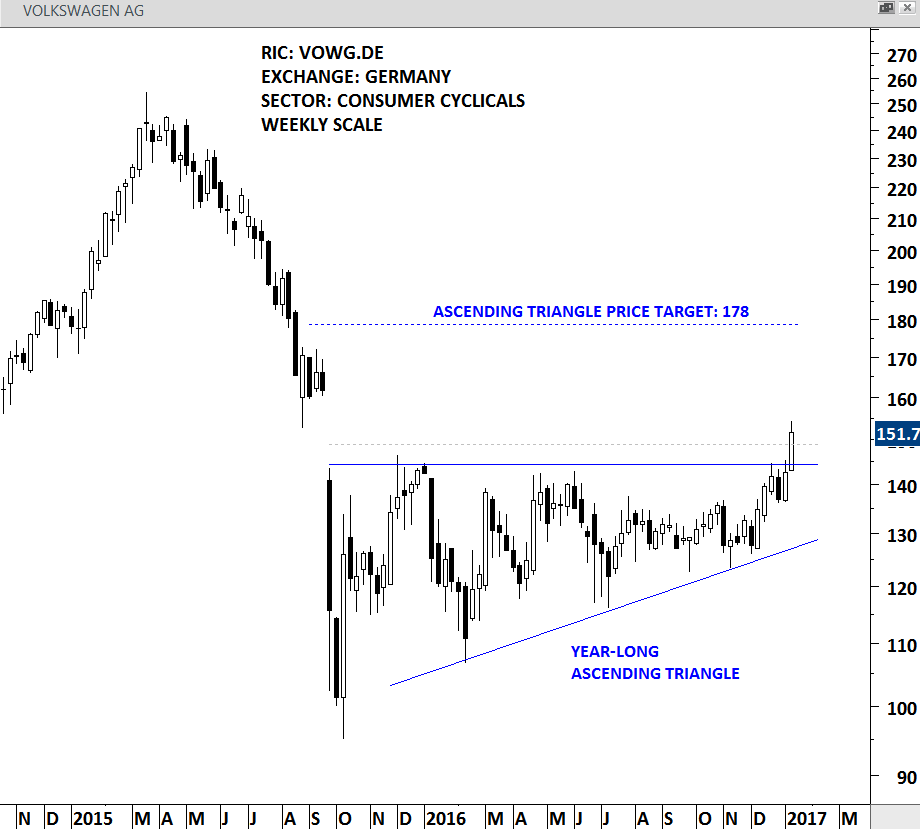
VOLKSWAGEN – WEEKLY
SANCHEZ ENERGY CORP. (SN)
SANCHEZ ENERGY completed an 8 month-long rectangle continuation chart pattern with the strong weekly breakout. Rectangle price target stands at 13.60 levels. 9.55 should act as support.
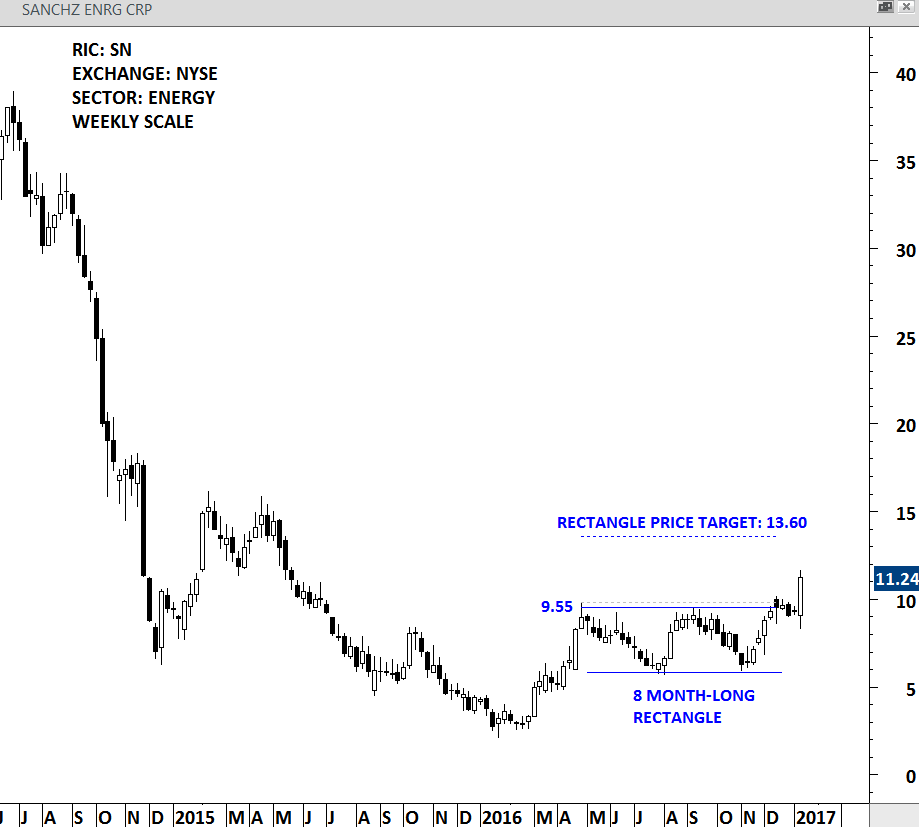
SANCHEZ ENERGY – WEEKLY SCALE
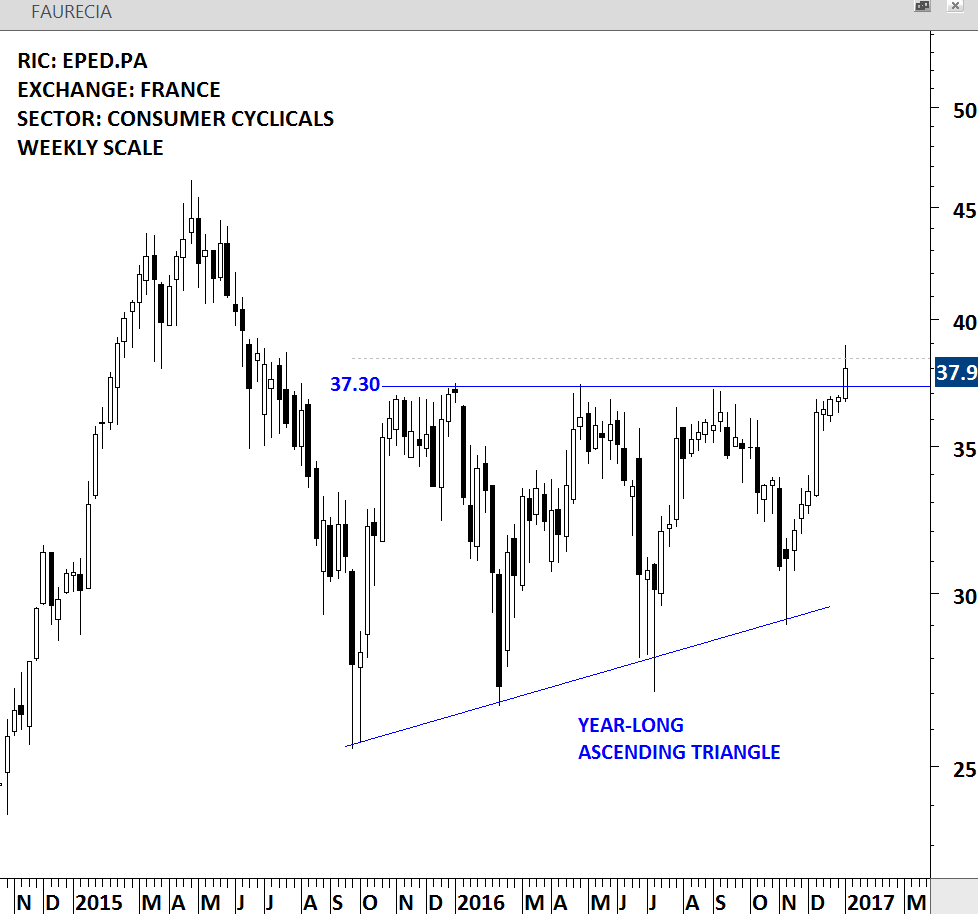
FAURECIA after its 4th test, cleared a year-long horizontal resistance and completed an ascending triangle that can act as a bottom reversal. Ascending triangle price target stands at 47 levels. 37.30 levels should act as support.
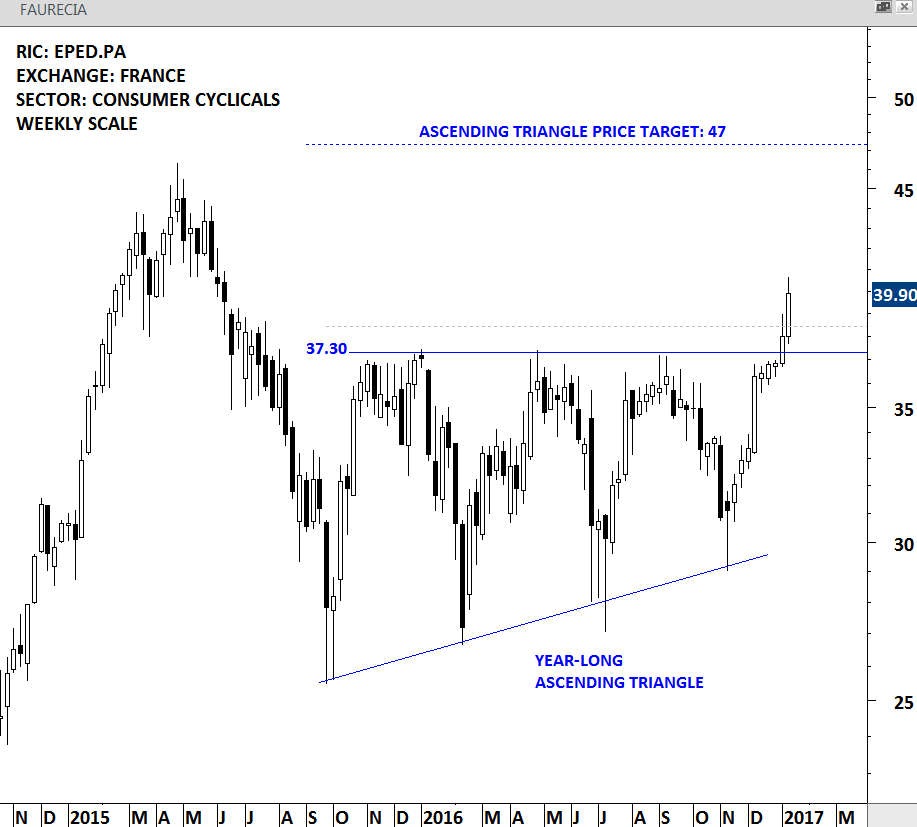
FAURECIA – WEEKLY SCALE
DUBAI FINANCIAL MARKET GENERAL INDEX (.DFMGI)
UAE’S DUBAI FINANCIAL MARKET GENERAL INDEX completed a 9 month-long rectangle chart pattern with the strong weekly close above 3,620 levels. Strong horizontal resistance was tested for 4 times over the past 9 months. Rectangle chart pattern price target stands at 4,040 levels. 3,620 levels should act as support.
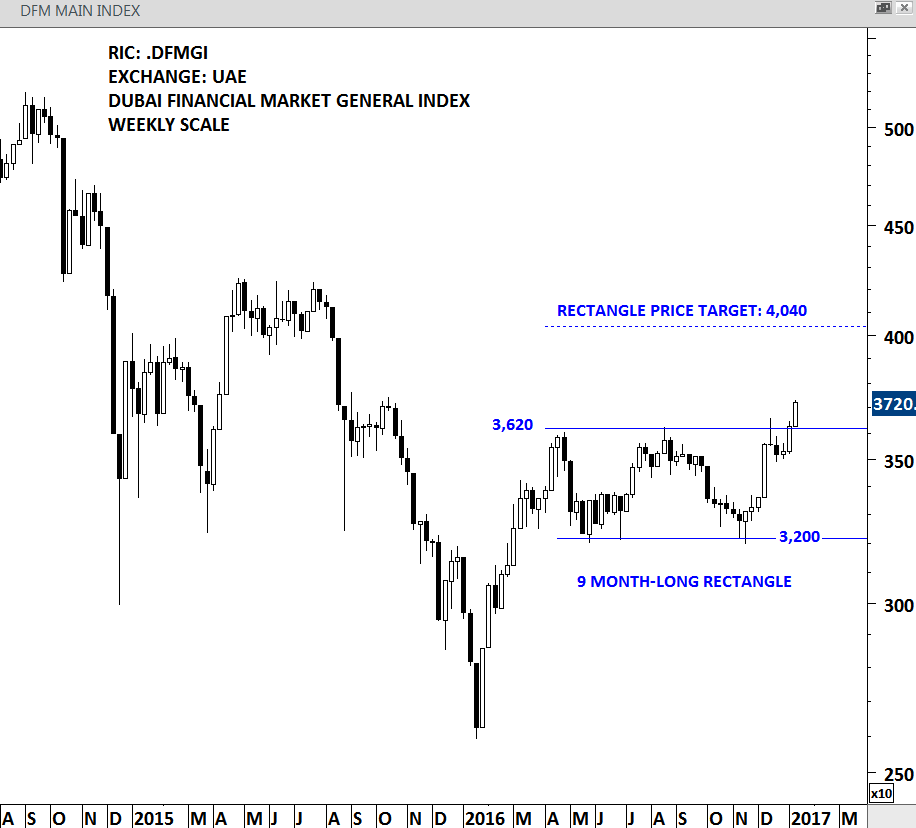
DFMGI – WEEKLY SCALE
Below are the charts that are added to the TECH CHARTS WATCHLIST.
888 HOLDINGS (888.L)
888 HOLDINGS is a provider of online gaming entertainment and solutions. The stock is listed in the UK. Price chart of the 888 HOLDINGS formed a year-long rectangle with the strong resistance standing at 233.5 levels. Stock had a strong breakout in the first quarter of 2016 and since then the price has been in a sideways consolidation. According to Edwards and Magee 3% breakout guideline, for confirmation of the breakout price should close above 240.65 levels.
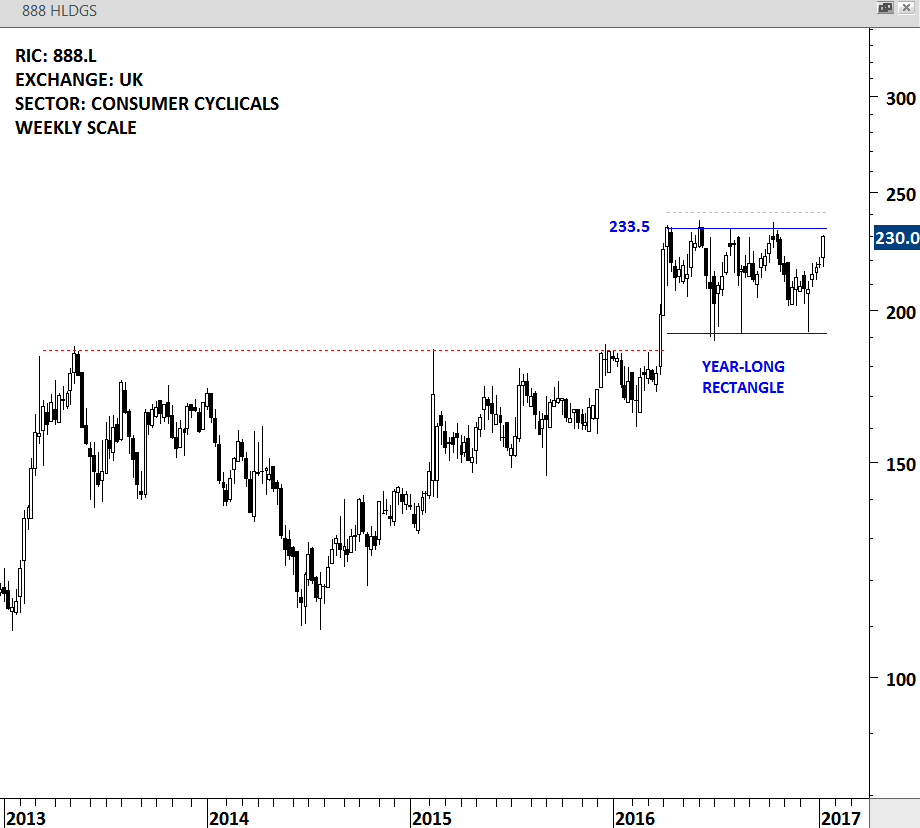
888 HOLDINGS – WEEKLY SCALE
BOOKER GROUP (BOK.L)
BOOKER GROUP is a consumer non-cyclical company listed in the UK. The company offers a range of grocery, tobacco, alcoholic products and other products. Price chart of BOOKER GROUP formed a year-long ascending triangle. Strong horizontal resistance stands at 187.5 levels. The horizontal boundary was tested for 4 times over the past year. Breakout above 187.5 can push the stock to all-time high levels. A daily close above 194 levels is required for confirmation.
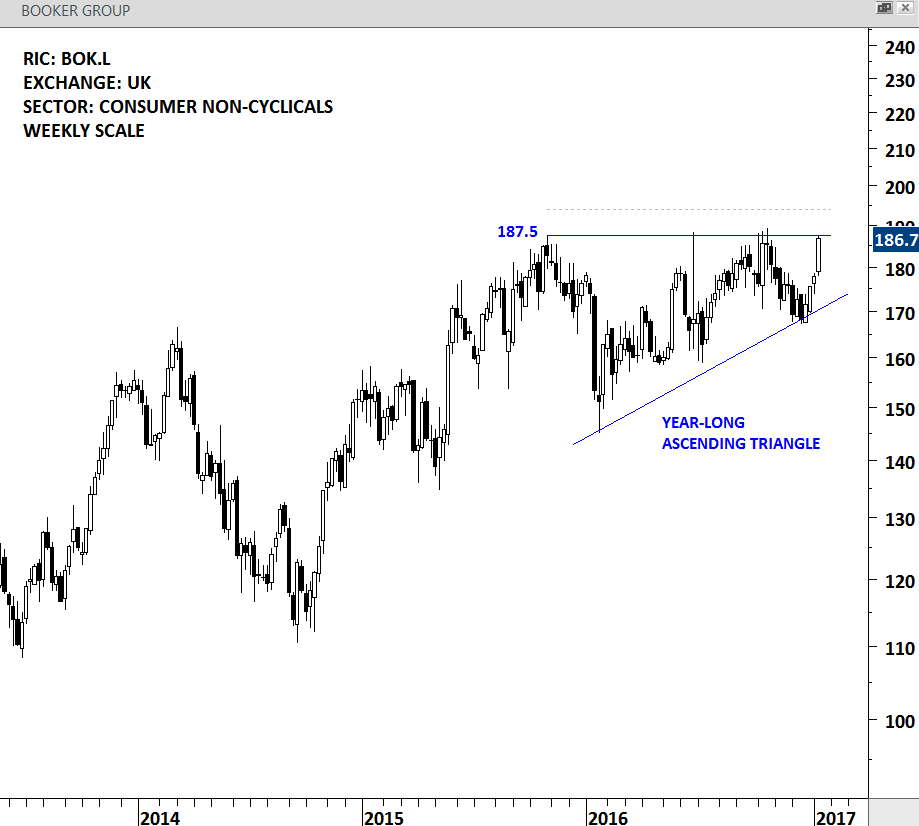
BOOKER GROUP – WEEKLY SCALE
CSPC PHARMACEUTICAL GROUP is a healthcare company listed in the Hong Kong Stock exchange. Stock price formed a 2 year-long rectangle with the strong horizontal resistance standing at 8.60 levels. Latest consolidation below the upper boundary of the rectangle can be a preparation for an upward breakout. A daily close above 8.85 levels will confirm the breakout from this massive sideways consolidation. It is important to note that the breakout will push the stock to all-time high levels.
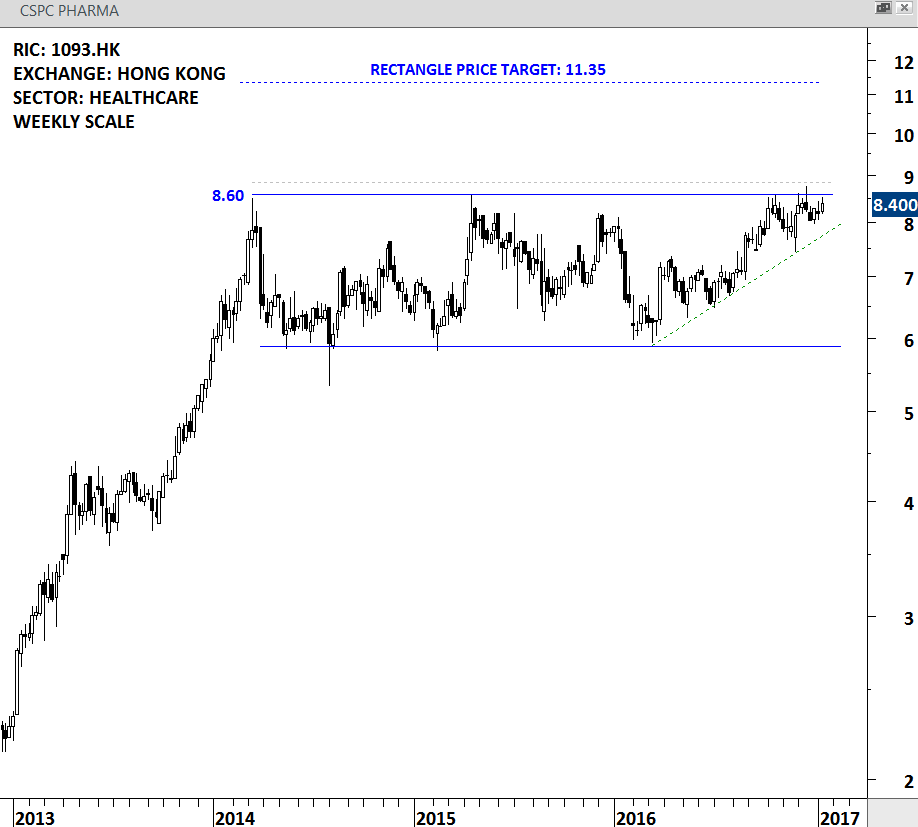
CSPC PHARMA – WEEKLY SCALE
CGI GROUP (GIB)
CGI GROUP is a technology company listed in the NYSE. Stock price formed an 8 month-long ascending triangle with the strong horizontal resistance standing at 50.20 levels. Over the past 8 months CGI GROUP tested 50-50.2 area for six times. Breakout above 50.20 levels will push the stock to all-time high levels. A daily close above 51.70 levels will confirm the breakout from the bullish continuation chart pattern.
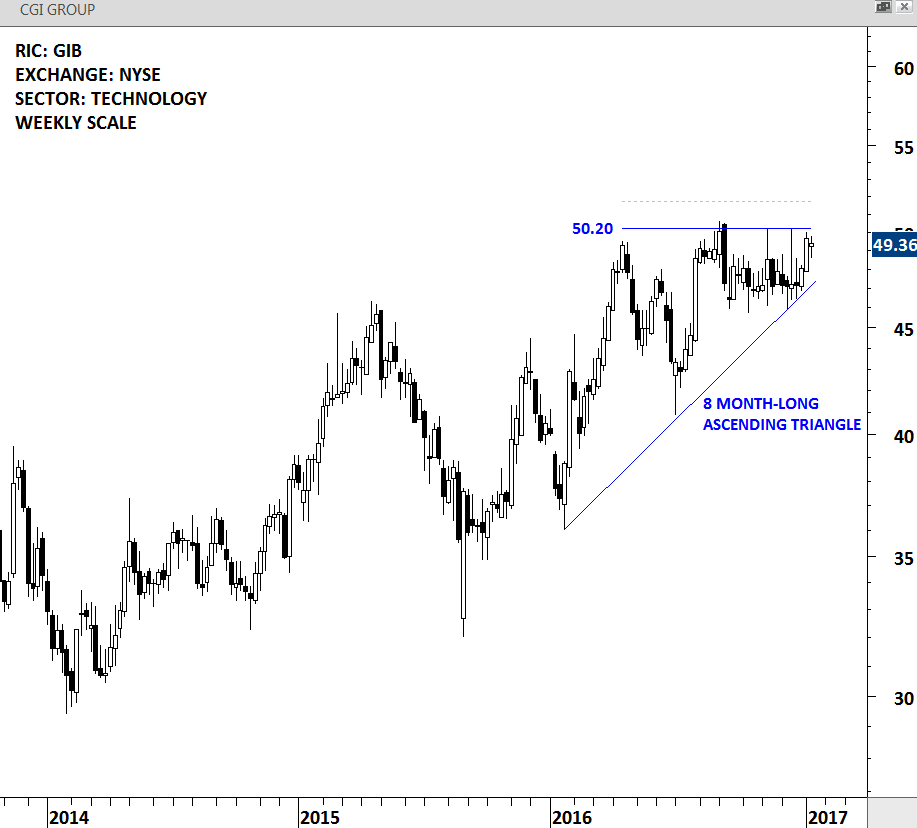
CGI GROUP – WEEKLY SCALE
OWENS-ILLINOIS INC (OI)
OWENS ILLINOIS INC is a basic materials company listed in the NYSE. The company is engaged in the manufacturing of glass containers. Stock price of OWENS ILLINOIS formed a 7 month-long symmetrical triangle with the upper boundary standing at 19.70 levels. Symmetrical triangles are usually considered continuation chart patterns. A daily close above 20.10 levels will confirm the breakout from the symmetrical triangle.
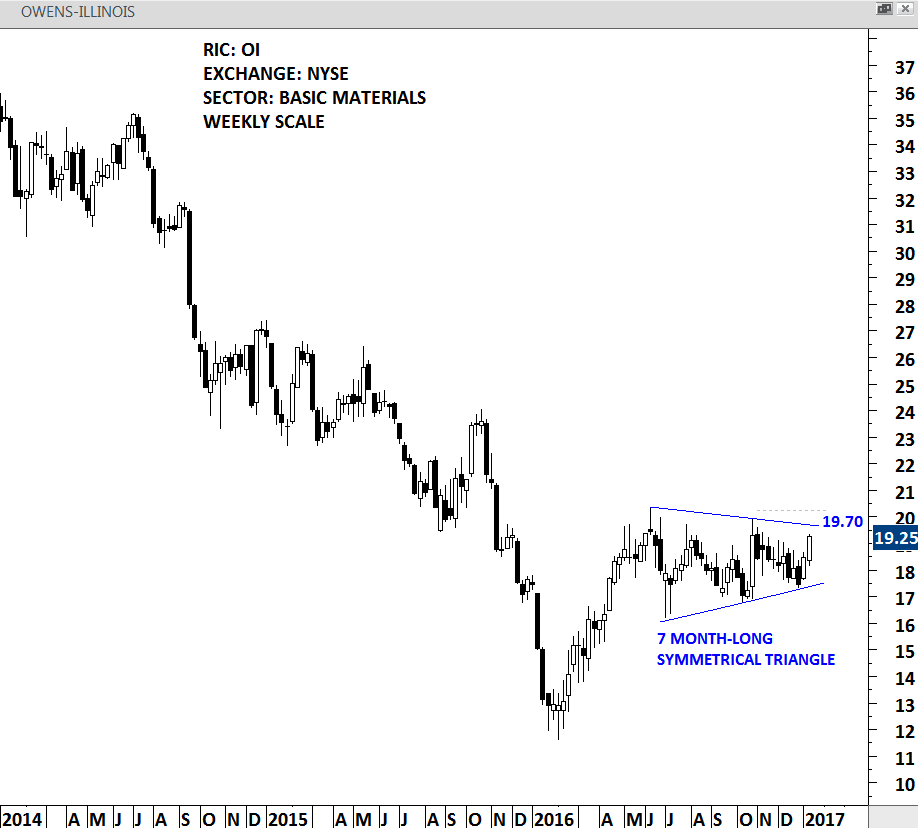
OWENS ILLINOIS – WEEKLY SCALE
NH INVESTMENT & SECURITIES CO (005940.KS)
NH INVESTMENT & SECURITIES CO, formerly WOORI INVESTMENT & SECURITIES CO, is a Korea-based financial service provider specialized in the investment banking and securities markets. The stock price of the company formed a massive year-long complex head and shoulder bottom with the neckline standing at 10,860 levels. Strong horizontal resistance was tested for 4 times over the past year. Breakout above 10,860 can complete the long-term bottom and suggest higher prices in 2017. A daily close above 11,185 levels will confirm the breakout.
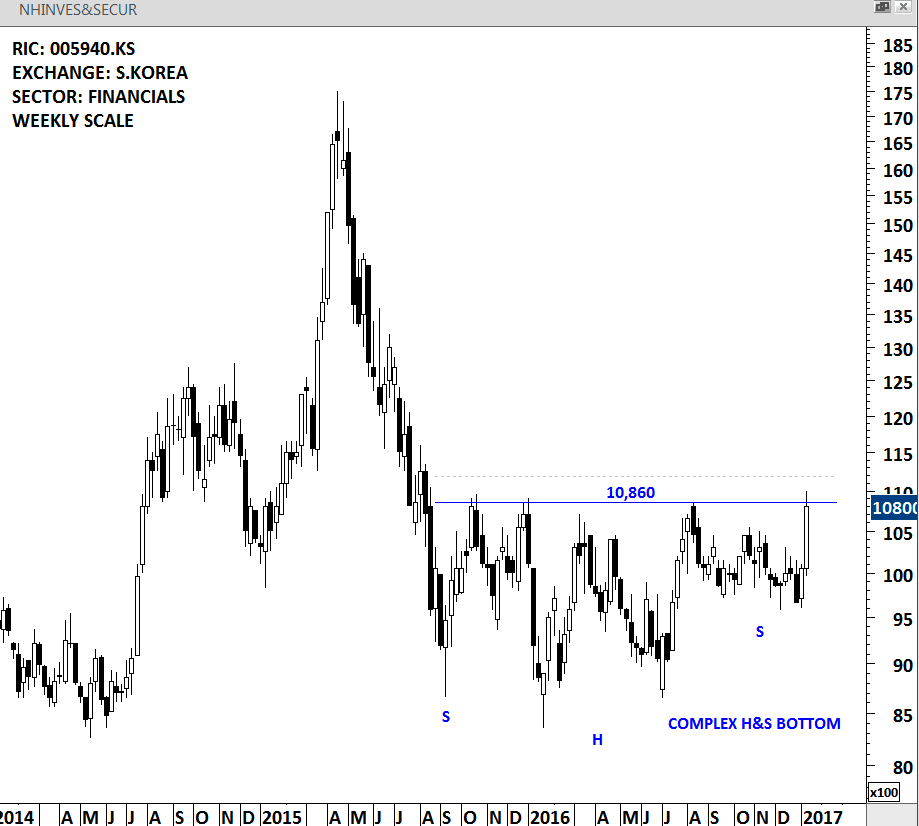
NH INVEST & SEC – WEEKLY SCALE