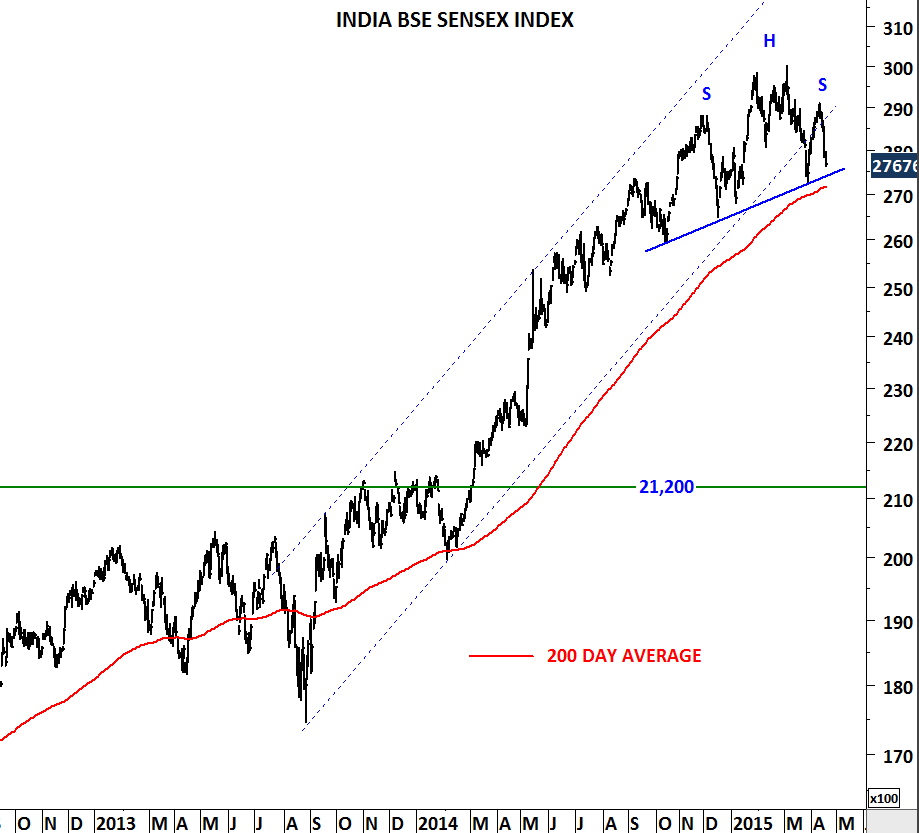
INDIA BSE SENSEX INDEX
Uptrend in INDIA equities is running out of steam. Chart pattern suggests correction in the coming months if the index breaks down the 200-day exponential moving average at 27,300 levels. India BSE SENSEX index might be forming a head and shoulder top chart pattern with the neckline overlapping with the long-term average. Breakdown below a strong technical level like this could be the first warning signal of a deeper correction.
Weekly price scale
Daily price scale
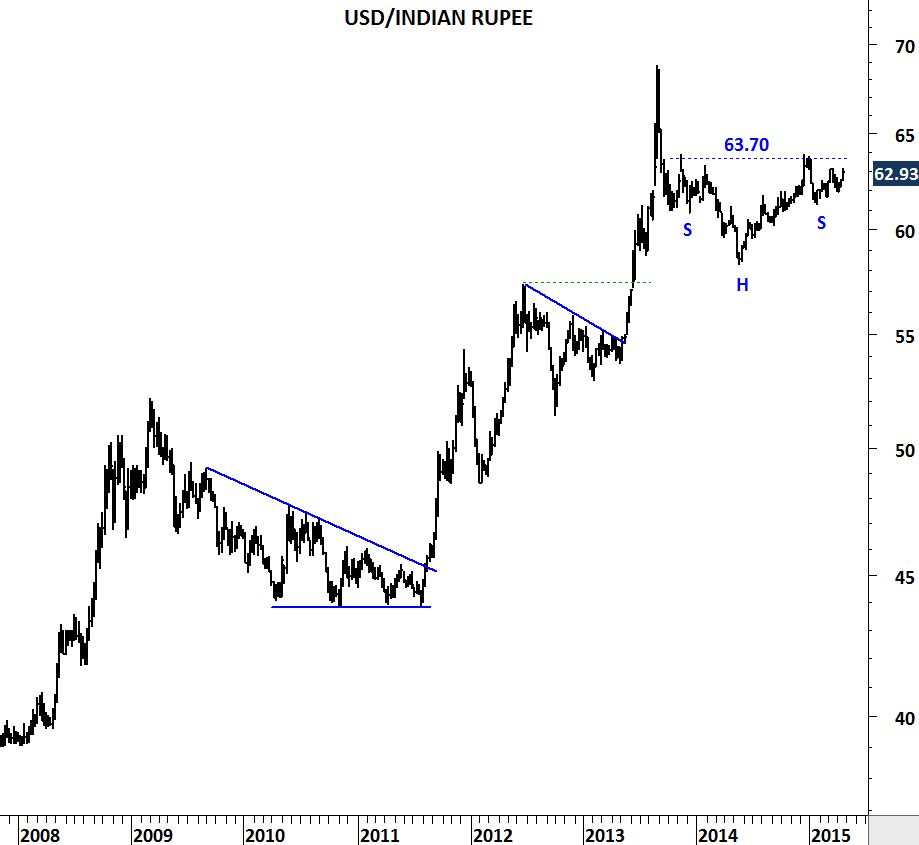
Similarly USD/INR formed an inverse head and shoulder chart pattern suggesting weak Rupee if the cross rate breaks above 63.70 levels. I’m still bullish on India in the long-term (you can find earlier analysis here at the time of long-term breakout). BSE SENSEX cleared long-term horizontal resistance at 21,200 levels in 2014. I’ll view the possible weakness as a pullback to the long-term support level.
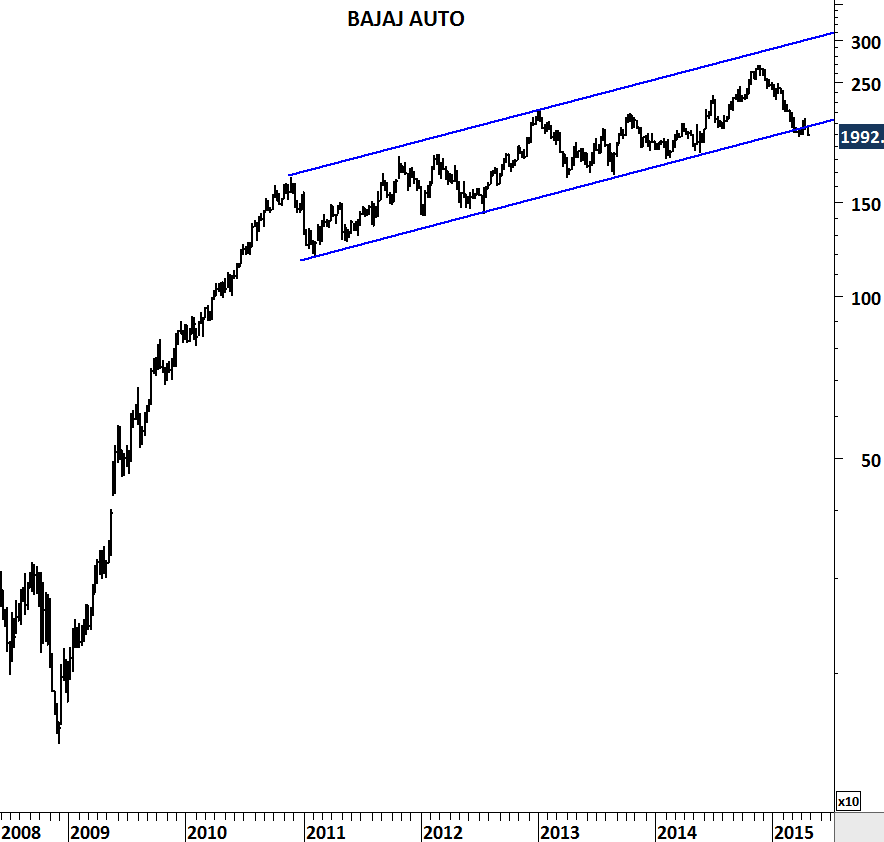
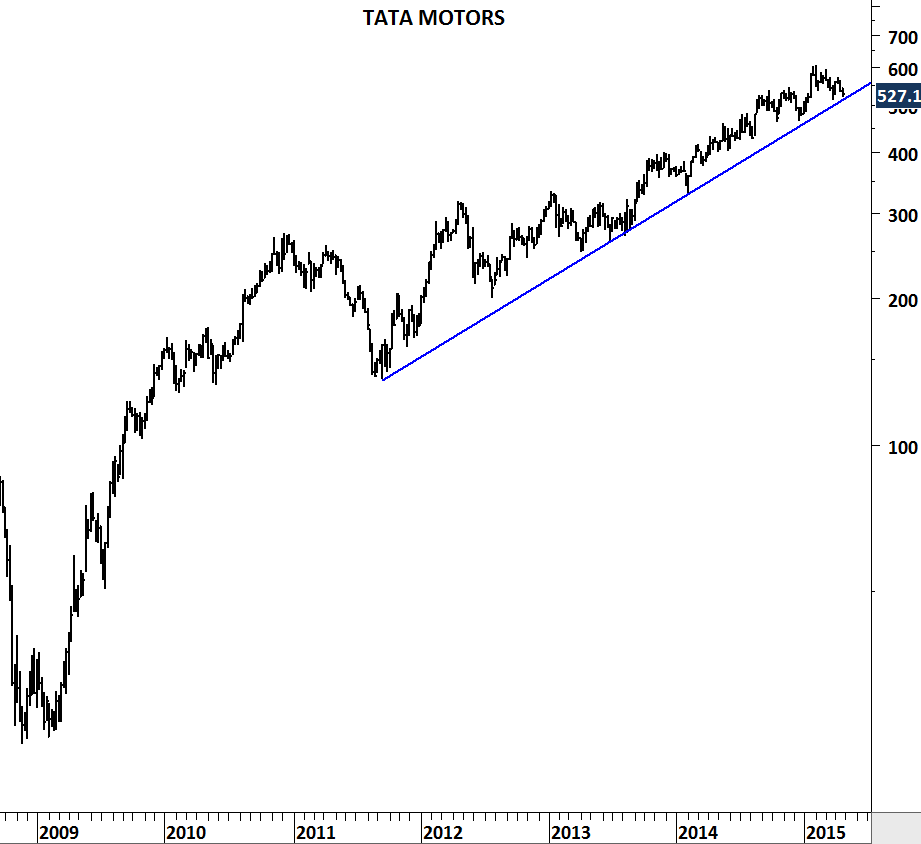
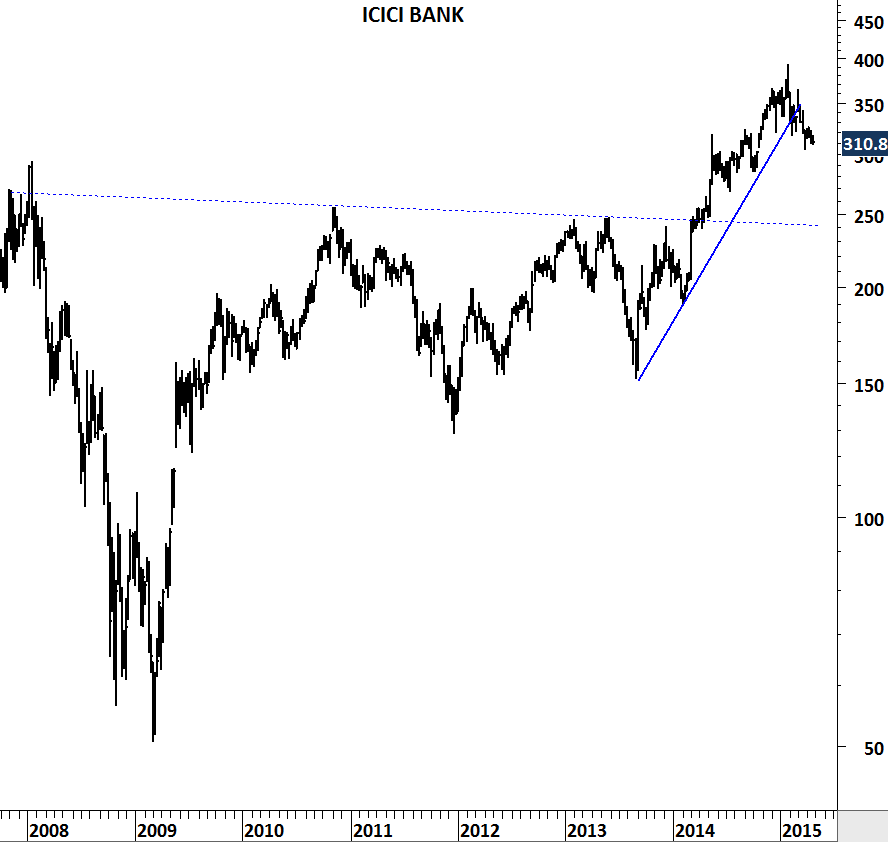
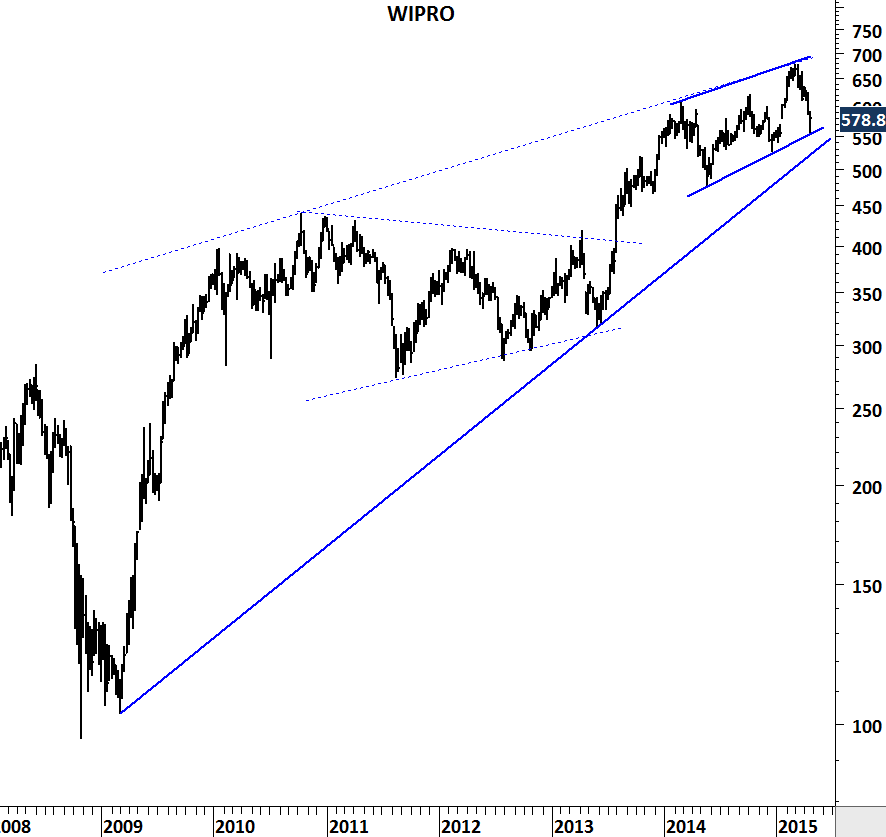
Some stocks that are showing weakness in the Index. Strong long-term trend lines are being challenged. Breakdown on these names can push the SENSEX lower.