USD/INR (U.S. DOLLAR/INDIAN RUPEE)
Thanks to the Central Banks and the decision to delay rate hikes by FED, both emerging market equities and currencies had a strong rally in March. Latest recovery in equities and currencies pulled several emerging market FX to strong support levels. Such that, these are critical inflection points worth mentioning.
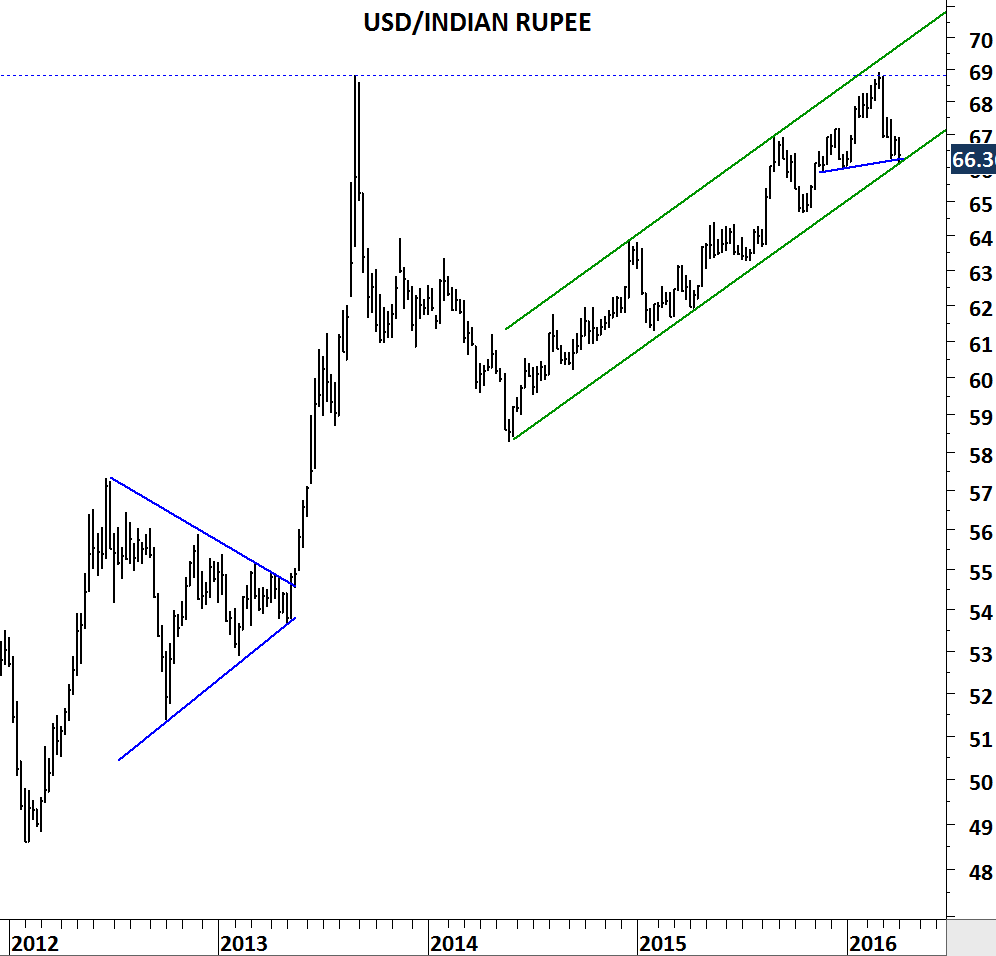
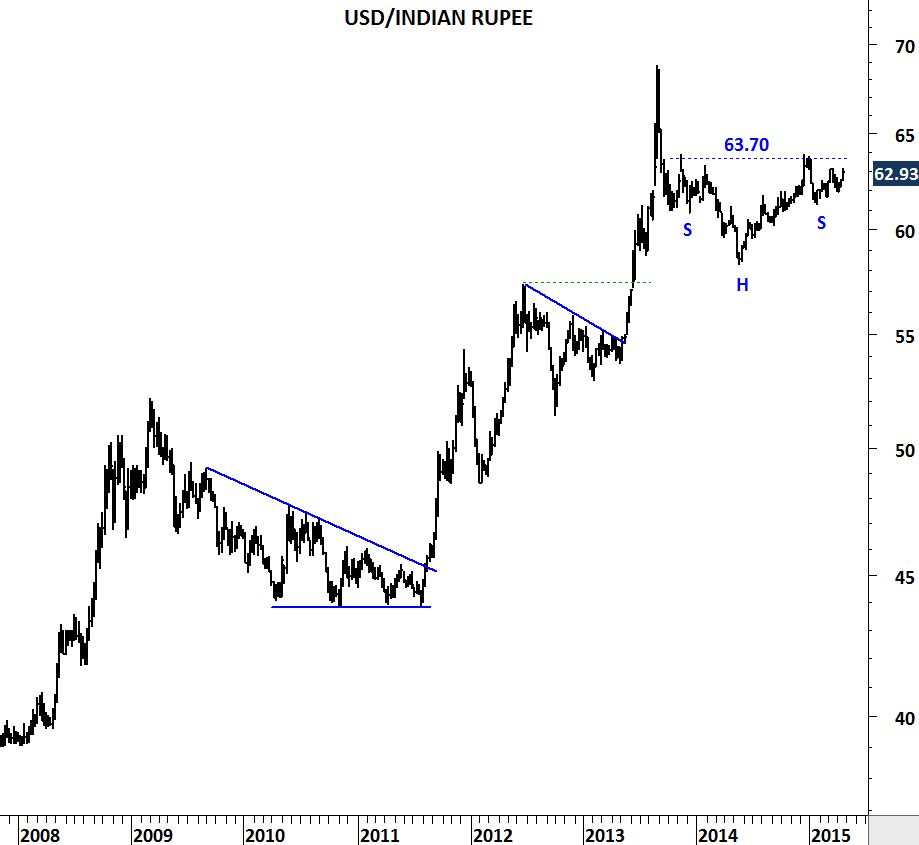
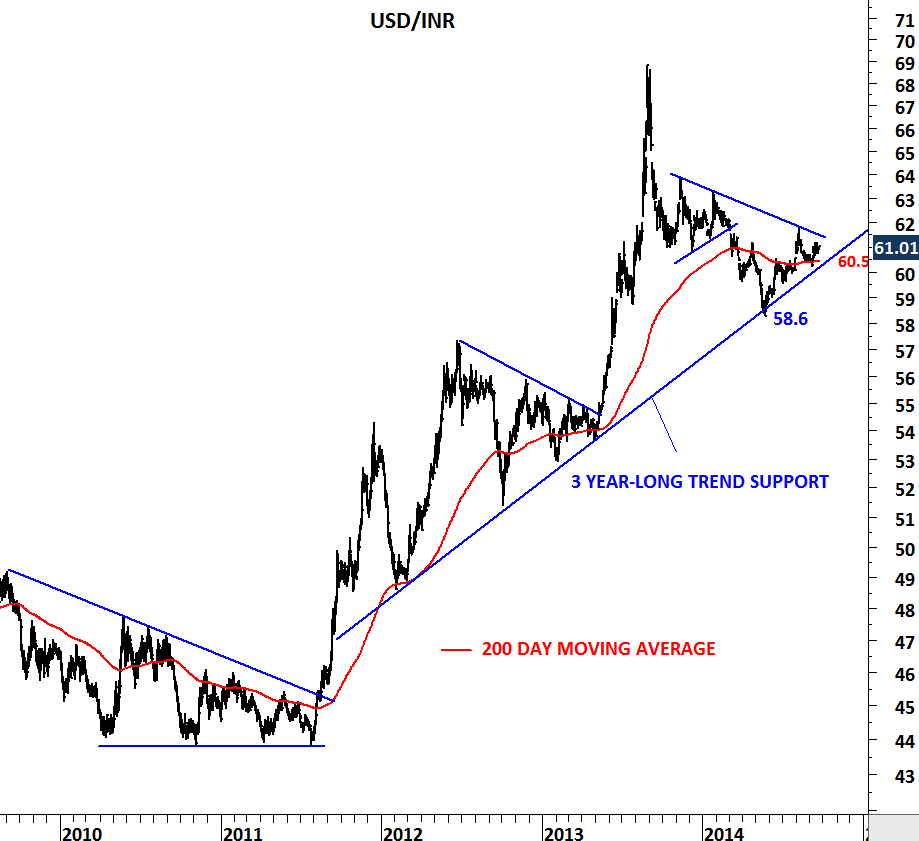
US Dollar / Indian Rupee weekly price chart
USD/INR (U.S. Dollar/Indian Rupee), pulled back from its historical high level at 68.80 to the lower boundary of its 2 year-long trend channel at 66 levels. Lower boundary of the 2 year-long trend channel is also the 200-day exponential moving average, in other words a strong support.
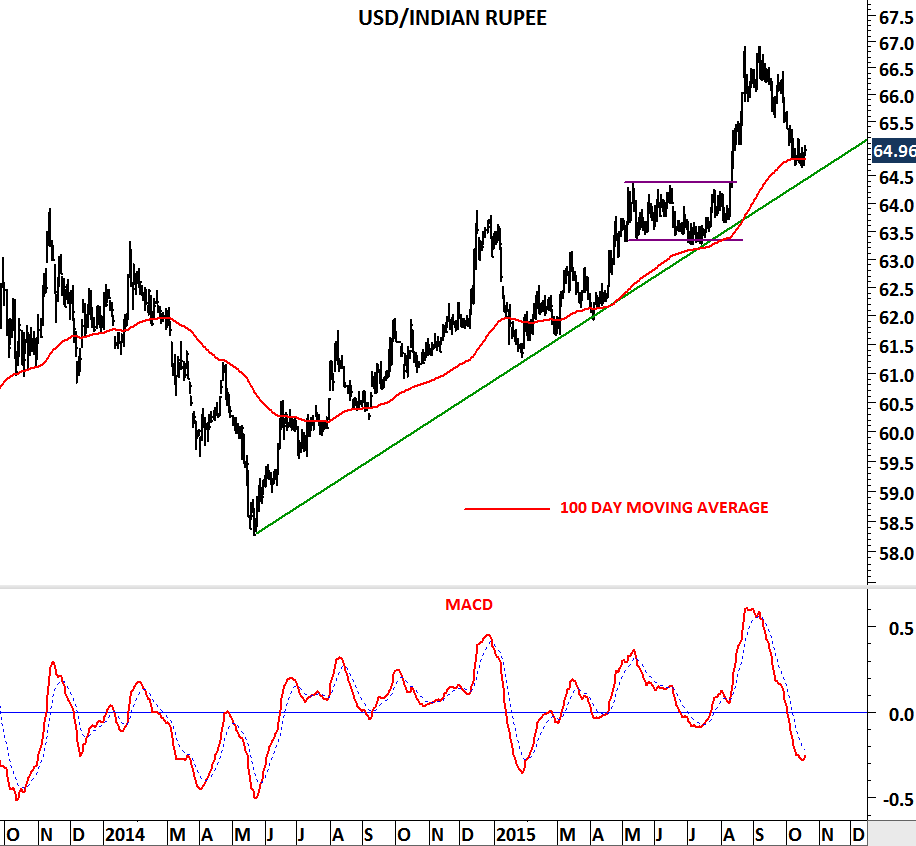
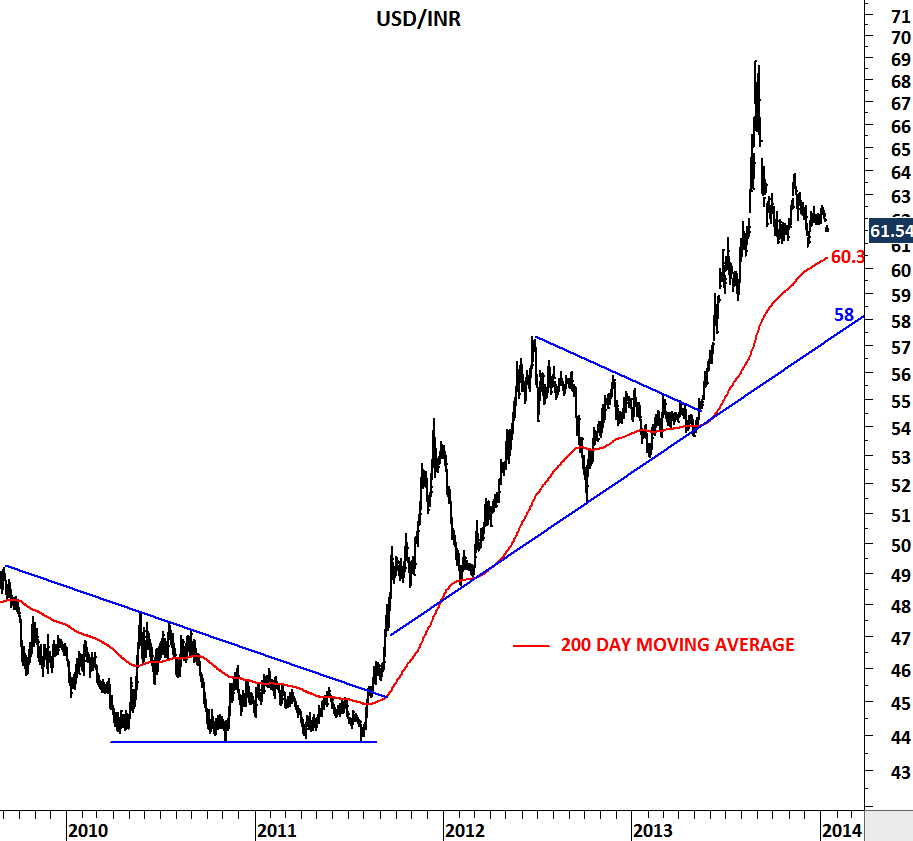
On the daily chart we can also see that MACD, a momentum indicator, reached oversold levels, though not on a buy signal yet. All these technical information suggest that unless there is a decisive breakdown below 66 levels, Indian Rupee is likely to weaken in the following weeks. In case of a rebound from the 200 day average and the lower boundary of the 2 year-long trend channel, the new trading range will be 66 and 69.
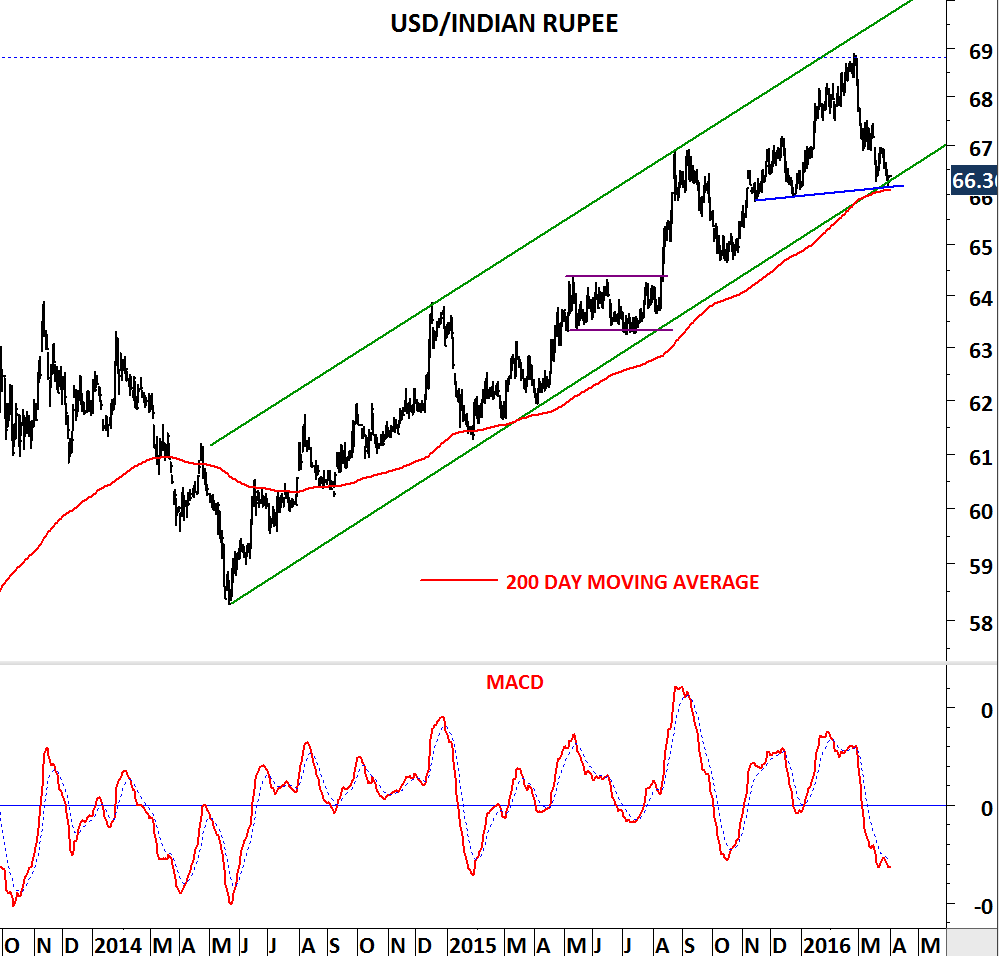
U.S. Dollar / Indian Rupee daily price chart