
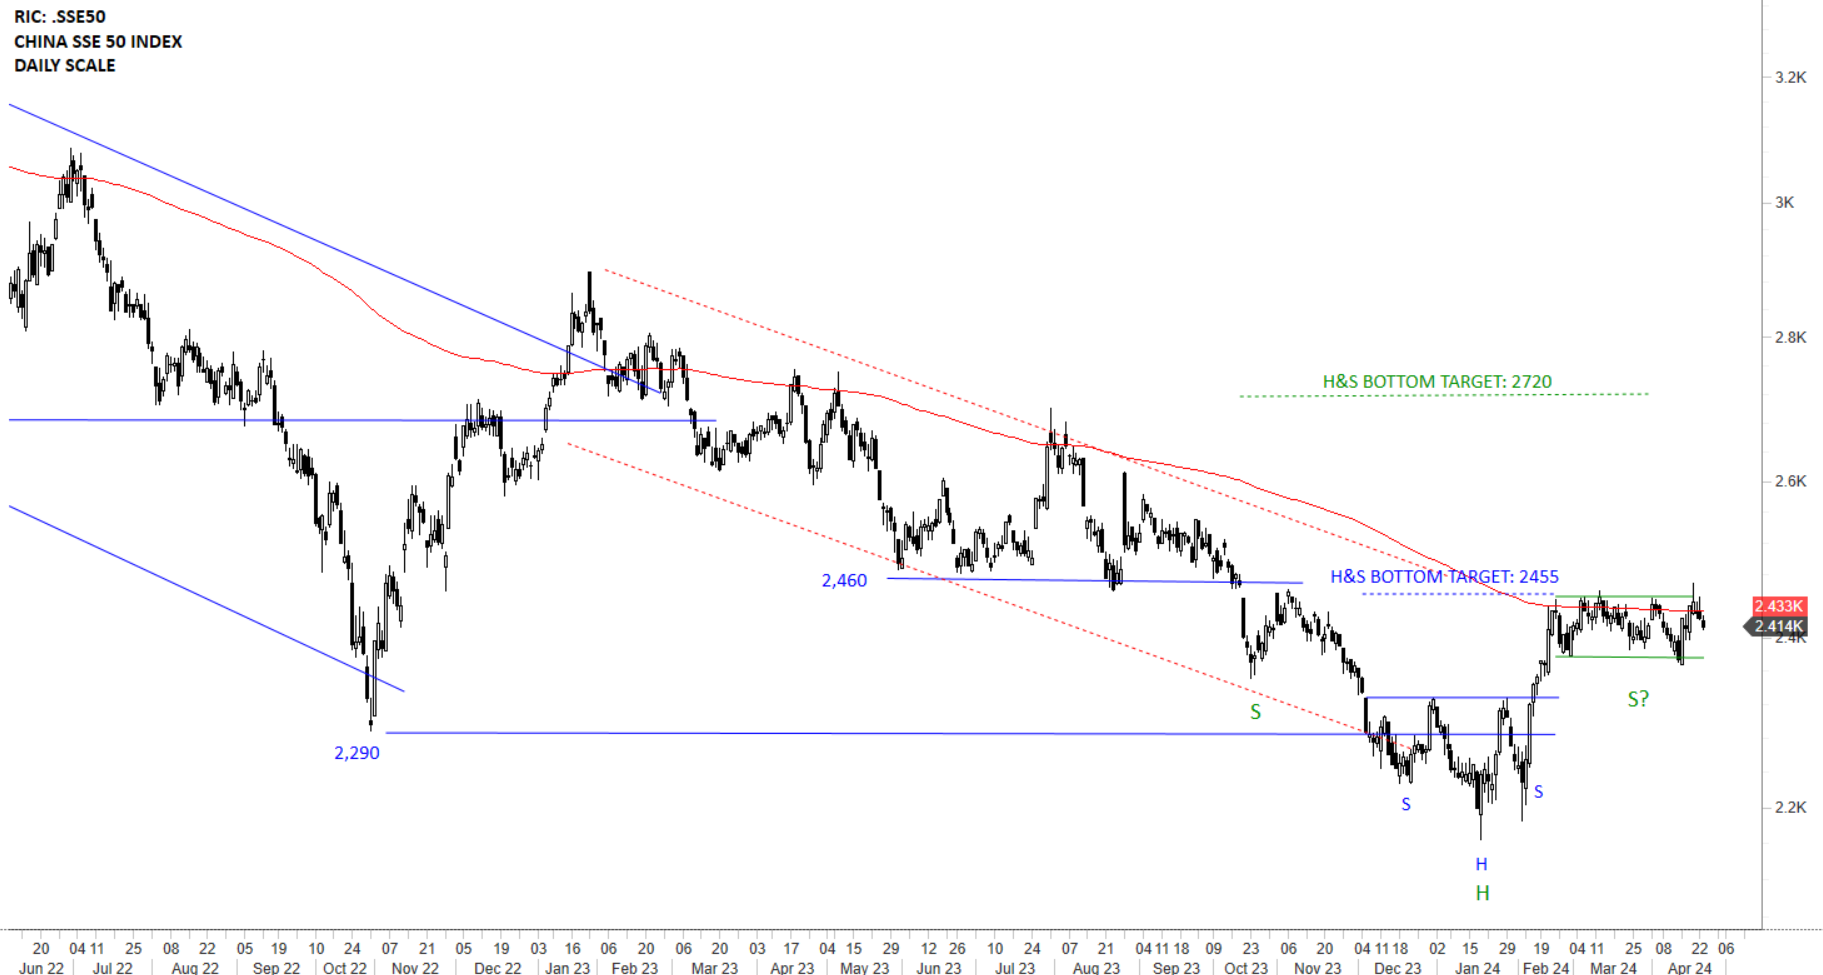
CHINA SSE 50 INDEX
Every week Tech Charts Global Equity Markets report features some of the well-defined, mature classical chart patterns under a lengthy watchlist and the chart pattern breakout signals that took place during that week. Global Equity Markets report covers single stocks from developed, emerging and frontier markets, ETF’s, select commodities, cryptocurrencies and global equity indices. Below charts, China SSE 50 Index and the CSOP China A 50 ETF are from the review and watchlist sections of the weekly report. They are featuring a possible long-term bottom reversal that might be taking place in Chinese equities.
The daily scale price chart for China SSE 50 Index shows the completed H&S bottom reversal with the price clearing the neckline at 2,330 levels. H&S bottom price target was met at 2,455 levels. The larger scale H&S bottom reversal neckline and the 200-day average are around the same levels. The index might be forming the right shoulder in preparation for a breakout above the long-term average. Short-term support area is between 2,290-2,330. The right shoulder might be forming a month-long rectangle. Breakout above 2,455 levels can push the index towards the H&S bottom price target at 2,720 levels.
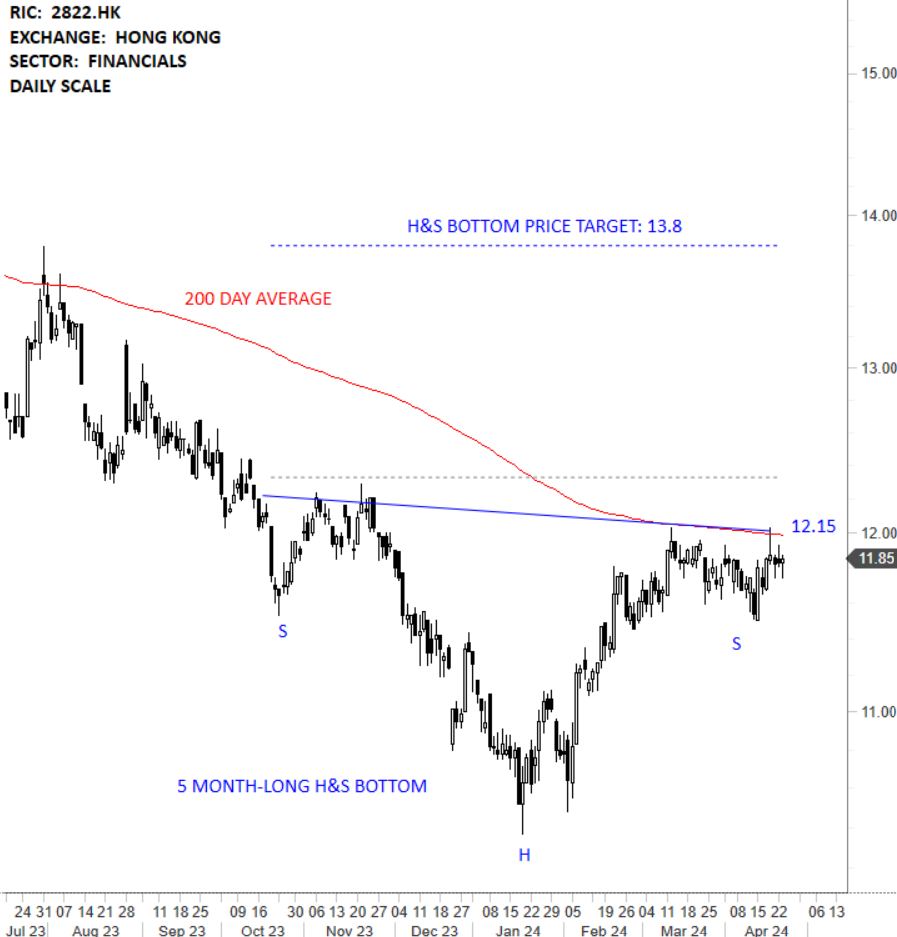
CSOP FTSE CHINA A50 ETF RMB (2822.HK)
The CSOP FTSE CHINA A50 ETF is listed on the Hong Kong Stock Exchange. Probably one of the liquid ETFs out there that you can take advantage of the possible breakout on SSE50 Index. Price chart formed a 5 month-long head and shoulder bottom with the neckline acting as strong resistance at 12.15 levels. The neckline was tested several times over the course of the chart pattern. A daily close above 12.33 levels will confirm the breakout from the 5 month-long head and shoulder bottom with the possible chart pattern price target of 13.80 levels.

Tech Charts Membership

By becoming a Premium Member, you’ll be able to improve your knowledge of the principles of classical charting.
With this knowledge, you can merge them with your investing system. In fact, some investors use my analyses to modify their existing style to invest more efficiently and successfully.

As a Premium Member of Aksel Kibar’s Tech Charts,
You will receive:
-
Global Equities Report. Delivered weekly.
-
Classical charting principles. Learn patterns and setups.
-
Actionable information. Worldwide indices and stocks of interest.
-
Risk management advice. The important trading points of each chart.
-
Information on breakout opportunities. Identify the ones you want to take action on.
-
Video tutorials. How patterns form and why they succeed or fail.
-
Watch list alerts. As they become available so you can act quickly.
-
Breakout alerts. Usually once a week.
-
Access to everything (now and as it becomes available)o Reports
o Videos and video series -
Multi-part webinar course. You learn the 8 most common charting principles.
-
Webinars. Actionable and timely advice on breaking out chart patterns.
For your convenience your membership auto renews each year.


