This week’s major financial event was the Dow Jones Industrial Average breaking the technical and psychological level at 20,000. Following the strong rally in November-December 2016, the index completed a month-long bullish flag with a gap opening. These are all positive technical developments for the equity markets. While the DJIA cleared its month-long resistance, RUSSELL 2000, a small-cap market index is still below the technical resistance at 1,385 levels. A possible breakout on the RUSSELL 2000 index in the following days/week should add momentum to the equity markets. Meanwhile the DJIA should hold above 19,920-20,000 range if we were to expect continued strength.
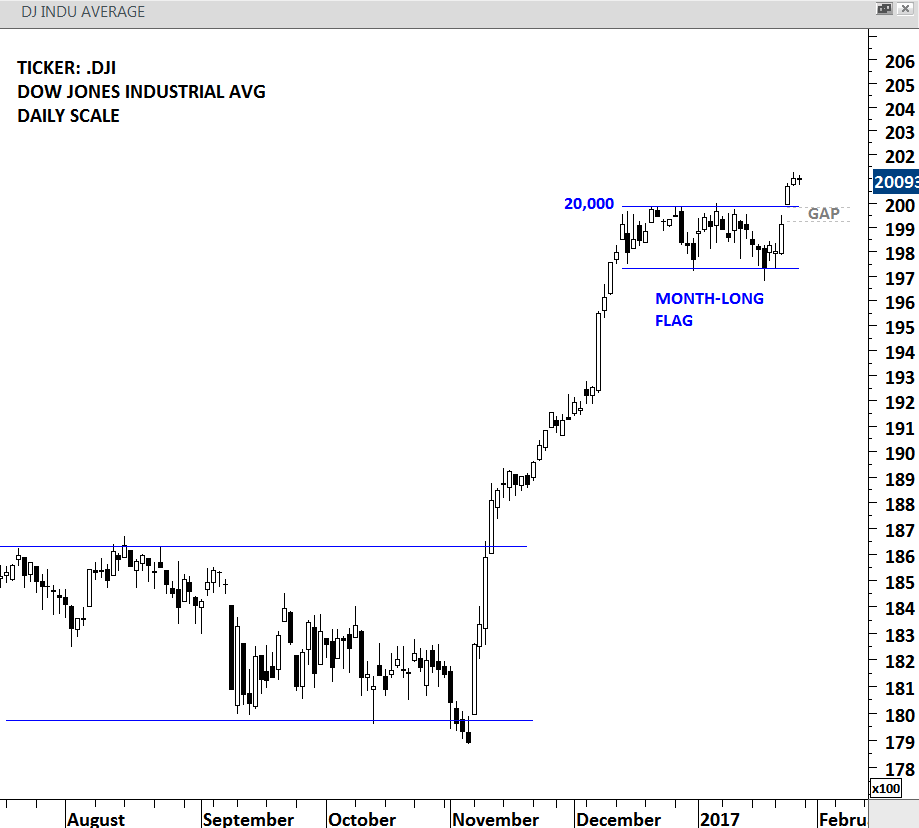
DJIA – WEEKLY SCALE
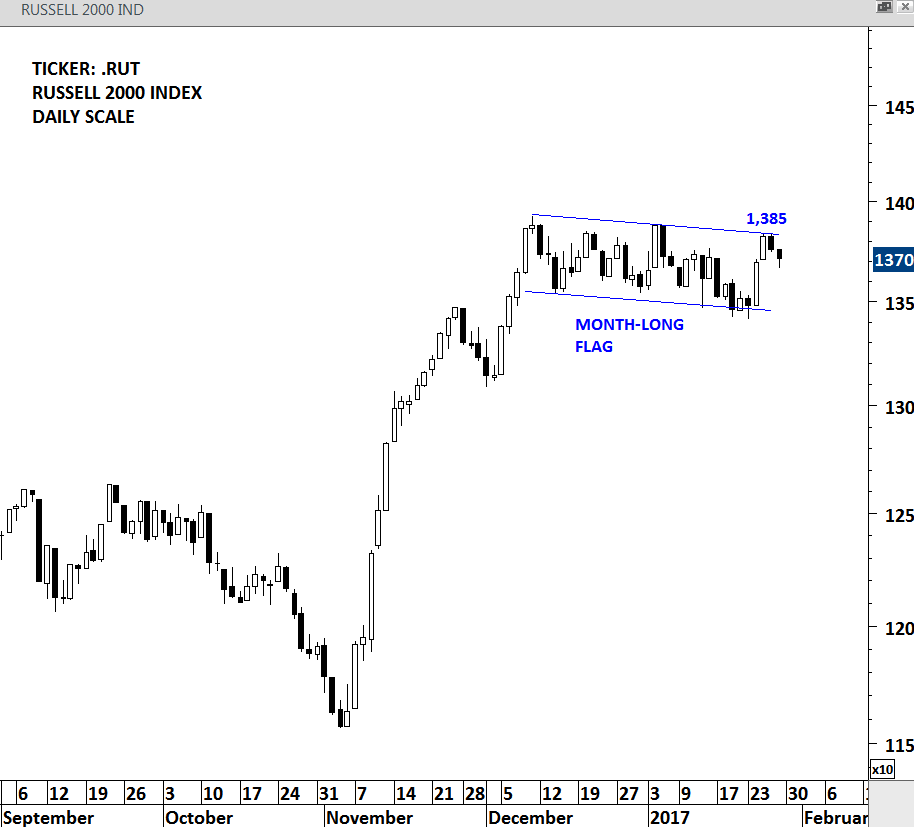
RUSSELL 2000 IND – WEEKLY SCALE
There has been several chart pattern breakout signals this week as well as new additions to the TECHCHARTSWATCHLIST. As I go through thousands of charts every week, I look for chart patterns that have well-defined horizontal boundaries. Most of the chart patterns range from minimum 4 months to maximum 2 years. Below are the new additions to the TECHCHARTSWATCHLIST.
SJR IN SCANDINAVIA AB (SJRb.ST)
SJR is a small-cap Sweden-based staff recruitment company primarily focusing on the economic, banking and financial sectors. Price chart of SJR formed a 2 year-long rectangle chart pattern with the strong horizontal boundary standing at 39.25 levels. Over the past 4 months, the stock formed another short-term consolidation and with this week’s price action it cleared both resistances. Edwards and Magee in their book Technical Analysis of Stock Trends suggest that a stock should breakout by a min 3% margin above the resistance for a clear chart pattern breakout signal. According to this guideline, a daily close above 40.45 will confirm the breakout from the 2 year-long rectangle.
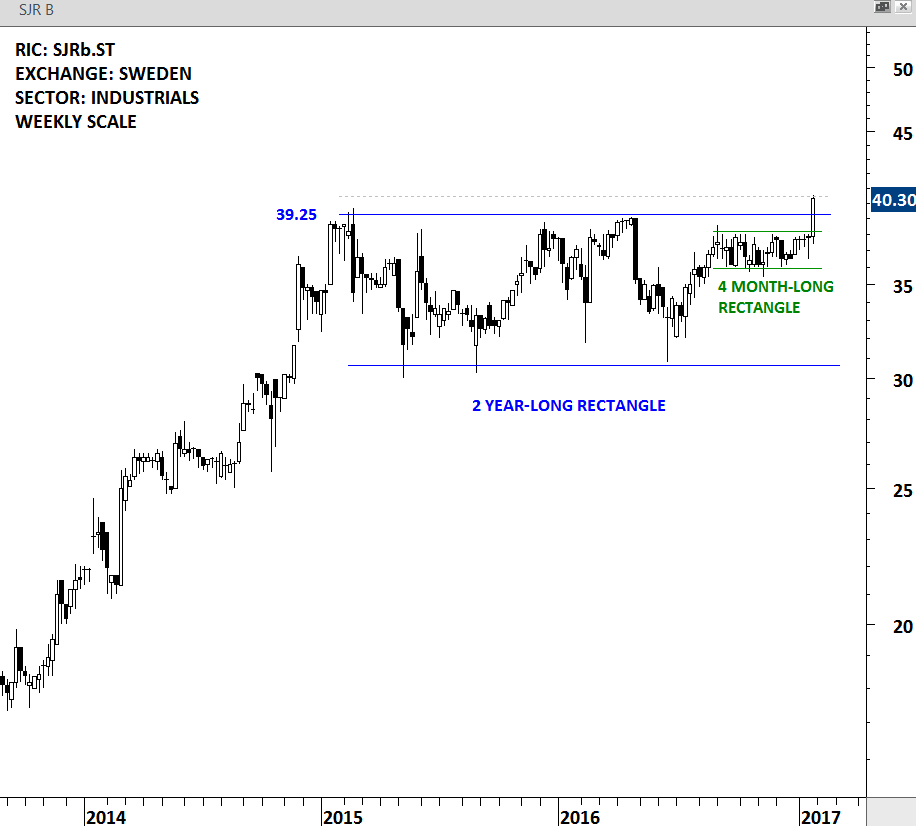
SJR – WEEKLY SCALE
A common chart pattern that is clearly visible on the Hong Kong/China banking & financial stocks is a multi-month H&S bottom reversal. HARBIN BANK is a Hong Kong based investment holding company. Price chart of the stock formed an 18 month-long H&S bottom with the strong horizontal resistance standing at 2.45 levels. The right shoulder of the multi-month H&S bottom took the form of a bullish flag. While there is still room for the chart pattern breakout signal on the H&S Bottom, an initial breakout signal will be triggered with the possible breakout of the 5 month-long flag. Flags are considered to be bullish continuation and H&S bottoms are major bottom reversal chart patterns. These are two positive technical chart developments for the stock. A breakout is required for confirmation.
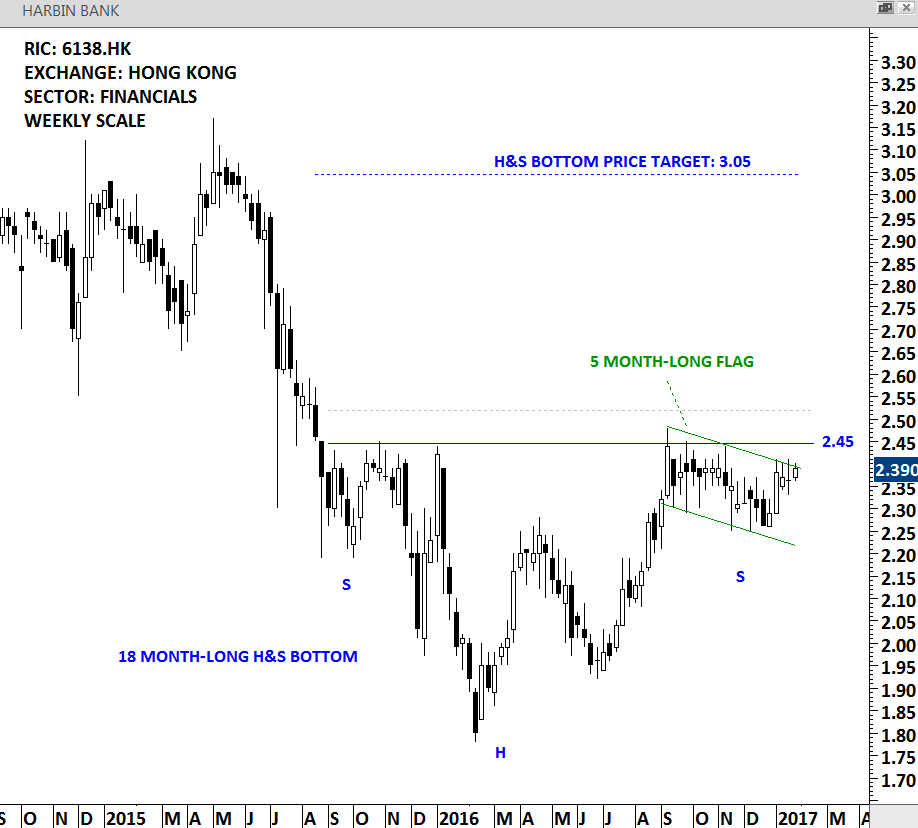
HARBIN BANK – WEEKLY SCALE
INDUSTRIAL AND COMMERCIAL BANK OF CHINA (1398.HK)
ICBC is principally involved in the provision of banking and related financial services. It is listed on the Hong Kong Stock Exchange. Similar to several banking and financial stocks listed on the Hong Kong Stock Exchange, ICBC is also forming a multi-month H&S bottom with the strong horizontal resistance standing at 5.15 levels. Over the past 5 months the stock formed a symmetrical triangle that can act as a continuation chart pattern. The upper boundary of this shorter term chart pattern stands at 4.85 levels. Breakout from the 5 month-long symmetrical triangle can act as an early signal for a possible larger scale bullish development.
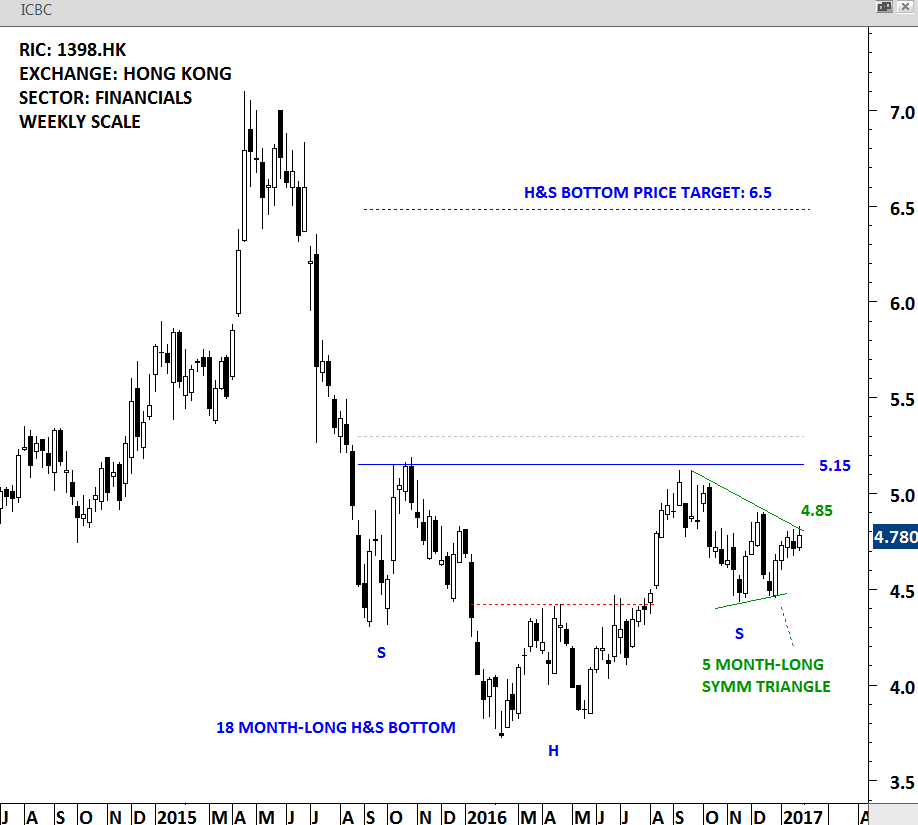
ICBC – WEEKLY SCALE
TURQUOISE HILL RESOURCES (TRQ)
TURQUOISE HILL RESOURCES is an international mining company. The chart below shows the price on the NYSE. Price chart formed a 6 month-long cup & handle chart pattern with the strong horizontal resistance standing at 3.65 levels. Over the past 6 months the stock tested the 3.65 levels for three times. Cup & handle is considered to be a bullish continuation chart pattern. A daily close above 3.75 levels will confirm the breakout from the bullish chart pattern with a possible price target of 4.5 levels.
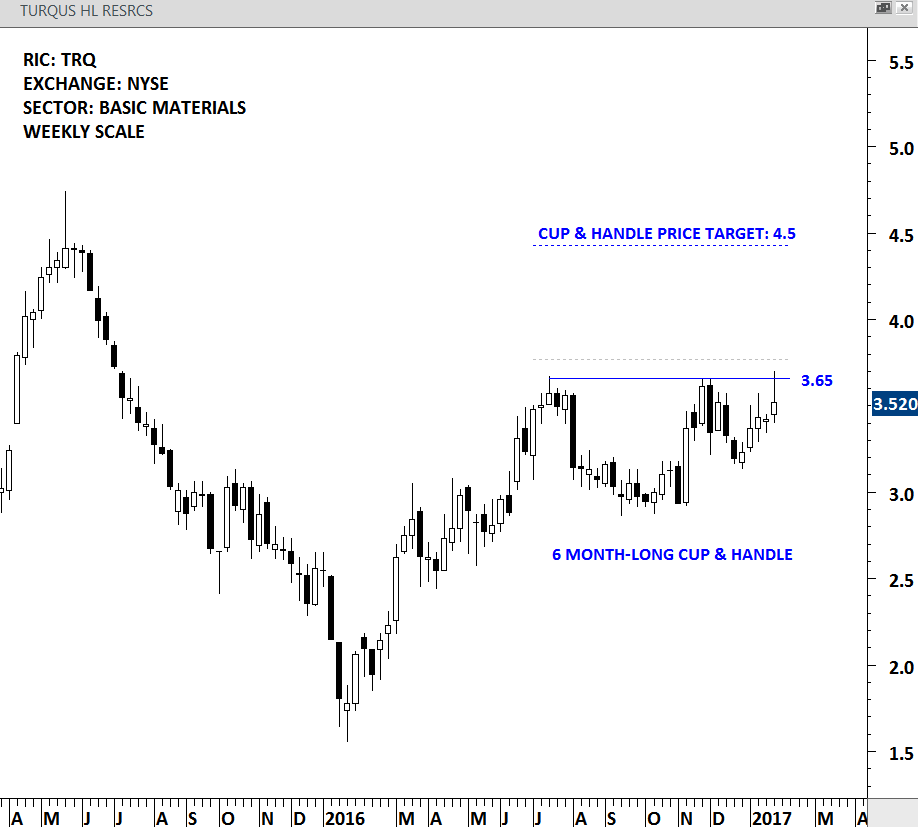
TURQUS HL RSC – WEEKLY SCALE
CANADIAN PACIFIC RAILWAY (CP)
CANADIAN PACIFIC RAILWAY LTD. together with its subsidiaries, operates a transcontinental railway in Canada and the United States. The chart below shows the price on the NYSE. Price chart of CANADIAN PACIFIC formed a 4 month-long rectangle with the strong horizontal resistance standing at 156.7 levels. If the 4 month-long rectangle acts as a continuation chart pattern, breakout above 156.7 levels can also complete a multi-month base formation that could possibly start a larger scale uptrend. A daily close above 161 levels will confirm the breakout from the rectangle chart pattern.
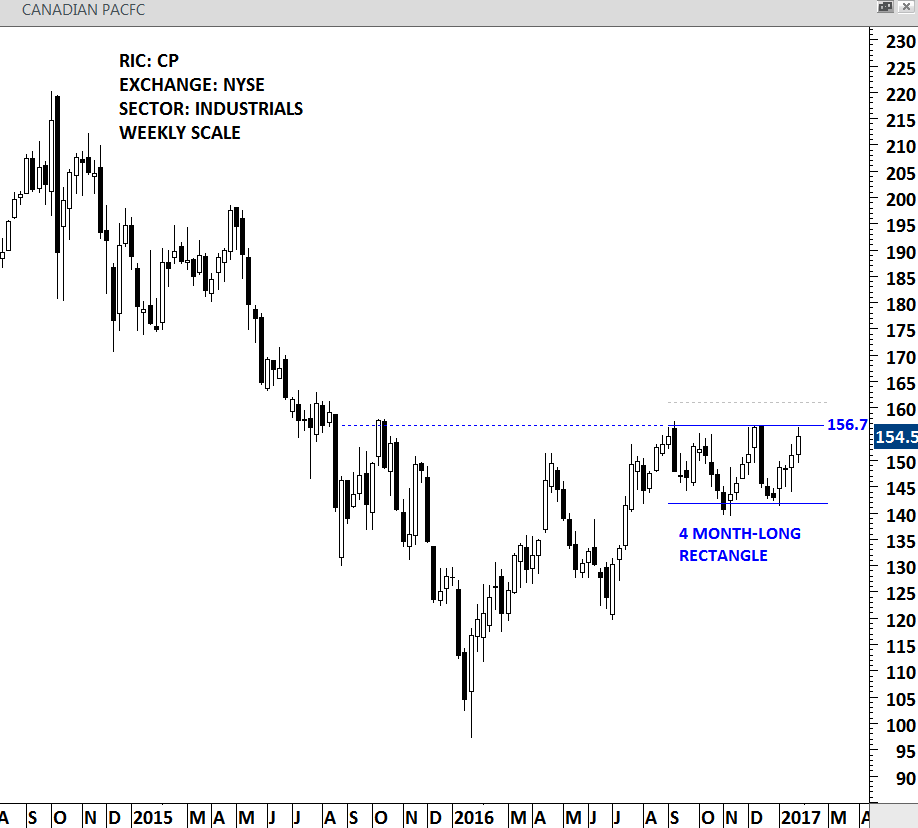
CANADIAN PACIFIC – WEEKLY SCALE
Zespol Elektrowni Patnow Adamow Konin SA is a Poland based company engaged in the electricity sector. The stock is listed on the Warsaw Stock Exchange. Price chart formed a 7 month-long ascending triangle with the strong horizontal resistance standing at 14.15 levels. This week the stock tested the upper boundary of the bullish continuation chart pattern for the 4th time. A daily close above 14.70 levels will confirm the breakout from the 7 month-long ascending triangle with a possible price target of 18.
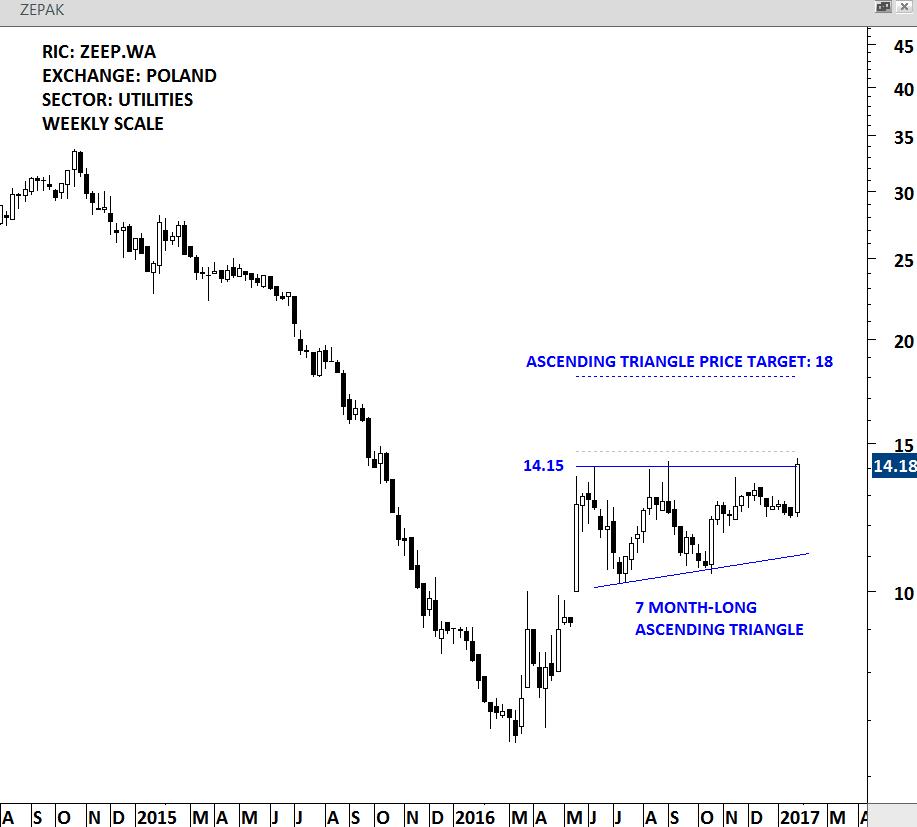
ZEPAK – WEEKLY SCALE
SANLAM LIMITED is a South Africa-based holding company. The Company provides solutions, which include life insurance; general insurance; investment management (including retail savings, asset management and wealth management); credit and structuring, and administration, health and other (such as estate planning, trusts, wills, and lending and health management). Price chart formed a 9 month-long symmetrical triangle with the upper boundary standing at 6,865 levels. This week’s price action marked the 3rd test of the upper boundary. A daily close above 7,070 levels can confirm the 9 month-long symmetrical triangle as a bullish continuation chart pattern with a possible price target of 8,240.
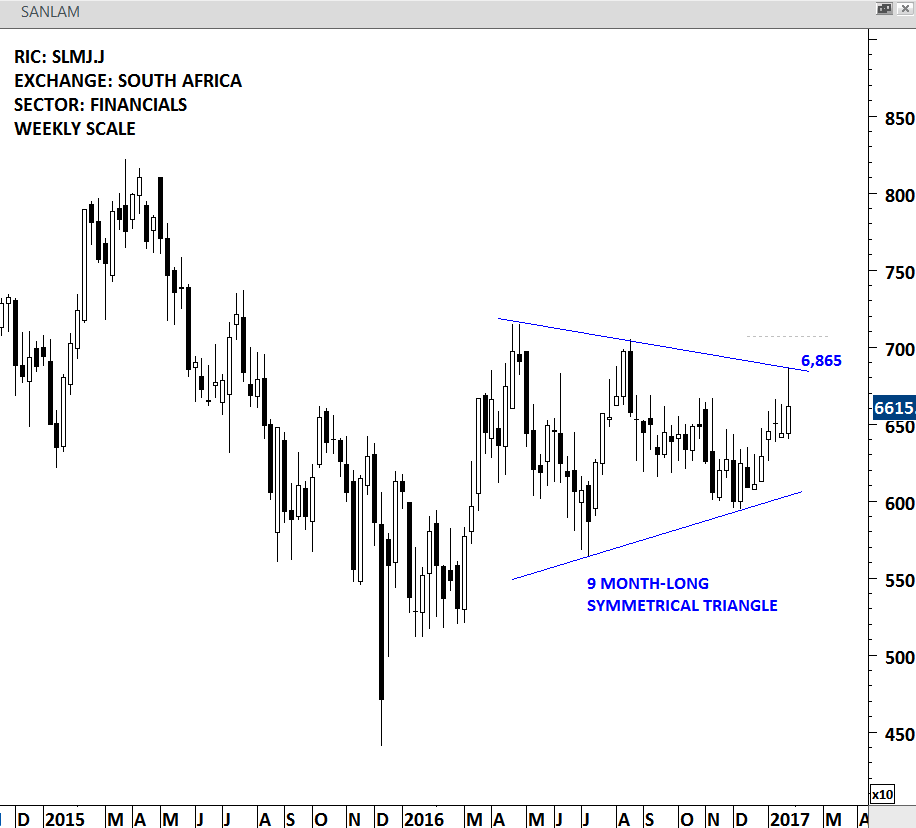
SANLAM – WEEKLY SCALE
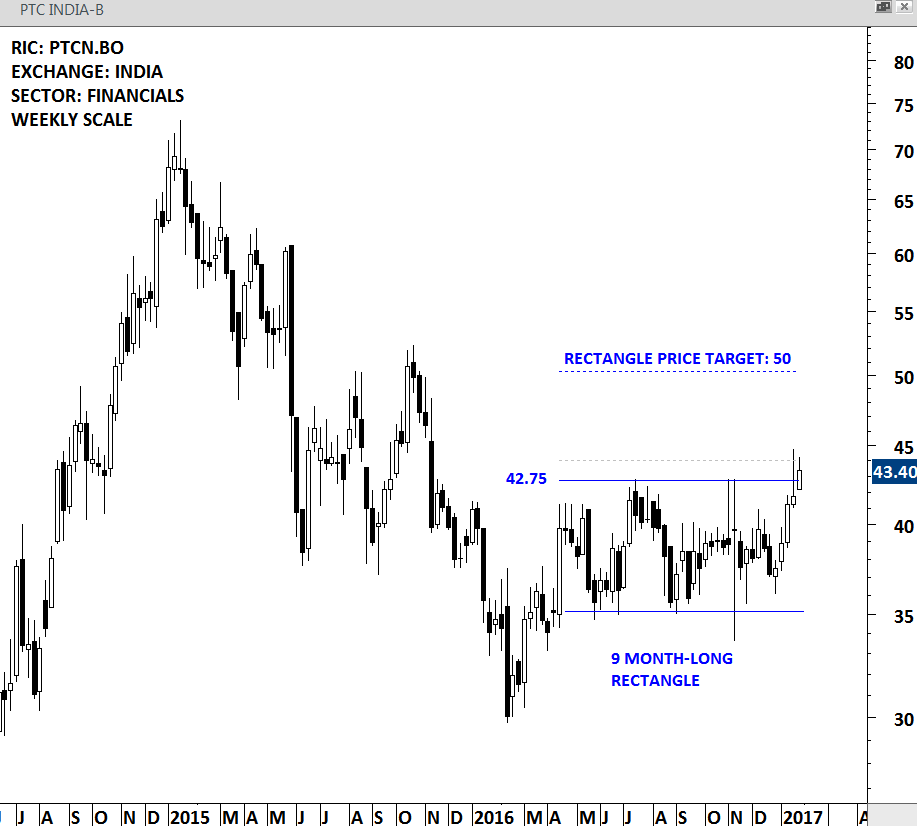
PTC INDIA FINANCIAL SERVICES (PTCN.BO)
PTC India Financial Services Limited is an infrastructure finance company. The Company provides financial services to the entities in energy value chain. Price chart of PTC INDIA formed a 9 month-long rectangle. Rectangle chart pattern can act as a bullish continuation. The upper boundary of the rectangle stands at 42.75 and this week’s price action managed to closed above that level. A daily close above 44 levels will confirm the breakout from the multi-month sideways consolidation. Rectangle chart pattern price target stands at 50.
PTC INDIA – WEEKLY SCALE
With the help of MetaStock, I can scan/explore thousands of charts with predefined criteria, short-list many of them and then manually search for those great chart patterns. Every week I start from 20,000+ charts and short-list approximately to 3,000 names. Out of those I find the best looking charts and bring it to your attention. MetaStock was kind enough to offer a special discount for Tech Charts followers for their award-winning software. By following this link METASTOCK DISCOUNT FOR TECHCHARTS FOLLOWERS (3 MONTHS FOR THE PRICE OF 1) you can get discounted access to more than 400,000 data series on global financial markets.
DAIRY FARM INTERNATIONAL HOLDINGS (DAIR.SI)
A TECHCHARTSALERT was issued on Monday with the strong breakout on DAIRY FARM, listed in Singapore Stock Exchange. Breakouts from well-defined and tight consolidation ranges can result in sharp price action. This was the case for DAIRY FARM. Following its breakout, the stock reached its rectangle chart pattern price target in a matter of a week.
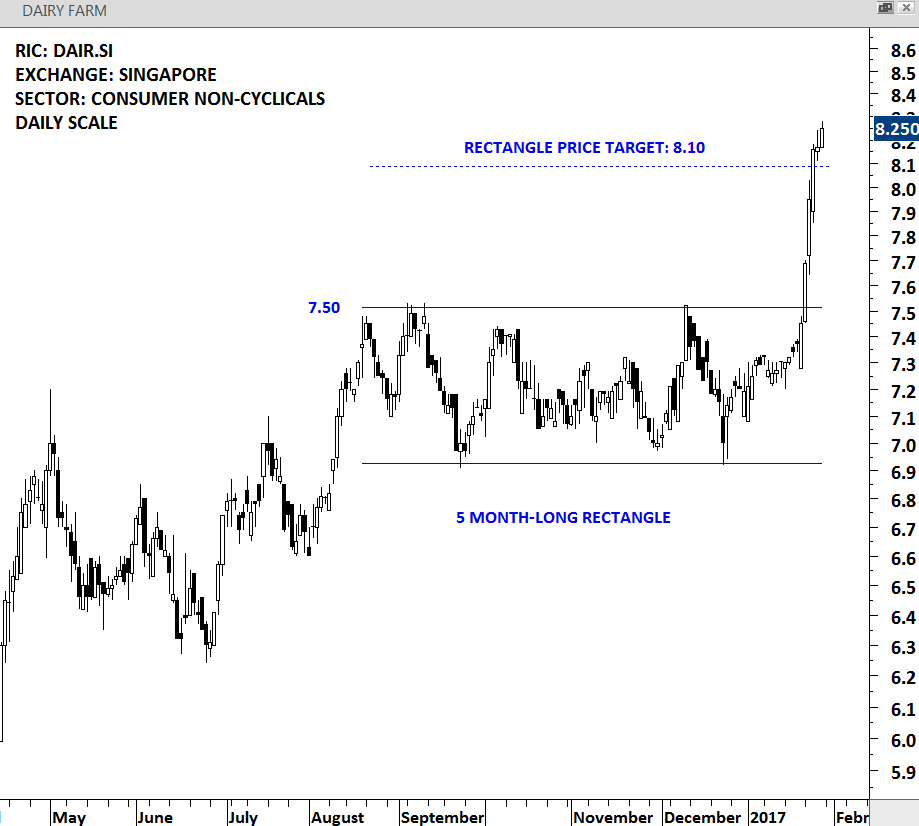
DAIRY FARM – DAILY SCALE
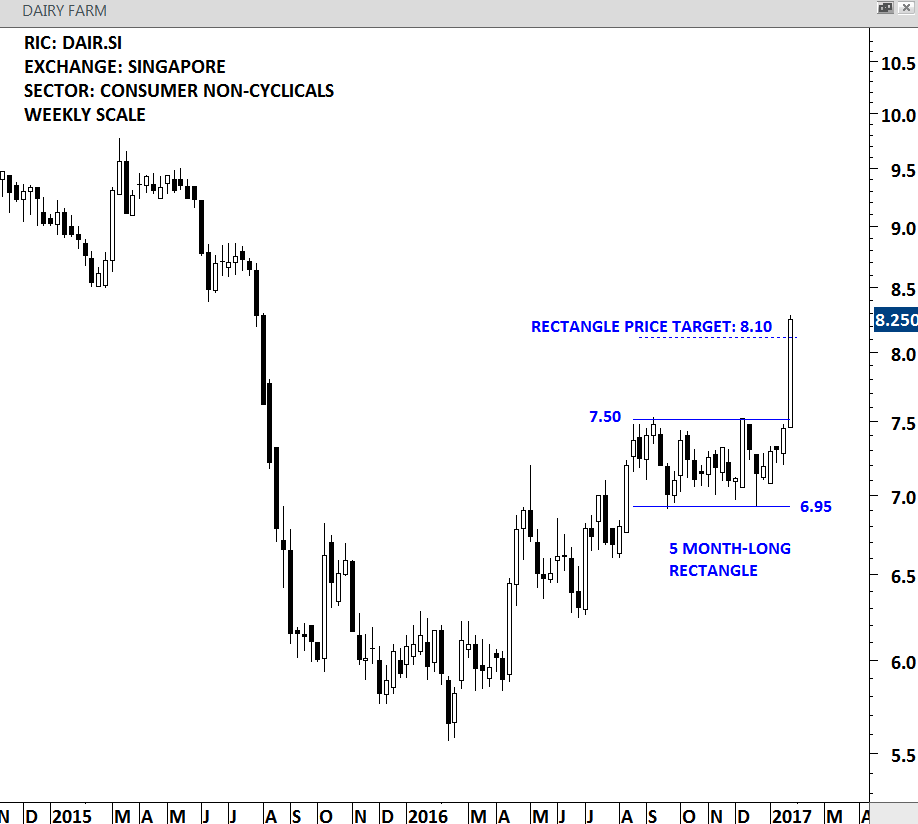
DAIRY FARM – WEEKLY SCALE
SINGAPORE STRAITS TIMES INDEX (.STI)
SINGAPORE’S equity benchmark index completed a 9 month-long ascending triangle with the breakout above 2,965 levels. After a week of pullback and a re-test of the horizontal support, the index resumed its uptrend. Ascending triangle price target stands at 3,200 levels.
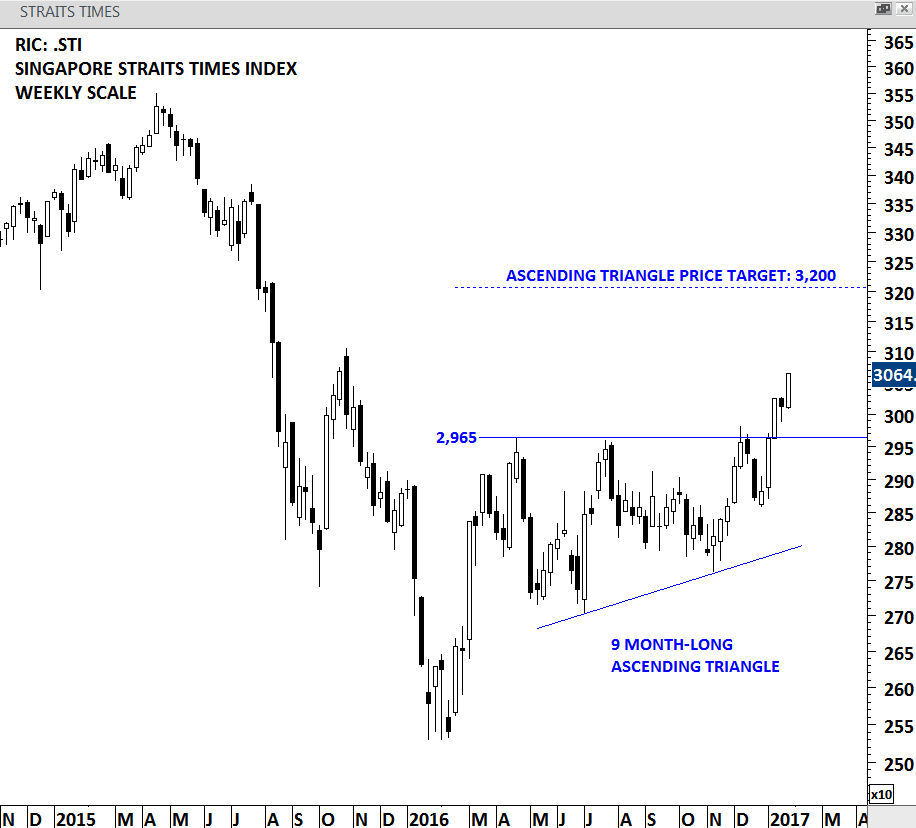
STI – WEEKLY SCALE
TAMBURI INVESTMENT PARTNERS (TIP.MI)
TAMBURI is a financial company listed on the Milan Stock Exchange. This week’s price action completed a 20 month-long H&S continuation chart pattern. While the stock closed well below its weekly highs, this could possibly be an intra-week pullback to the broken horizontal resistance at 3.75. Stock should remain above 3.75 for the bullish outlook to remain intact.
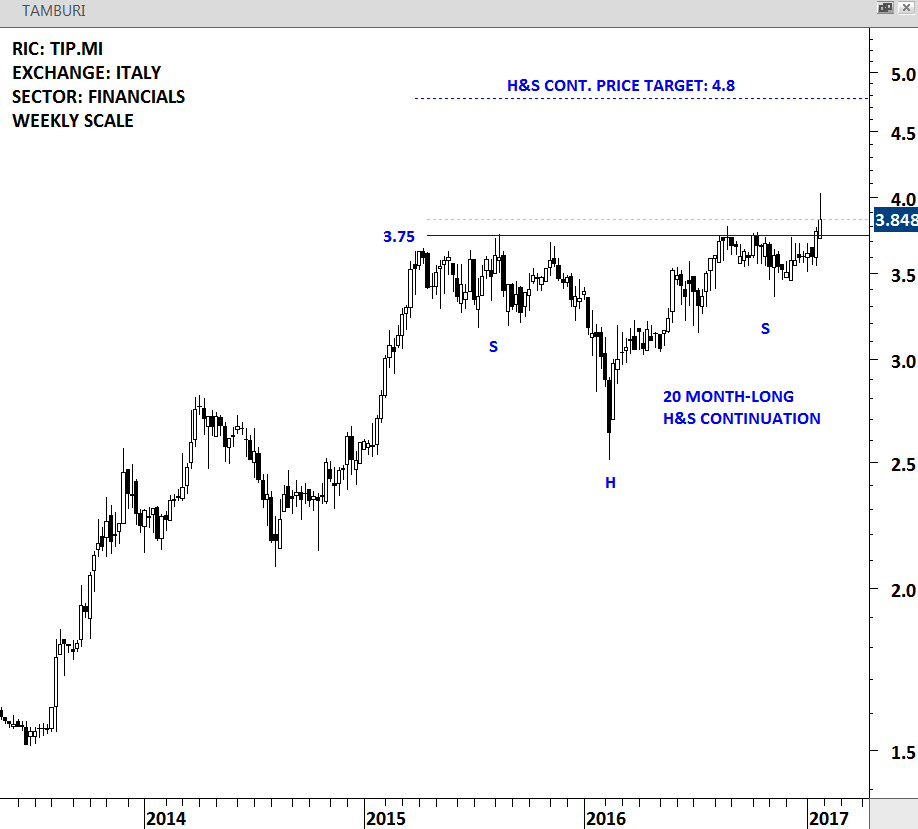
TAMBURI – WEEKLY SCALE
FIRST TRACTOR (0038.HK)
First Tractor Company Limited is principally engaged in the manufacture and sale of machinery products. This week’s breakout completed a year-long H&S bottom and also a 5 month-long symmetrical triangle. H&S bottom price target stands at 5.4 levels. Stock should hold above 4.60 levels for the bullish outlook to remain intact.
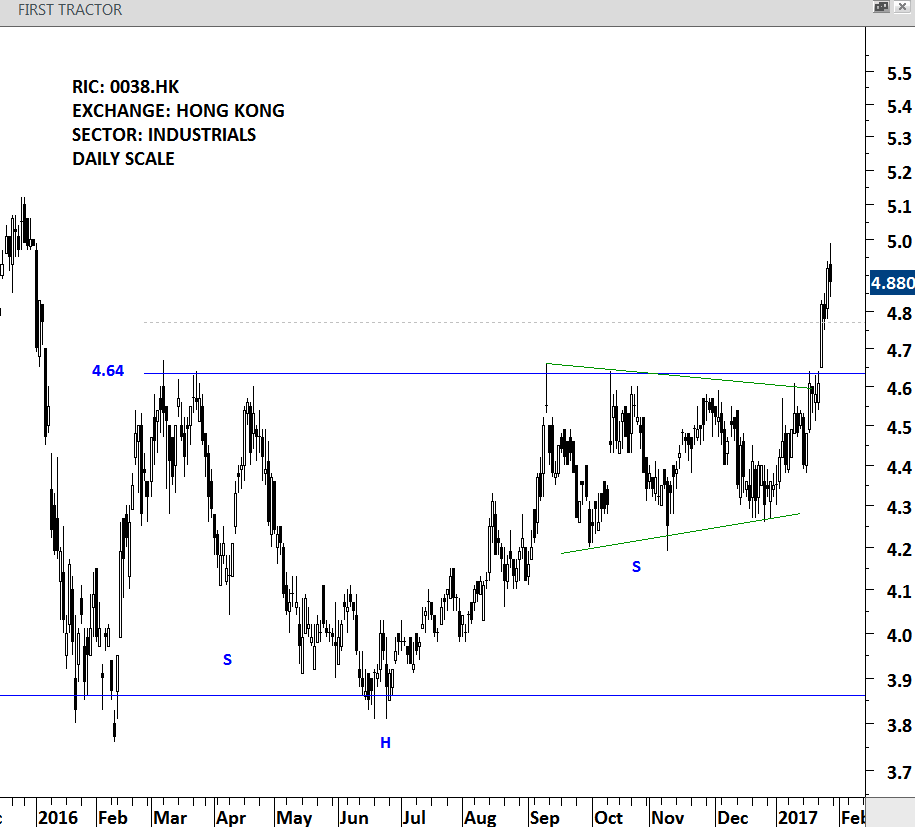
FIRST TRACTOR – DAILY SCALE
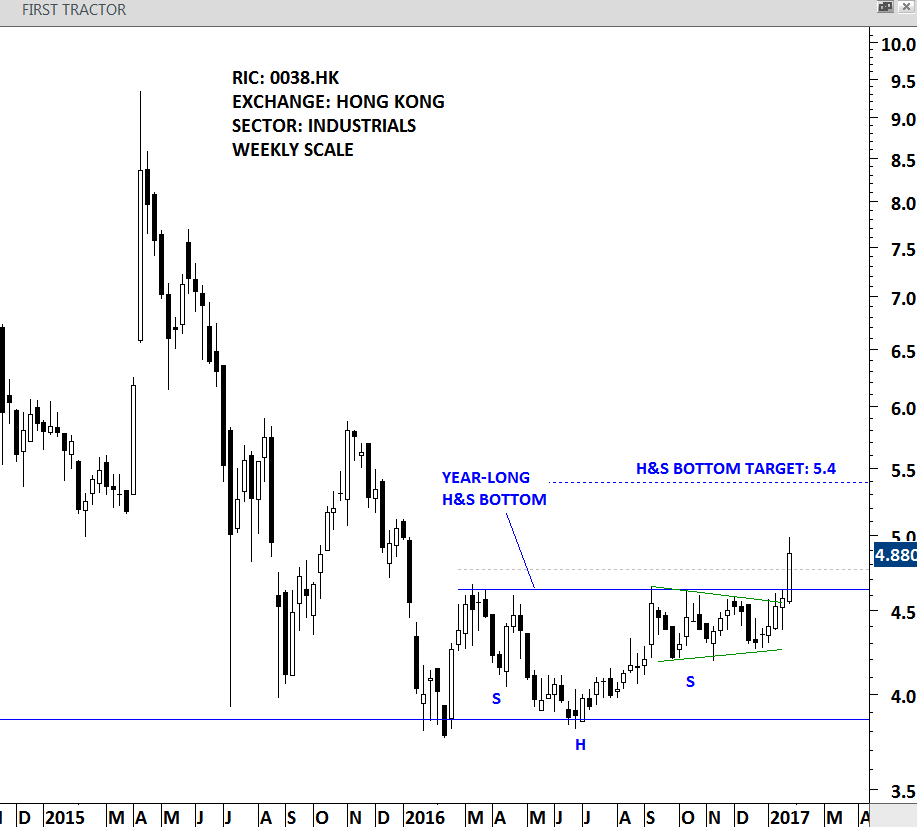
FIRST TRACTOR – WEEKLY SCALE
LIBERTY INTERACTIVE CORP. (LVNTA.O)
LIBERTY INTERACTIVE CORP. is a consumer cyclical company listed on the NASDAQ. The company owns interests in subsidiaries and other companies that are engaged in the video and digital commerce industries. This week’s strong breakout completed a 20 month-long H&S continuation chart pattern with the price target of 50.85. Stock should hold above 41.15 levels for the bullish outlook to remain intact.
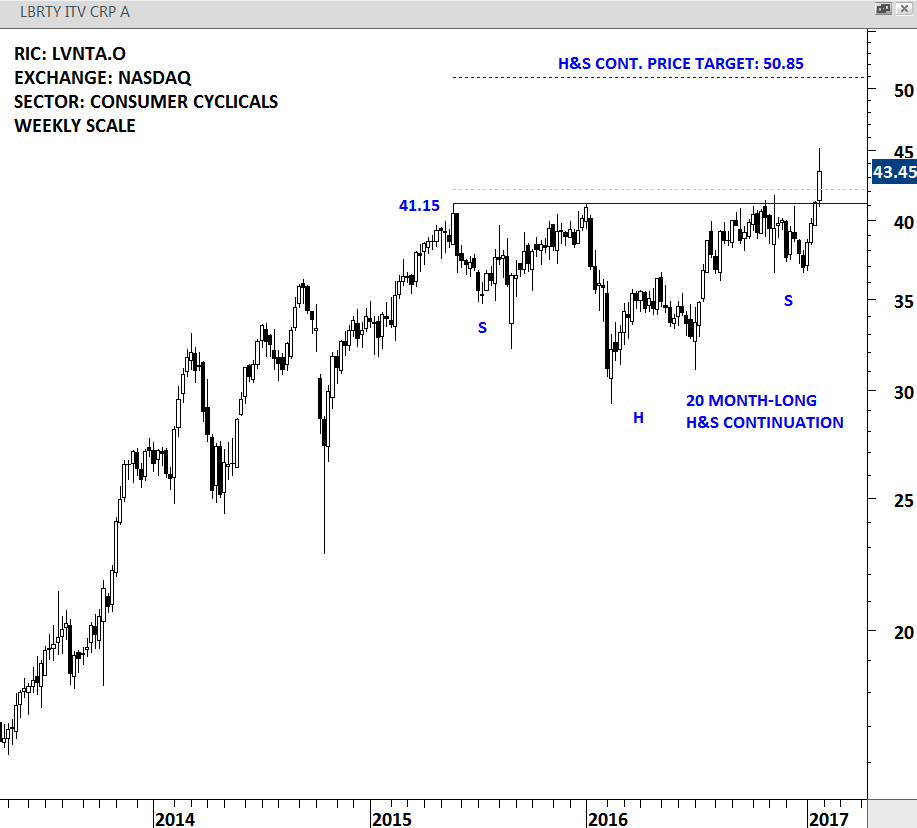
LIBERTY INTERACTIVE – WEEKLY SCALE