TURKEY YIELDS and BIST 100
Over the analyzed period when Turkey 2YR Bond yields outperformed the 10YR, equity index entered into a correction and vice versa. This is an interesting correlation. Patterns on the relative performance chart of the 2YR Bond Yields vs. 10YR Bond Yields can reveal some important information on the direction of the markets in the following months.
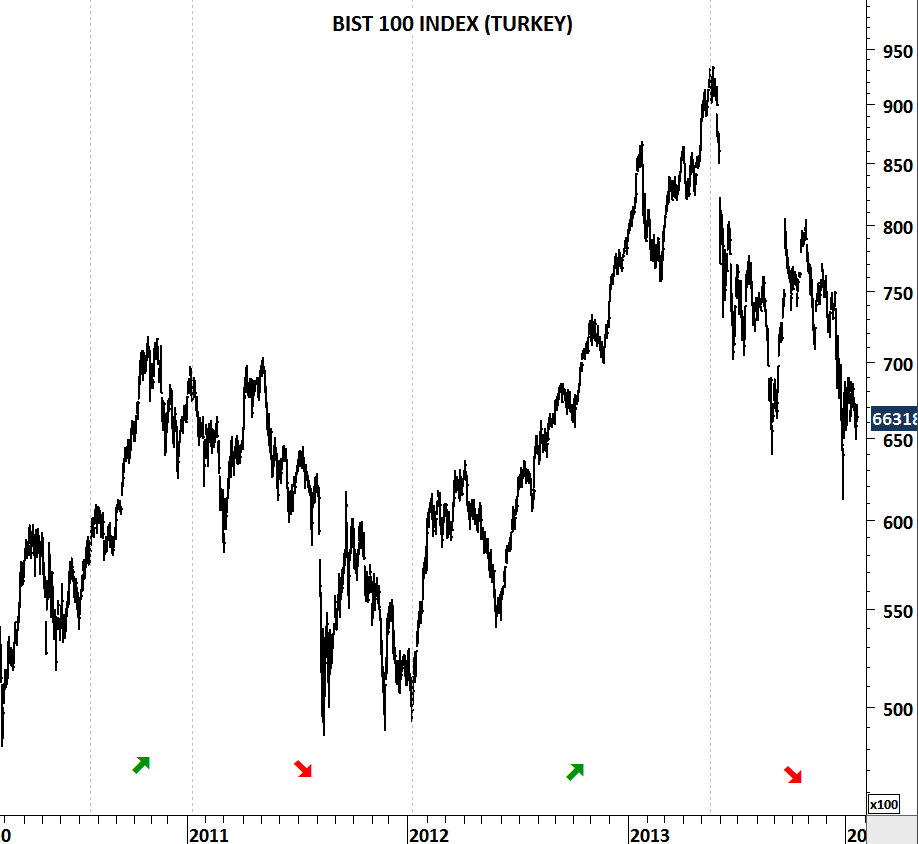
Technical outlook on the 2YR/10YR chart is very similar to the second half of 2011. Since the beginning of 2011 BIST 100 was in a correction. Equity index resumed its downtrend after the 2YR/10YR broke above 0.97 levels. Relative performance reached 1.17 levels and BIST 100 reached the lowest level for that year.
Relative performance ratio between the short and long-term yields are now challenging the previous resistance at 1.00 levels. Breakout above this level could send the ratio towards 1.10-1.15 area once again and the equity index lower to test 60,000 levels. Failure to break above 1.00 levels will help the ratio to ease back towards 0.90 and the BIST 100 to hold above 65K.