GLOBAL EQUITY MARKETS – April 22, 2017
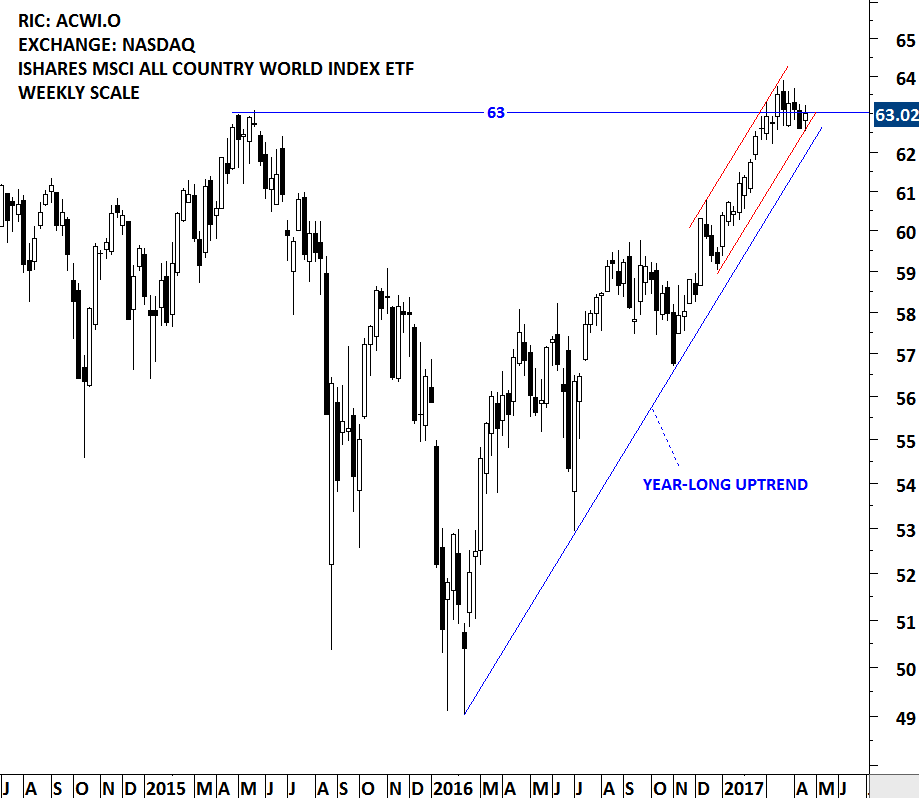
It was a mixed week for Global equity market performance due to each countries own political and geopolitical developments. However, the benchmark for Global equities, the MSCI ALL COUNTRY WORLD INDEX still shows a clear uptrend. MSCI ALL COUNTRIES WORLD INDEX captures large and mid cap representation across 23 Developed Markets and 23 Emerging Markets countries. With 2,481 constituents, the index covers approximately 85% of the global investable equity opportunity set. iShares has an MSCI ACWI ETF that seeks to track the MSCI ALL COUNTRIES WORLD INDEX. The ETF is listed on the Nasdaq Stock Exchange.
Since the beginning of 2016, MSCI ACWI ETF (ACWI.O) is in a clear uptrend. Over the past two months the price has been challenging the resistance at 63 levels. The continuation of the uptrend will depend on the strength around this resistance level.
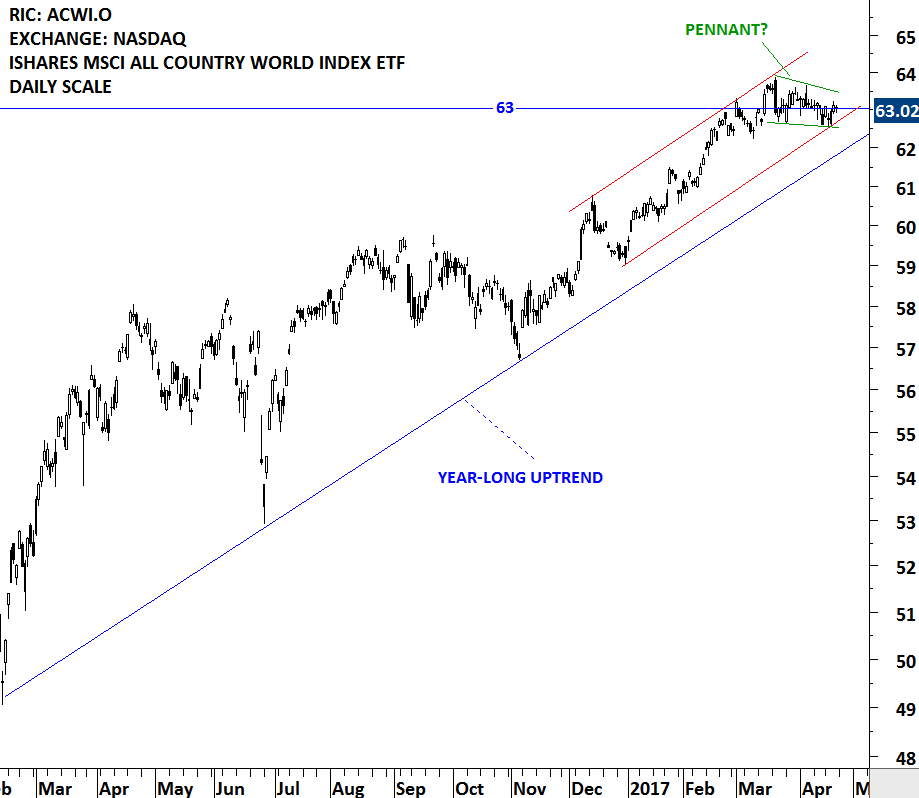
iSHARES MSCI ACWI ETF (ACWI.O)
Last one month’s price action can be identified as a possible pennant formation. Pennants are short-term continuation patterns that mark a small consolidation before the previous move resumes. Pennants, which are similar to flags in terms of structure, have converging trendlines during their consolidation period and they last from one to three weeks. Breakout above 63 levels can renew upside momentum both on daily and weekly scale. Strong support area remains between 62 and 62.5.
This week there are 3 new chart pattern breakout signals.
#TECHCHARTSALERT
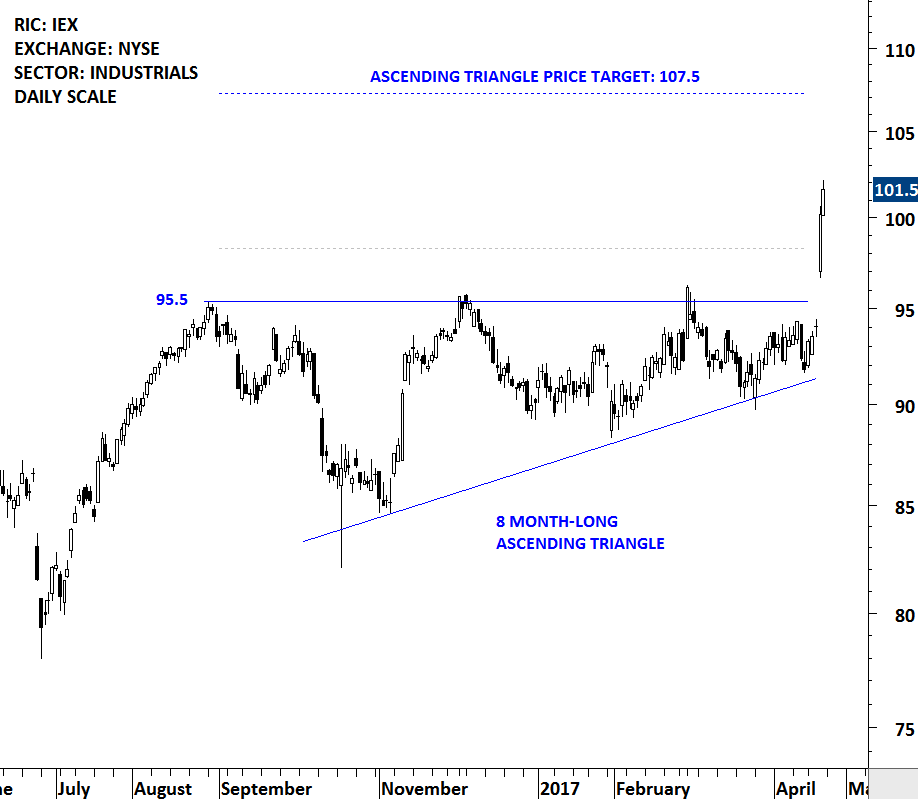
IDEX CORP (IEX)
IDEX Corporation (IDEX) operates an applied solutions business that sells pumps, flow meters and other fluidics systems, and components and engineered products. The stock is listed on the New York Stock Exchange. Price chart formed an 8 month-long bullish ascending triangle with the strong horizontal resistance at 95.5 levels. The daily close above 98.3 levels confirmed the breakout from the multi-month continuation chart pattern with the possible price target of 107.5. Last two day’s price action pushed IDEX to all-time highs.
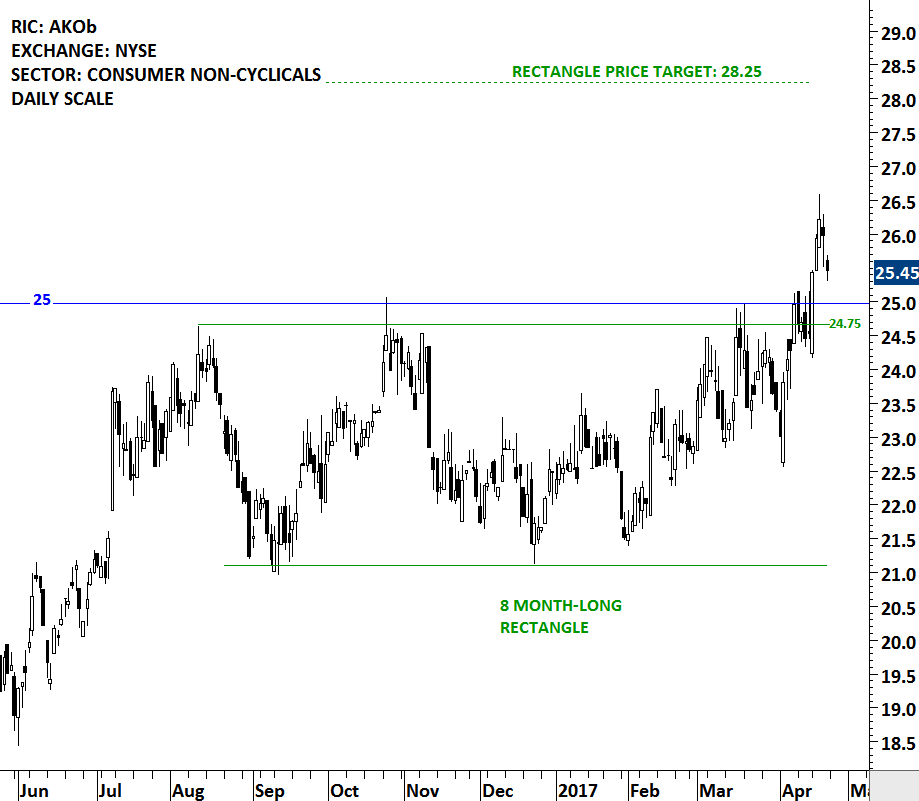
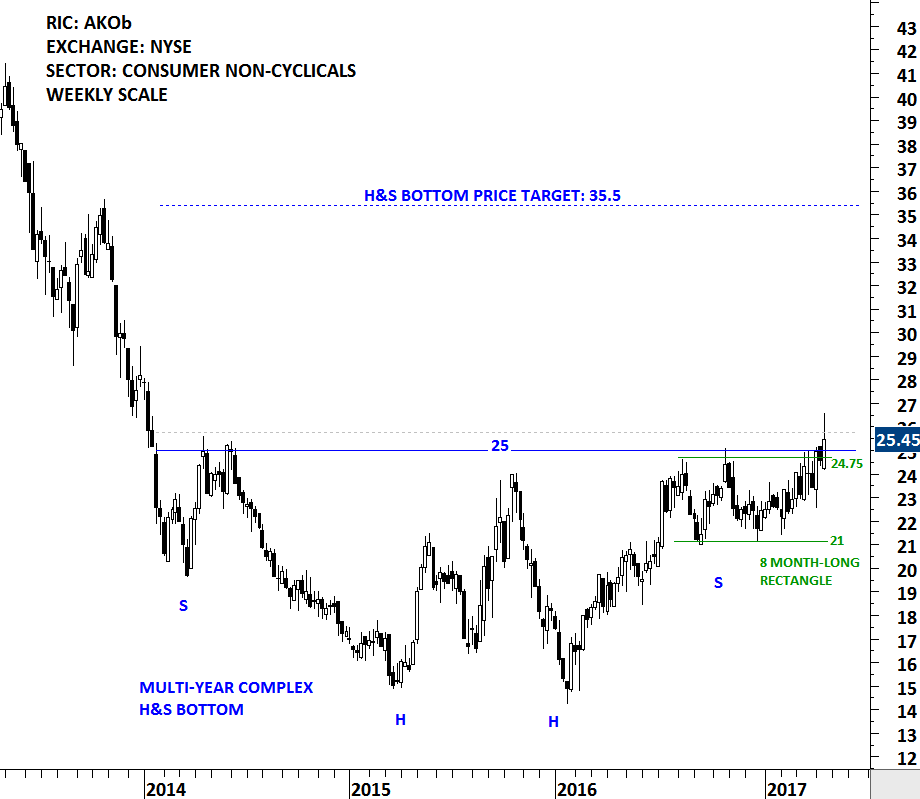
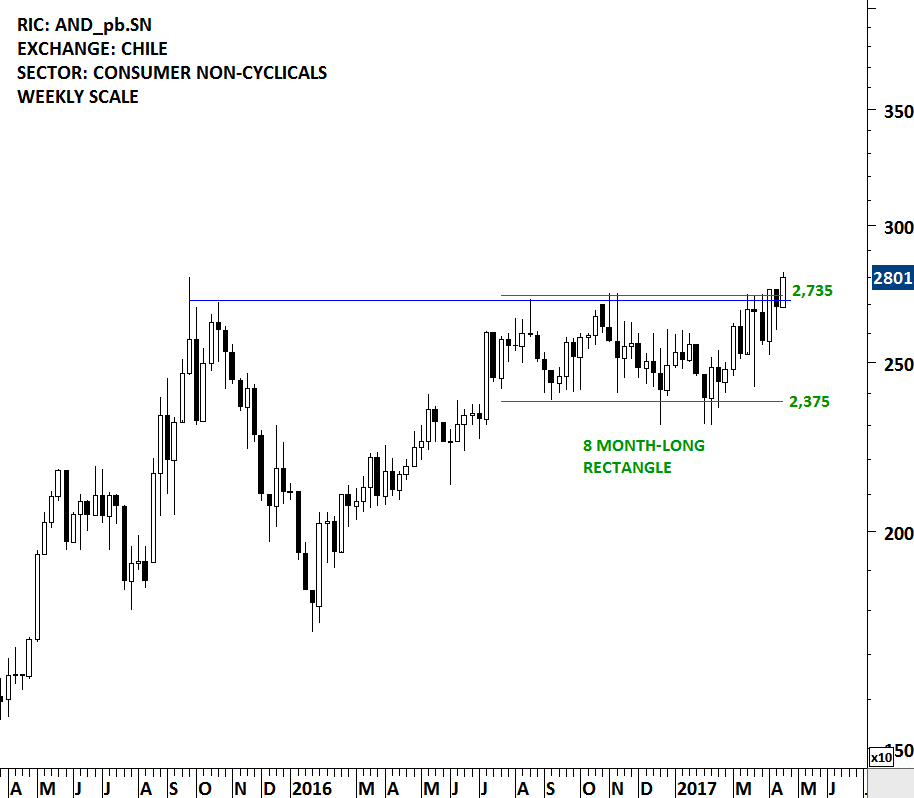
EMBOTELLADORA ANDINA SA (AKOb)
Embotelladora Andina S.A. (Andina) is a bottler of Coca-Cola trademark beverages in Latin America. The Company operates in four segments: Chile, Brazil, Argentina and Paraguay. It produces and distributes fruit juices, other fruit-flavored beverages and mineral and purified water in Chile, Argentina and Paraguay under trademarks owned by The Coca-Cola Company. The stock is listed on the Chile Santiago Stock Exchange and also on the New York Stock Exchange through depository receipt. Price chart formed an 8 month-long rectangle and a multi-month complex H&S bottom reversal. Both the medium-term and long-term chart patterns are bullish in nature. The daily close above 25.75 levels confirmed the breakout from both chart patterns during the week. Possible price target for the rectangle continuation stands at 28.25 levels. Price target for the H&S bottom reversal is at 35.5 levels.
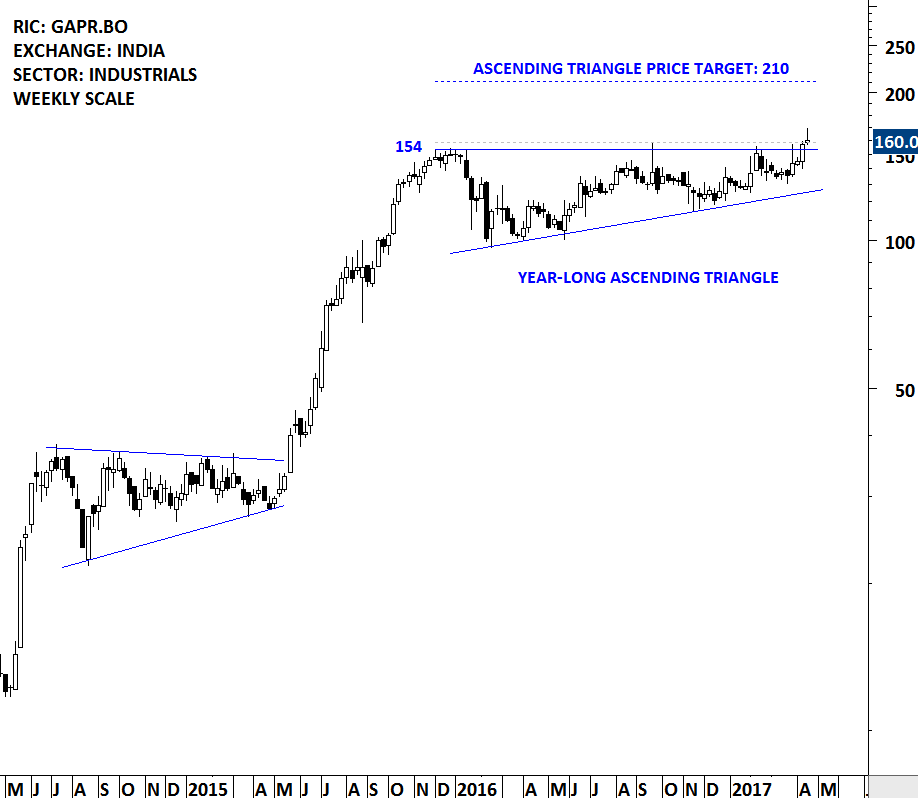
GAYATRI PROJECTS (GAPR.BO)
Gayatri Projects Limited is an infrastructure company. The Company focuses on Roads Projects, Industrial Projects and Power Projects. The Company is engaged in construction and project activities. It executes civil works, including roads, canals, airport runways, ports and harbors, dams and reservoirs, and railways across India. Price chart formed a year-long ascending triangle with the strong horizontal resistance standing at 154 levels. The daily close above 158.6 confirmed the breakout from the lengthy consolidation with a possible price target of 210 levels. 154 levels is now a strong support.
This week there are 6 additions to the watch list. UPONOR (Finland), RIGHTMOVE (UK) and BELC (Japan) are reviews from the earlier posts.
#TECHCHARTSWATCHLIST
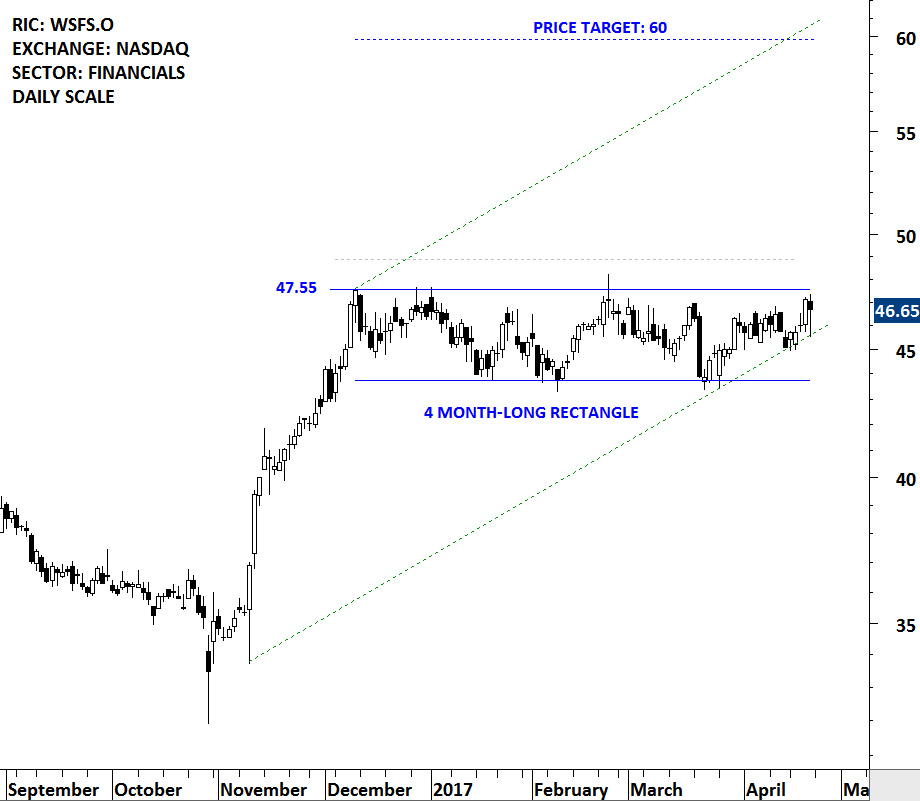
WSFS FINANCIAL CORP (WSFS.O)
WSFS Financial Corporation is a savings and loan holding company. The Company’s subsidiary is Wilmington Savings Fund Society, FSB (WSFS Bank or the Bank), which is the bank and trust company. The stock is listed on the Nasdaq Stock Exchange. Price chart formed a 4 month-long rectangle with the strong horizontal boundary standing at 47.55 levels. Rectangles usually form as a continuation chart pattern. WSFS Financial Corp. tested the strong resistance at 47.55 for three times over the course of the chart pattern. A daily close above 49 levels will confirm the breakout with a possible price target of 60 levels.
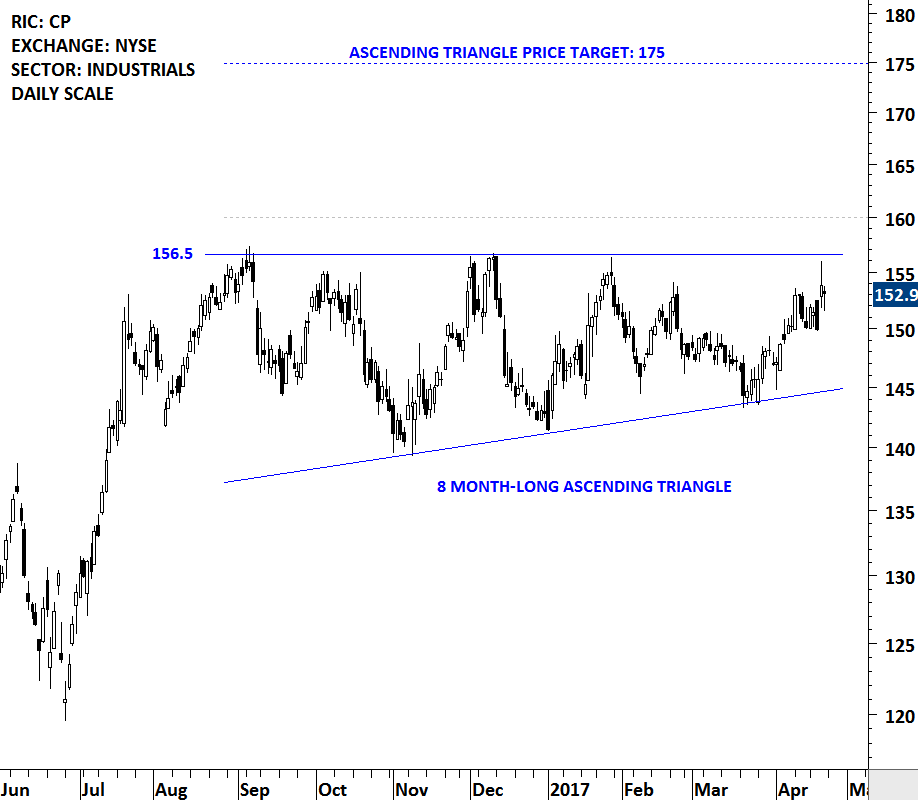
CANADIAN PACIFIC RAILWAY LTD (CP)
Canadian Pacific Railway Limited, together with its subsidiaries, owns and operates a transcontinental freight railway in Canada and the United States. The Company operates through rail transportation segment. The stock is listed on the New York Stock Exchange. Price chart formed an 8 month-long ascending triangle with the strong horizontal resistance standing at 156.5 levels. Over the past eight months Canadian Pacific Railway tested the strong resistance for four times. A daily close above 160 levels will confirm the breakout from the lengthy consolidation with a possible price target of 175 levels.
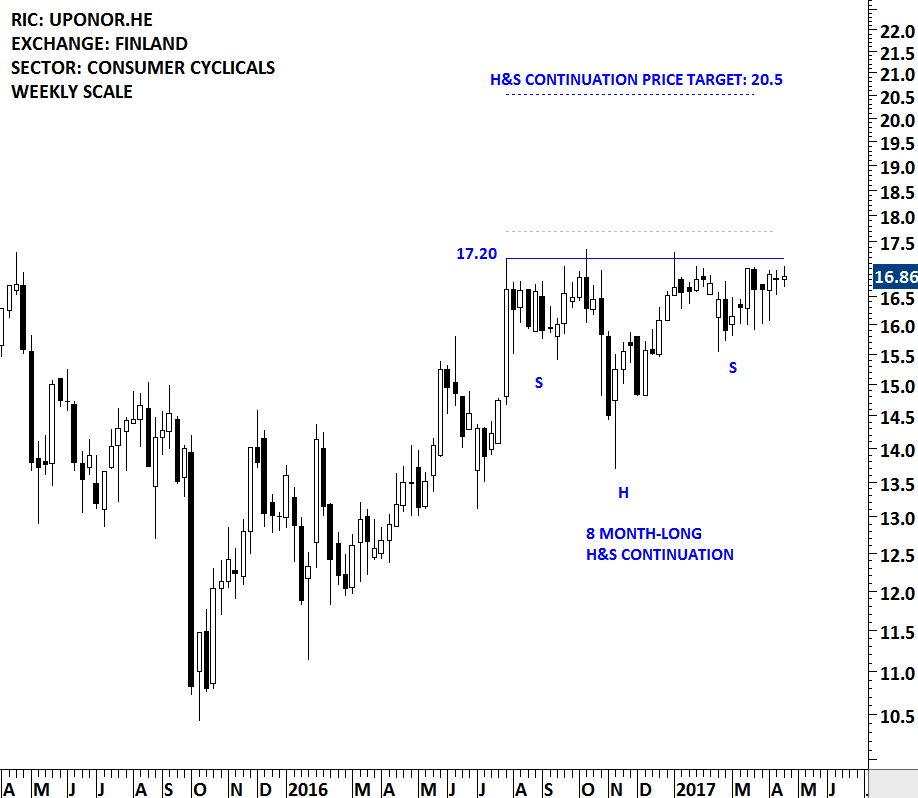
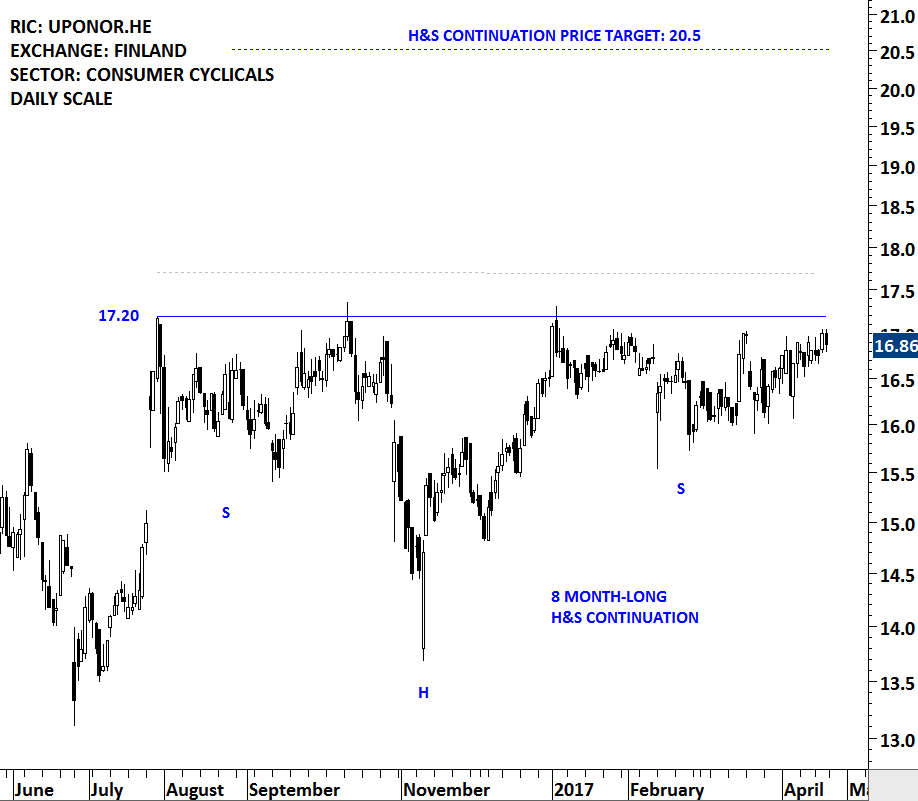
UPONOR OYJ (UNR1V.HE)
Uponor Oyj is a Finland-based supplier of plumbing and heating systems. The stock is listed on the Helsinki Stock Exchange. Price chart formed a 7 month-long H&S continuation chart pattern with the strong horizontal resistance standing at 17.20 levels. H&S continuation is a bullish chart pattern. While H&S top/bottom act as a major reversal chart pattern, H&S can also form as a continuation chart pattern in an up/down trend. The H&S continuation on Uponor Oyj formed after a 7 month-long uptrend. Due to the prior uptrend, H&S continuation on this chart is expected to resolve on the upside. A daily close above 17.70 will confirm the breakout from the multi-month consolidation with a possible price target of 20.5 levels.
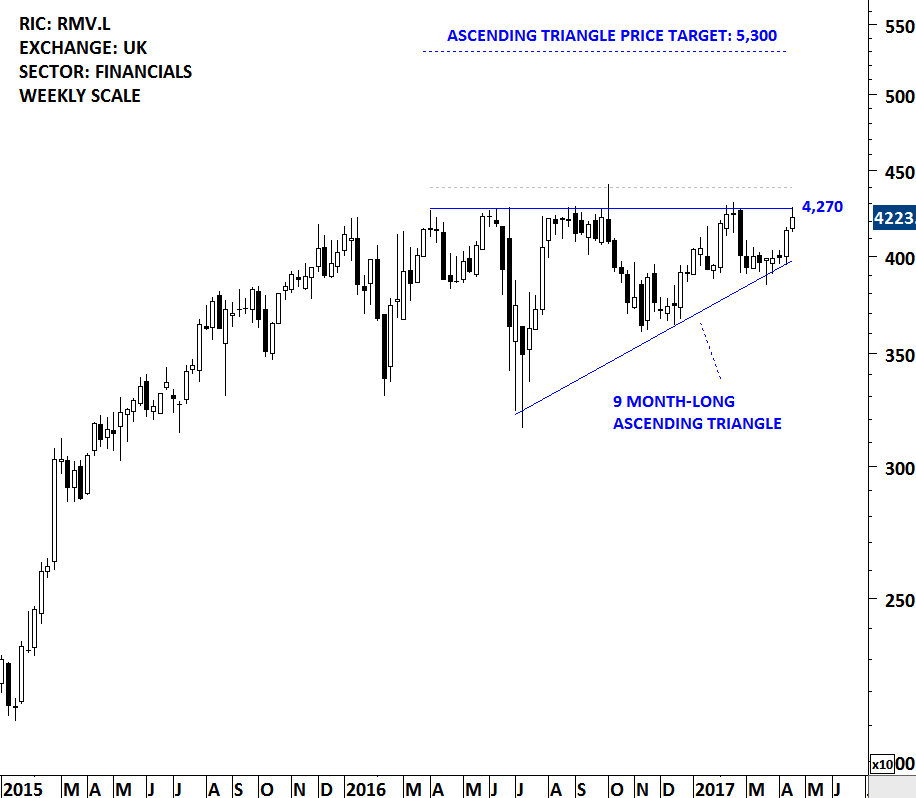
RIGHTMOVE PLC (RMV.L)
Rightmove plc is a United Kingdom-based company which operates as a property portal. The Company’s principal business is the operation of the rightmove.co.uk Website. The Company’s Website and mobile platforms provide online property search. The stock is listed on the London Stock Exchange. Price chart formed a 9 month-long ascending triangle with the strong horizontal resistance standing at 4,270 levels. A daily close above 4,400 will complete the multi-month bullish continuation chart pattern with the possible price target of 5,300 levels.
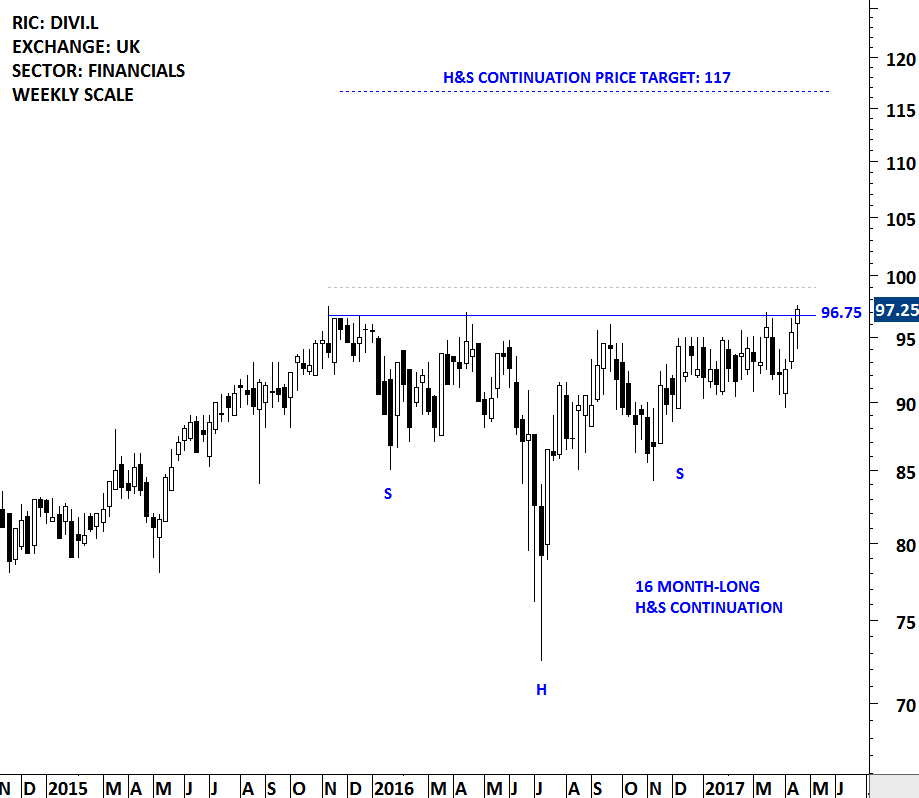
DIVERSE INCOME TRUST PLC (DIVI.L)
The Diverse Income Trust plc is a closed-ended investment fund. The Fund’s investment objective is to provide shareholders with an attractive and growing level of dividends coupled with capital growth over the long-term. The stock is listed on the London Stock Exchange. Price chart formed a 16 month-long H&S continuation chart pattern with the strong horizontal boundary standing at 96.75 levels. The strong horizontal resistance was tested for more than five times over the course of the chart pattern. H&S continuation is classified as a bullish chart pattern. Diverse Income Trust is preparing for a breakout to all-time high levels. A daily close above 99 levels will confirm the breakout with a possible price target of 117 levels.
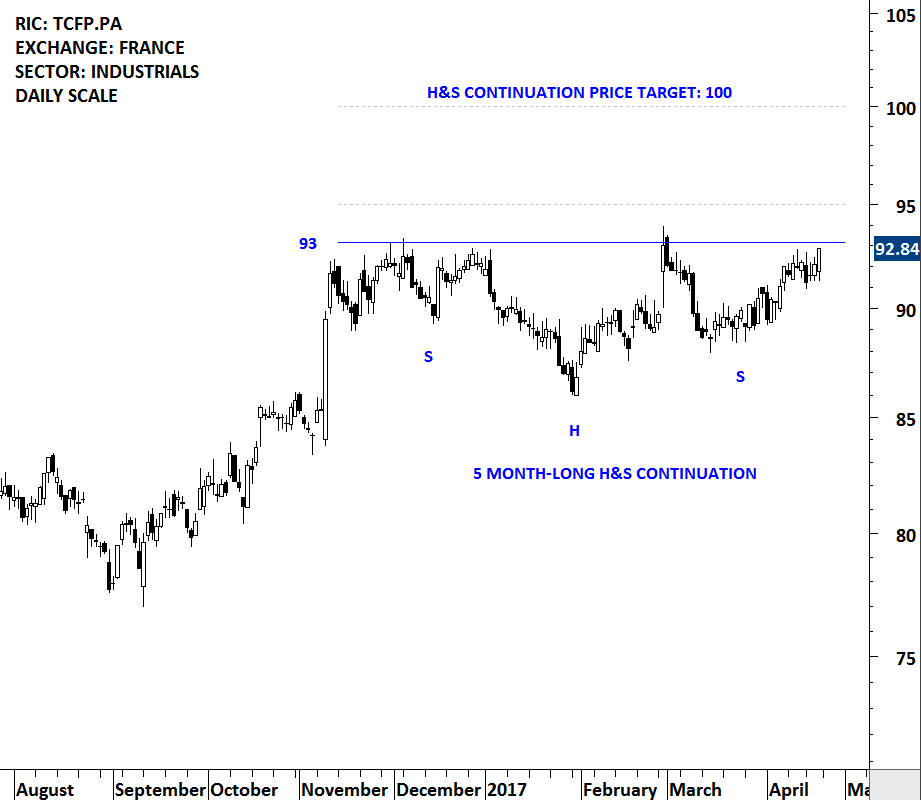
THALES SA (TCFP.PA)
Thales SA is a France-based provider of secure solutions across five markets, such as aeronautics, space, ground transportation, defense and security. It integrates technologies, systems, software, services and equipment. It develops and builds end-to-end solutions. The stock is listed on the Paris Stock Exchange. Price chart formed a 5 month-long H&S continuation chart pattern with the strong horizontal resistance standing at 93 levels. 5 month-long horizontal resistance was tested for four times. A daily close above 95 levels will confirm the breakout from the bullish continuation chart pattern with a possible price target of 100 levels. Breakout will push Thales to all-time high levels.
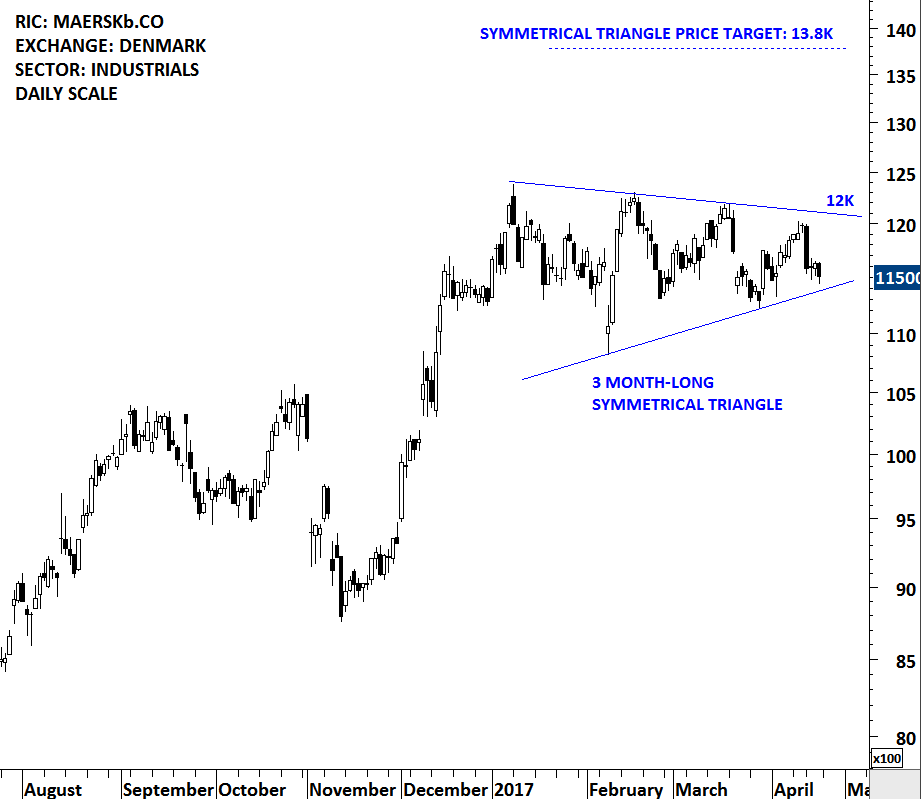
AP MOELLER – MAERSK A/S (MAERSKb.CO)
A.P. Moeller-Maersk A/S is a Denmark-based shipping and oil company. It is active in the container logistics and upstream oil value chains. The stock is listed on the Copenhagen Stock Exchange. Price chart is possibly forming a 3 month-long symmetrical triangle. The boundaries are between 11.5K and 12K. The chart pattern is possibly at its early stages. Another test of the upper boundary will increase the likelihood of the symmetrical triangle forming as a continuation chart pattern.
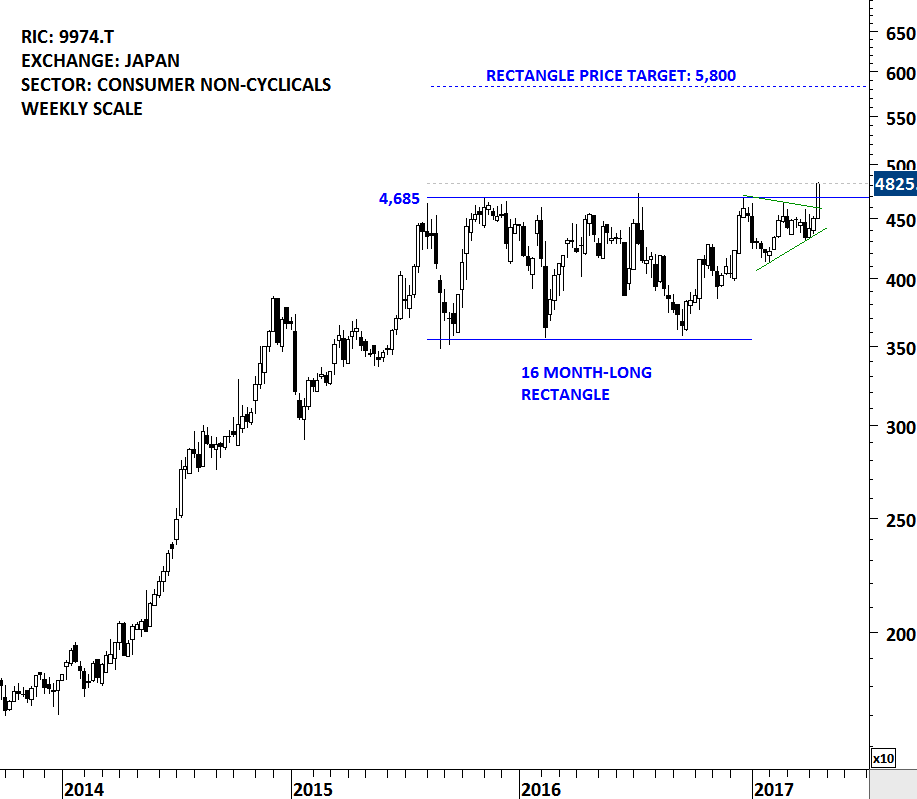
BELC CO LTD. (9974.T)
Belc CO., LTD. is a Japan-based company mainly engaged in the operation of a chain of retail stores in the Tokyo metropolitan area, with a focus on Saitama Prefecture. Its retail stores provide fresh foods, prepared foods, daily necessities and other products. The stock is listed on the Tokyo Stock Exchange. Price chart formed a 16 month-long rectangle with the strong horizontal boundary standing at 4,685 levels. This week’s price action was strong. Edwards and Magee in their book Technical Analysis of Stock Trends suggest that a stock should breakout or breakdown by a min 3% margin above or below the resistance/support (on a daily closing basis) for a clear chart pattern breakout signal. A daily close above 4,825 levels will confirm the breakout with a possible price target of 5,800 levels. BELC CO is a borderline breakout.
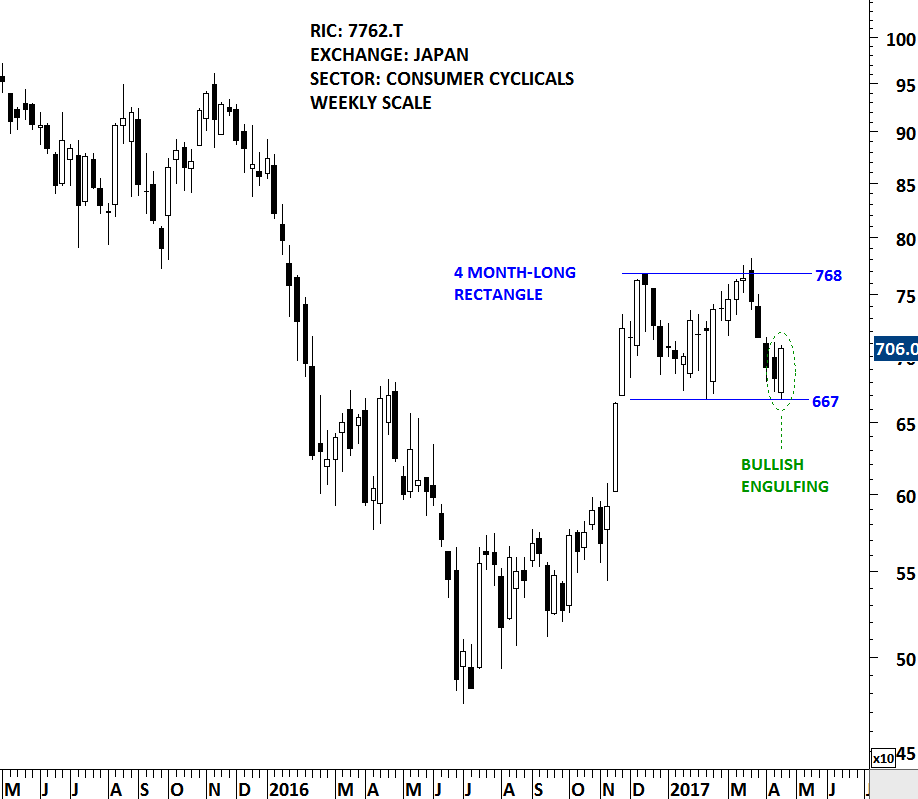
CITIZEN WATCH (7762.T)
Citizen Watch Co., Ltd., formerly Citizen Holdings Co., Ltd., along with subsidiaries and associated companies, operates in five business segments. The Watch segment manufactures and sells watch movements. The Machine Tools segment manufactures and sells numerical control (NC) automatic lathes and others. The Device segment provides light-emitting diode (LED), crystal oscillators, micro displays, glass substrates, switches and automobile parts. The Electronic Machinery segment manufactures and sells printers, healthcare equipment and calculators, among others. The Others segment purchases and sells jewelry products and equipment for ball machines.
The stock is listed on the Tokyo Stock Exchange. The weekly Global Equity Markets update usually feature stocks that are forming clear chart patterns with a possibility of a strong breakout. Citizen Watch can be at the early stages of a possible rectangle continuation chart pattern. While it can still be far from a decisive breakout, this week’s price action is worth the mention. The stock formed a bullish engulfing candlestick pattern at the lower boundary of its possible chart pattern. A bullish engulfing is a pattern that forms when a small black candlestick is followed by a large white candlestick that completely eclipses or “engulfs” the previous day’s/week’s candlestick. As implied in its name, this trend suggests the bulls have taken control of a security’s price movement from the bears. This type of pattern usually accompanies a declining trend in a security, suggesting a low or end to a security’s decline has occurred.
Where a bullish engulfing candle forms in the context of a trend is one of the most important factors. When a bullish engulfing candle forms at the end of a downtrend or at a support level, the reversal is much more powerful as it represents a capitulation bottom. 667 levels is strong support and 768 will be resistance.