GLOBAL EQUITY MARKETS – April 22, 2017
It was a mixed week for Global equity market performance due to each countries own political and geopolitical developments. However, the benchmark for Global equities, the MSCI ALL COUNTRY WORLD INDEX still shows a clear uptrend. MSCI ALL COUNTRIES WORLD INDEX captures large and mid cap representation across 23 Developed Markets and 23 Emerging Markets countries. With 2,481 constituents, the index covers approximately 85% of the global investable equity opportunity set. iShares has an MSCI ACWI ETF that seeks to track the MSCI ALL COUNTRIES WORLD INDEX. The ETF is listed on the Nasdaq Stock Exchange.
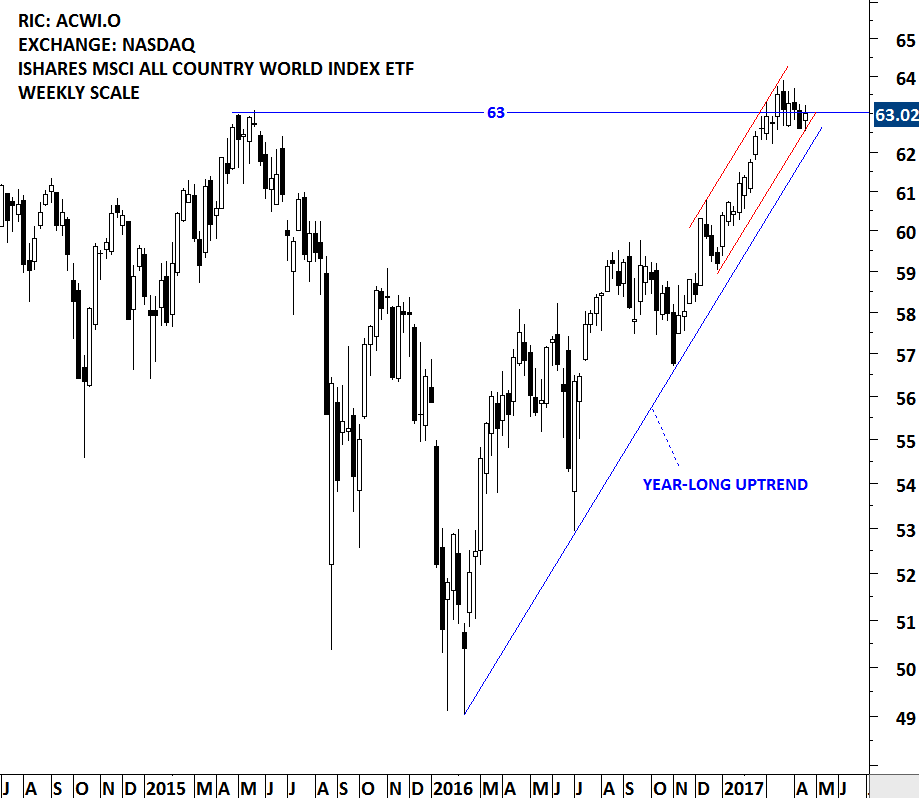
Since the beginning of 2016, MSCI ACWI ETF (ACWI.O) is in a clear uptrend. Over the past two months the price has been challenging the resistance at 63 levels. The continuation of the uptrend will depend on the strength around this resistance level.
iSHARES MSCI ACWI ETF (ACWI.O)

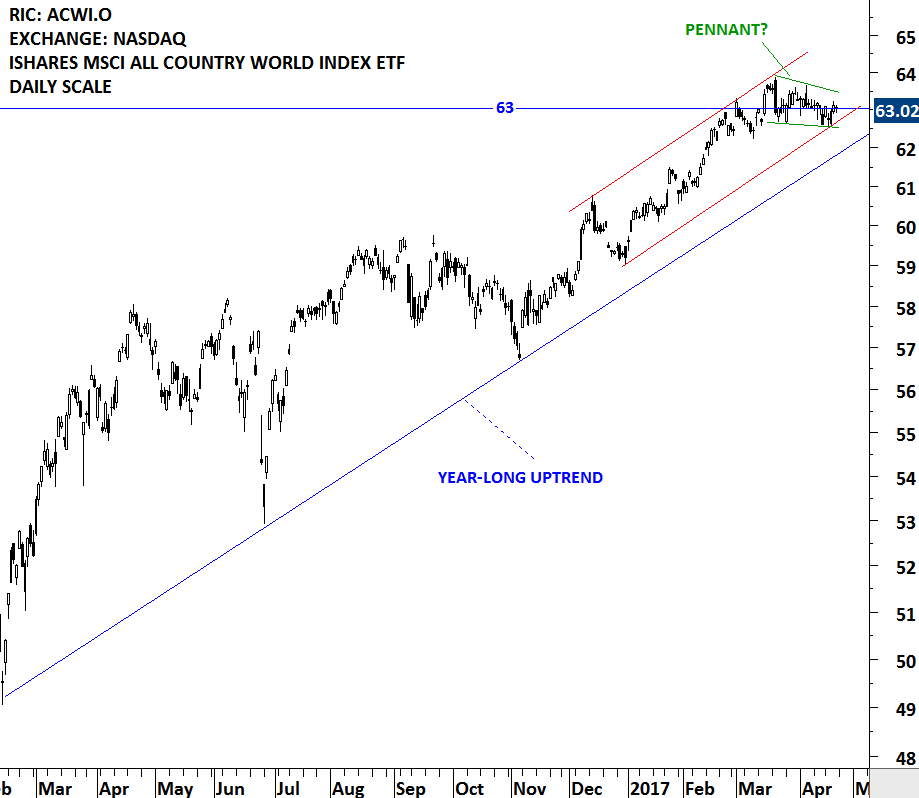
Last one month's price action can be identified as a possible pennant formation. Pennants are short-term continuation patterns that mark a small consolidation before the previous move resumes. Pennants, which are similar to flags in terms of structure, have converging trendlines during their consolidation period and they last from one to three weeks. Breakout above 63 levels can renew upside momentum both on daily and weekly scale. Strong support area remains between 62 and 62.5.

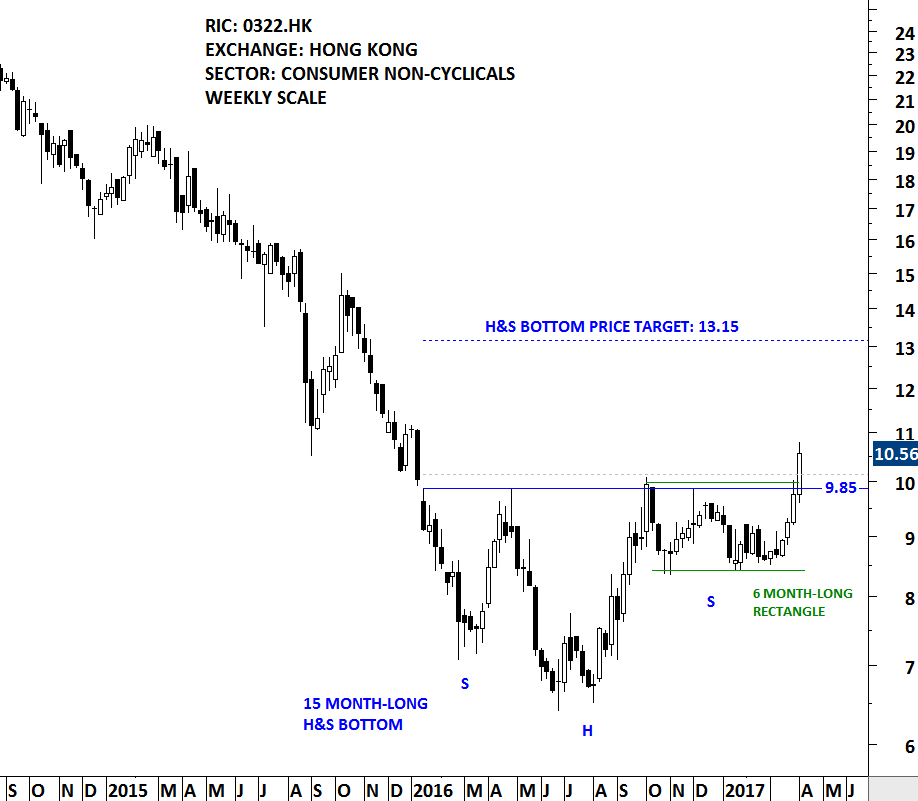
This week there are 3 new chart pattern breakout signals.


