GLOBAL EQUITY MARKETS – May 13, 2017
Reminder: Just one week left until our Founding Member launch on May 22nd!
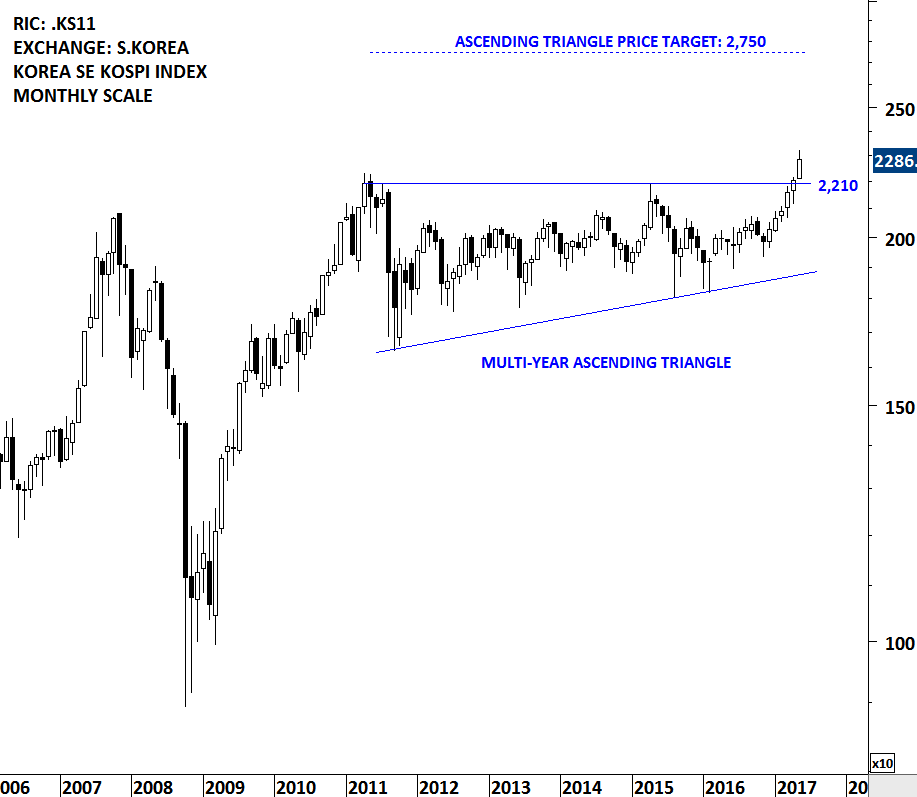
It has been a strong week for equities in emerging Asia and also a strong start for the month of May. South Korea KOSPI index is breaking out to all-time highs by clearing its 6 year-long horizontal resistance at 2,210 levels. The index possibly formed a multi-year long bullish ascending triangle. A strong monthly close will signal positive performance for the coming months. The ascending triangle chart pattern price target stands at 2,750 levels. Emerging Asia is a big component in the MSCI Emerging Markets index. As of May 11, 2017 the top 3 counties in the index are China (26.92%), S.Korea (15.34%) and Taiwan (12.20%).
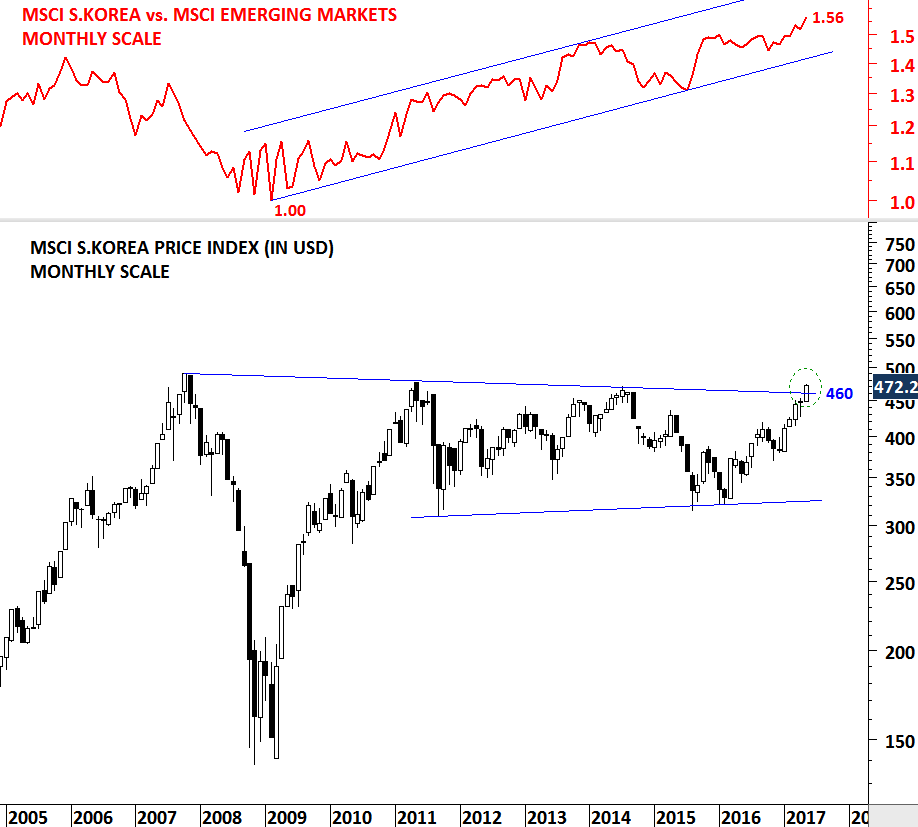
While the local currency stock market index South Korea KOSPI is breaking out to all-time highs, the U.S. Dollar denominated MSCI S.KOREA price index is few percentage points away from reaching new all-time high levels. The price action is clearly positive. The 9 year-long downward sloping trend line is standing at 460 levels. MSCI S.KOREA index is trying to break out of its multi-year sideways consolidation range.
The index (MSCI S.KOREA vs. MSCI EMERGING MARKETS) created by taking the relative performance between the MSCI S.KOREA and the MSCI EMERGING MARKETS shows the strong outperformance by S.KOREA equities since the beginning of 2009. Over the past 8 years, MSCI S.KOREA outperformed the MSCI EM by 56%.
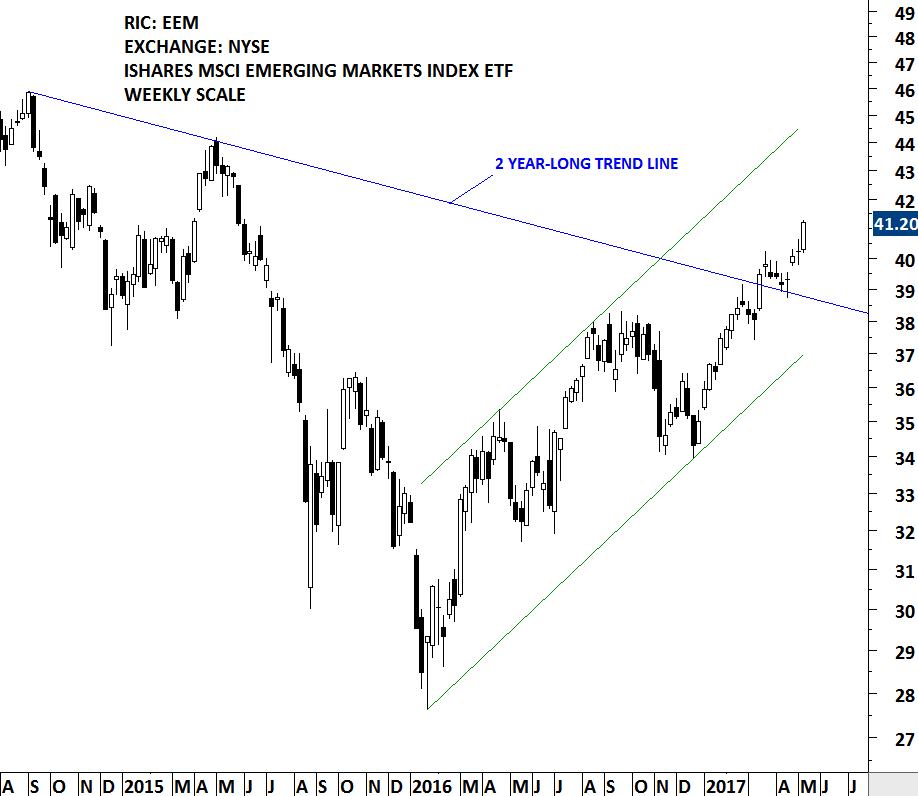
More than 50% of the MSCI EMERGING MARKETS index is allocated to equities in Emerging Asia. Strong performance of the region is helping the index resume its uptrend. In the beginning of April, the index cleared its 2 year-long downtrend and now it is in a steady uptrend.
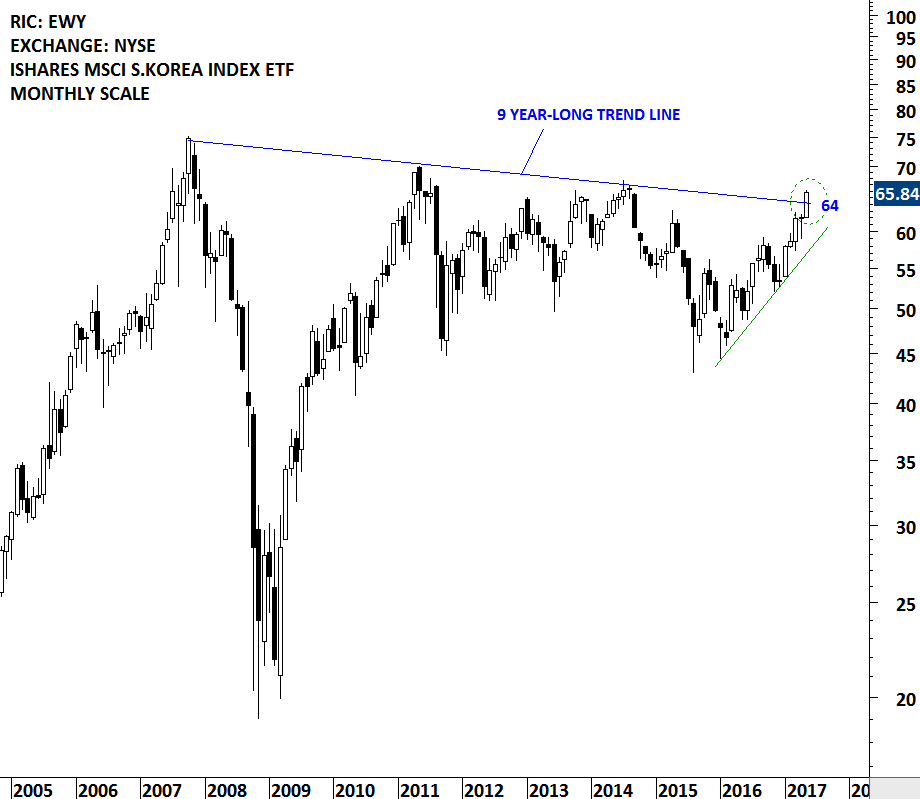
ISHARES MSCI S.KOREA INDEX ETF (EWY) is listed on the New York Stock Exchange. The monthly scale chart shows the 9 year-long trend line acting as resistance at current levels. Confirmed breakout with strong monthly close both on the local currency KOSPI index and the U.S. dollar denominated MSCI S.KOREA index can offer great long-term opportunity.
There are 8 new chart pattern breakout signals during this week.
#TECHCHARTSALERT
3D SYSTEMS CORP. (DDD)
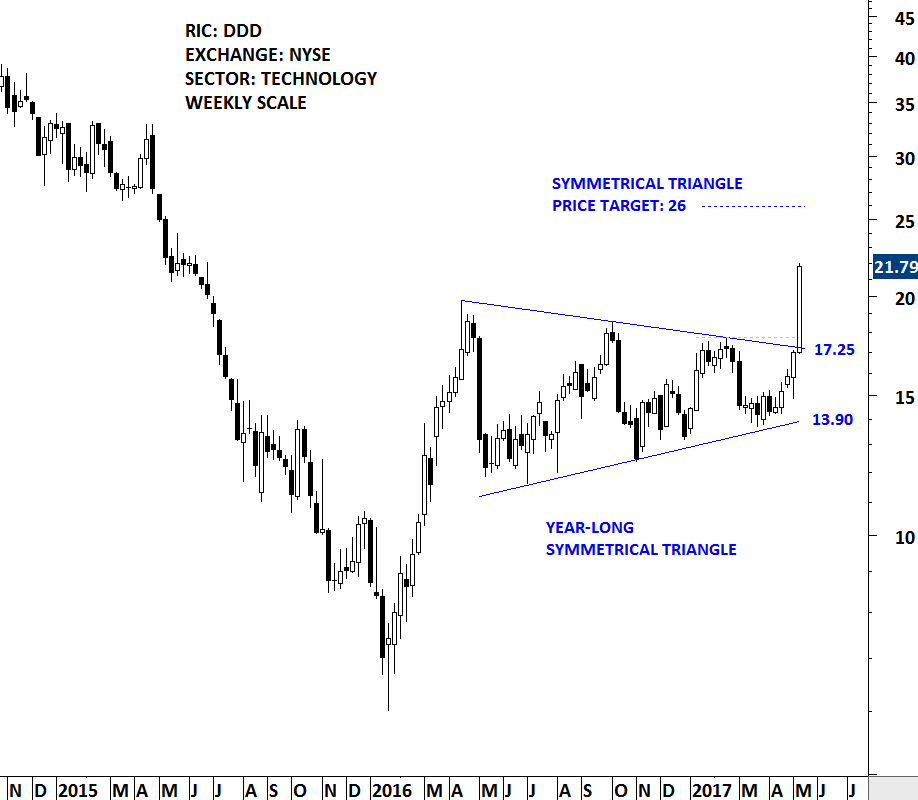
3D Systems Corporation is a holding company. The Company provides three-dimensional (3D) printing solutions, including 3D printers, print materials, software, on demand manufacturing services and digital design tools. Its precision healthcare capabilities include simulation, Virtual Surgical Planning (VSP), and printing of medical and dental devices and surgical guides and instruments. Its solutions support applications in a range of industries, including healthcare, aerospace, automotive and durable goods. The stock is listed on the New York Stock Exchange. Price chart formed a year-long symmetrical triangle with the upper boundary standing at 17.25 levels. The daily close above 17.75 levels confirmed the breakout from the lengthy sideways consolidation with a possible price target of 26 levels. The symmetrical triangle acted as a continuation chart pattern. 3D Ssytems Corp was mentioned in the last week’s report under the watchlist.
AMDOCS LTD. (DOX.O)
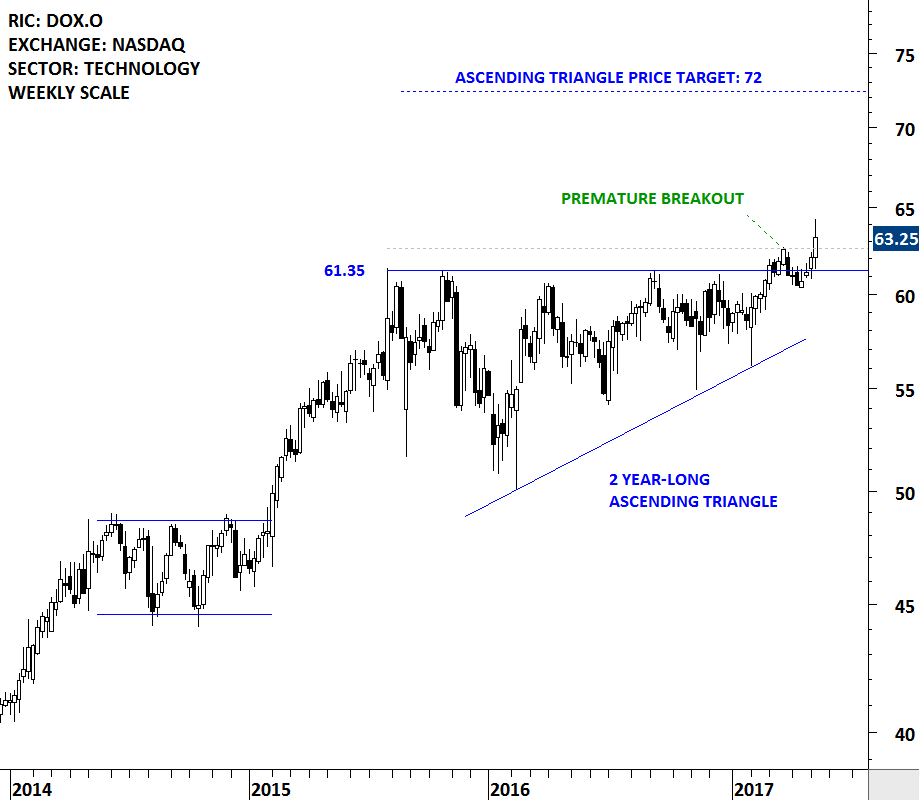
Amdocs Limited is a provider of software and services for communications, entertainment and media industry service providers. The stock is listed on the Nasdaq Stock Exchange. Price chart formed a 2 year-long ascending triangle which is considered to be a bullish continuation chart pattern. Strong horizontal resistance was tested for five times over the course of the chart pattern. Amdocs Ltd. was discussed in the February 25, 2017 report under the watchlist. Since then, the stock had a premature breakout or out of line movement by pushing above the pattern boundary. However, a new chart pattern breakout signal was not triggered. Out of line movements in the direction of the trend give clue about the possible breakout that can take place in the near future. During this week renewed strength resulted in a successful breakout. The daily close above 62.60 levels confirmed the breakout from the multi-year bullish ascending triangle with a possible chart pattern price target of 72 levels.
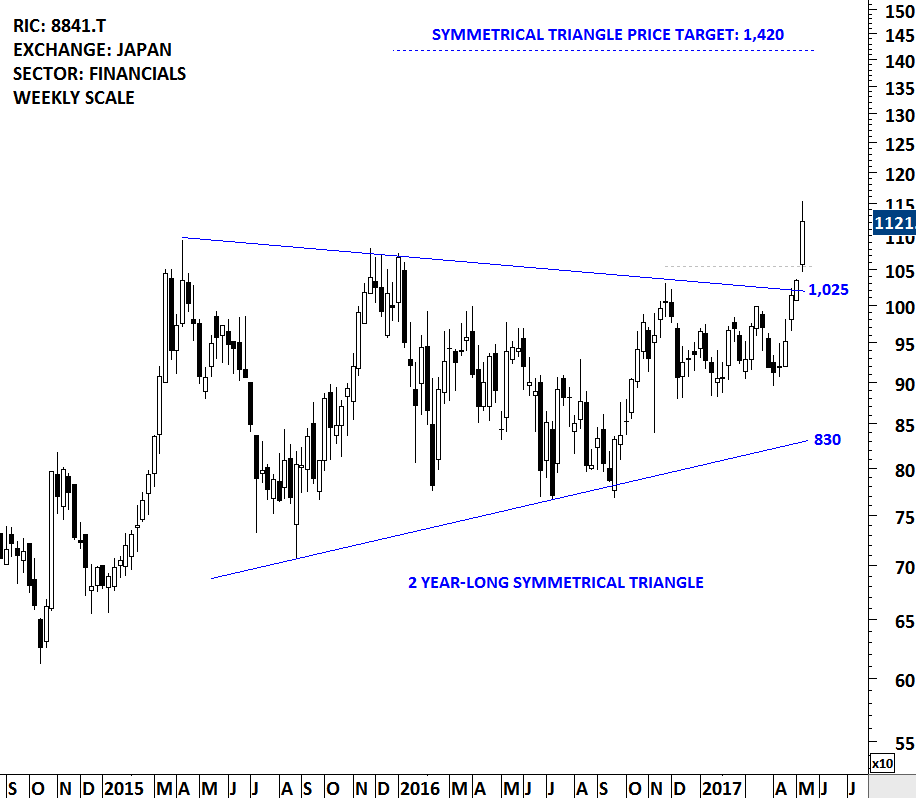
TOC CO LTD. (8841.T)
TOC Co., Ltd. is a Japan-based real estate company engaged in three business segments. The stock is listed on the Tokyo Stock Exchange. Price chart formed a 2 year-long symmetrical triangle. Breakouts from lengthy consolidation periods are usually positive in the long-term. Several tests of the upper boundary suggested that the 2 year-long trend line was an important level for TOC Co. The daily close above 1,055 levels confirmed the breakout from the multi-year consolidation with a possible price target of 1,420 levels. TOC Co. was mentioned in the Global Equity Markets report on April 29, 2017.
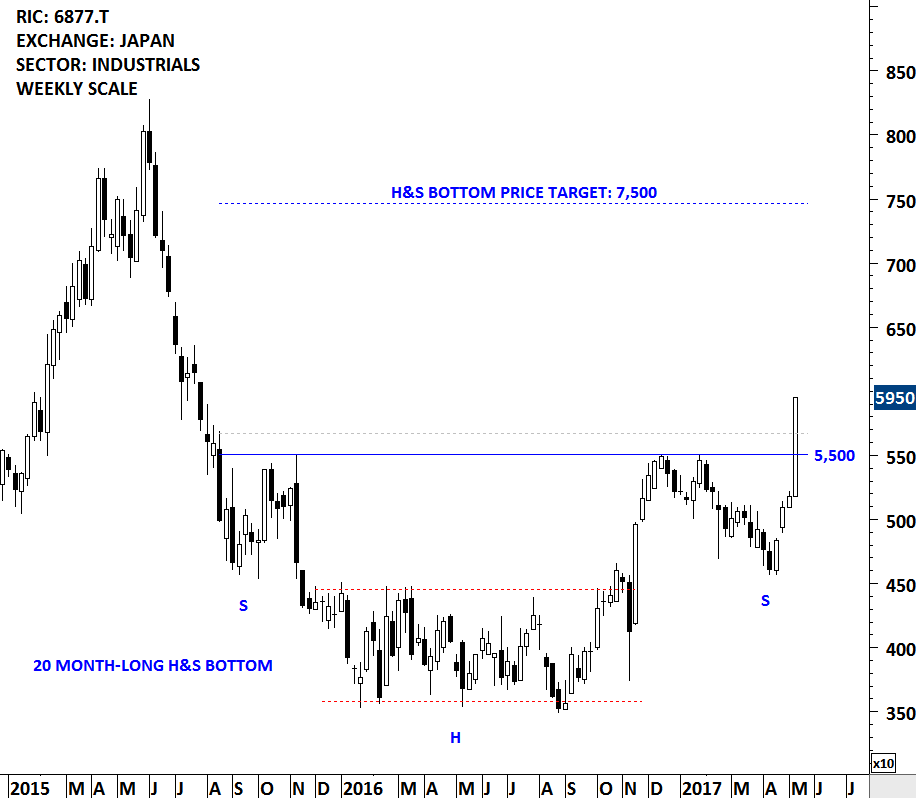
OBARA GROUP INC. (6877.T)
Obara Group Incorporated is a company engaged in the manufacture and sale of welding equipment and flat surface polishing equipment. The stock is listed on the Tokyo Stock Exchange. Price chart formed a massive 20 month-long H&S bottom chart pattern. The daily close above 5,670 levels confirmed the breakout from the bullish reversal chart pattern with a possible price target of 7,500 levels. Breakouts from long-term chart patterns are usually significant as they signal major shift in the direction of the established trend.
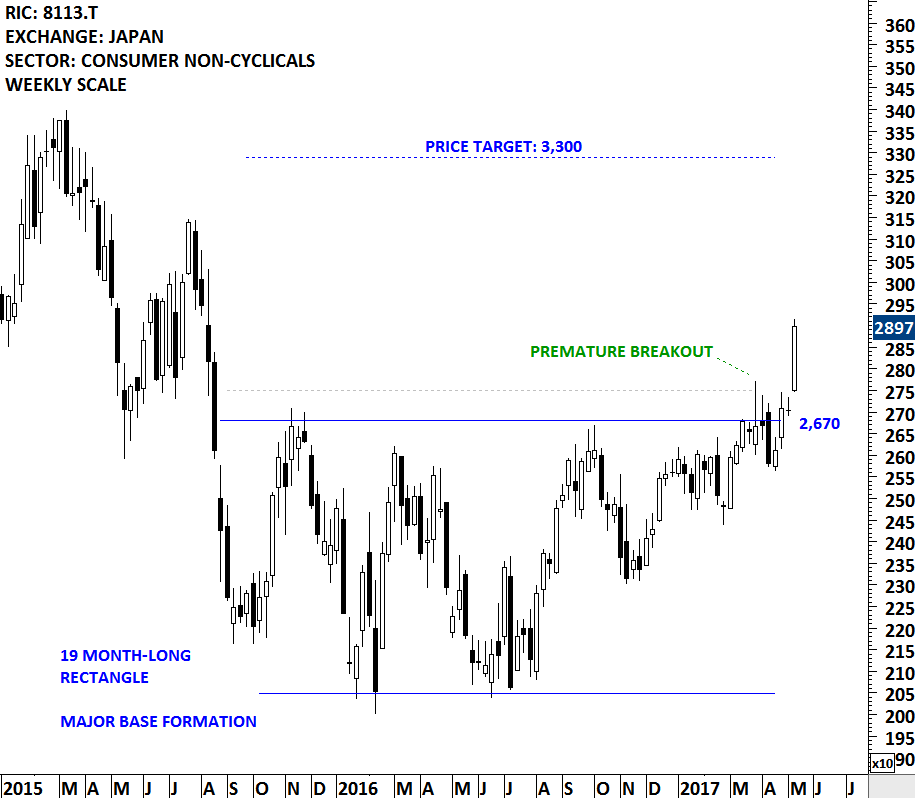
UNICHARM CORP. (8113.T)
UNICHARM CORPORATION is a Japan-based company mainly engaged in the manufacture and sale of baby care products, feminine care products and pet care products. The stock is listed on the Tokyo Stock Exchange. Price chart formed a 19 month-long rectangle base formation, that is possibly acting as a major bottom reversal. Over the past year, the stock recorded higher lows signaling increasing demand. UNICHARM CORP. was mentioned in the Global Equity Markets report on March 18, 2017. Since then the stock had a premature breakout attempt. Over the past few weeks, renewed strength resulted in a decisive breakout from the multi-month base. The daily close above 2,750 levels confirmed the breakout from the 19 month-long base with a possible price target of 3,300 levels.
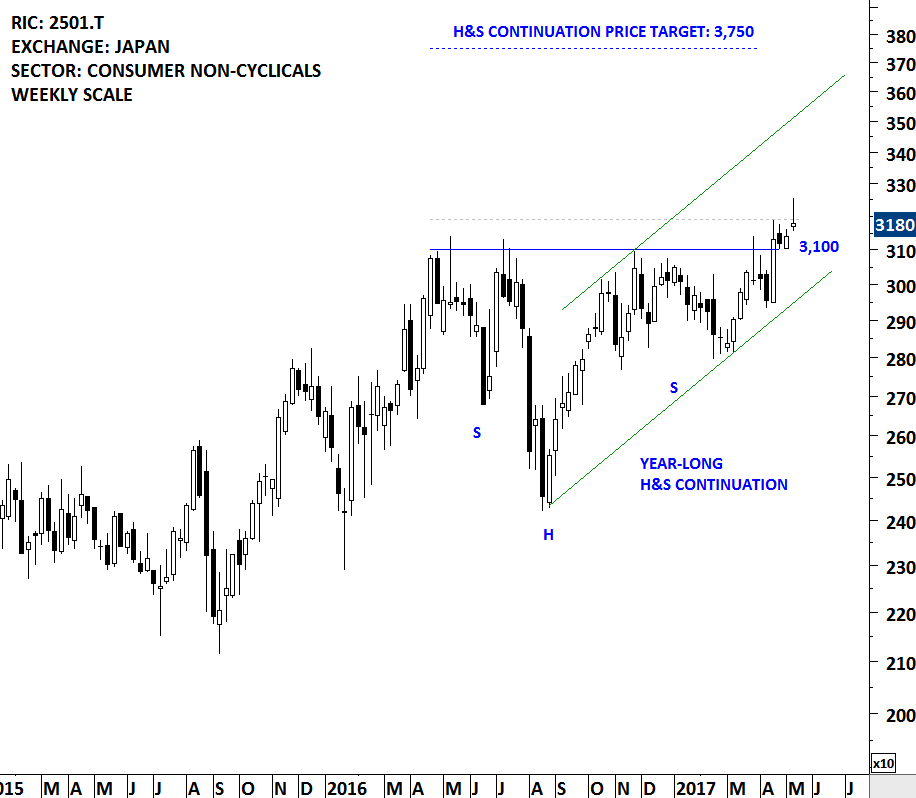
SAPPORO HOLDINGS LTD (2501.T)
SAPPORO HOLDINGS LIMITED is an alcohol manufacturer. The stock is listed on the Tokyo Stock Exchange. Price chart formed a year-long H&S continuation chart pattern with the strong horizontal boundary acting as resistance at 3,100 levels. Over the past year the neckline has been tested for 4 times. The daily close above 3,190 levels confirmed the breakout from the bullish continuation chart pattern with the possible price target of 3,750. SAPPORO HOLDINGS LTD. was mentioned in the Global Equity Markets report on April 1, 2017.
HITACHI TRANSPORT SYSTEM (9086.T)
Hitachi Transport System, Ltd. is engaged in the provision of general logistics services. The Domestic Logistics segment is involved in the operation of domestic system logistics business, the transportation and installation of general cargos, dead weights and art works, the transfer of factories and business offices, the provision of warehousing services, as well as the collection and transportation of industrial waste. The International Logistics segment conducts the global system logistics business, the overseas logistics and air transportation agency businesses. The stock is listed on the Tokyo Stock Exchange. Price chart formed a 4 month-long ascending triangle with the strong horizontal resistance standing at 2,450 levels. The daily close above 2,520 levels confirmed the breakout from the bullish continuation chart pattern with the possible price target of 2,760 levels. Following the breakouts there is a possibility of a pull back. Hitachi Transport Systems is possibly pulling back to the pattern boundary. It is important for the price to hold at or above the chart pattern boundary for a valid chart pattern breakout signal. Hitachi Transport Systems was mentioned in the last week’s report under the watchlist.
![]()
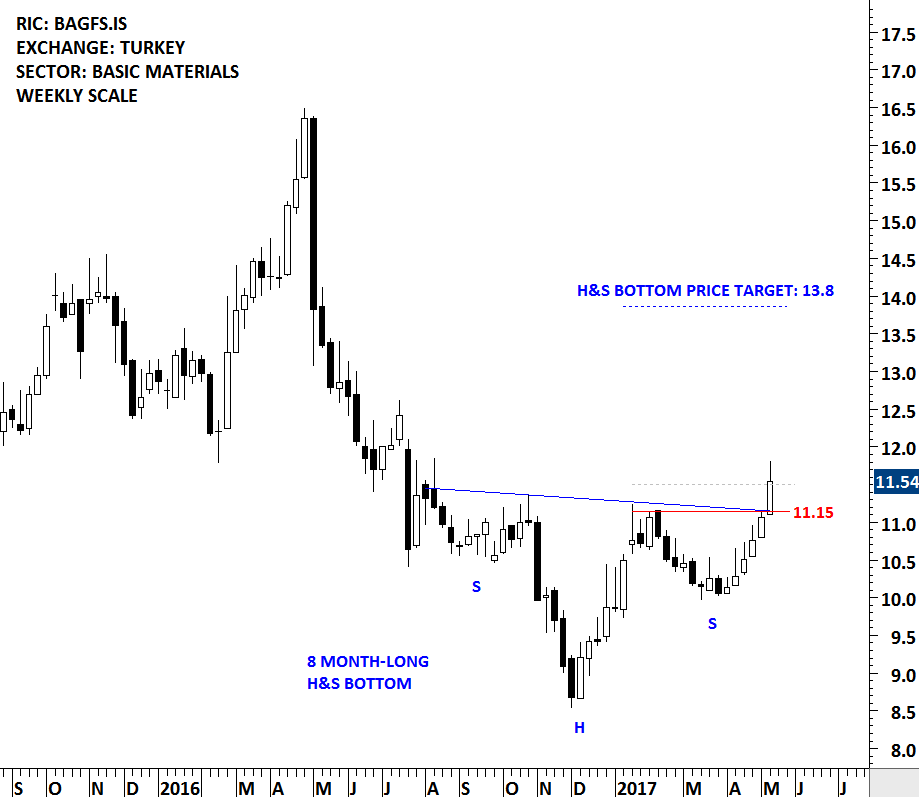
BAGFAS GUBRE FABRIKALARI AS (BAGFS.IS)
Bagfas Bandirma Gubre Fabrikalari AS (Bagfas) is a Turkey-based company engaged in the manufacture, import and export of chemical fertilizers and acids. The stock is listed on the Istanbul Stock Exchange. Price chart formed an 8 month-long H&S bottom with a downward sloping neckline. This week’s breakout cleared both the minor high at 11.15 and the neckline of the H&S bottom. The daily close above 11.50 confirmed the breakout from the multi-month chart pattern with a possible price target of 13.8. Bagfas Bandirma Gubre Fabrikalari was mentioned in the last week’s report under the watchlist.
There are 10 additions to the TECH CHARTS WATCHLIST
#TECHCHARTSWATCHLIST
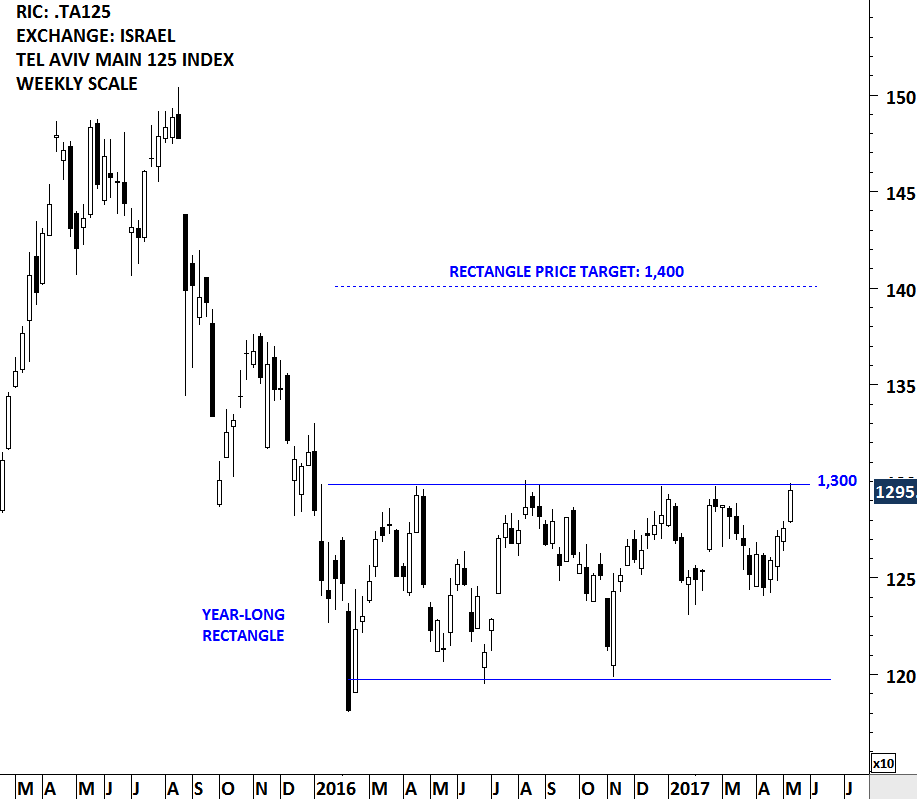
ISRAEL TEL AVIV MAIN 125 INDEX (.TA125)
Widely followed index provider MSCI classifies Israel equities under the Developed Markets. Since the beginning of 2016, Israel’s Tel Aviv Main index has been trading in a range between 1,200 and 1,300 levels. Over the past year the index formed a rectangle chart pattern that can possibly act as a major bottom reversal. Possible chart pattern price target stands at 1,400 levels. The equity benchmark is now testing the strong horizontal resistance for the 6th time. Breakout can result in a major trend reversal and can be positive for equities in Israel.
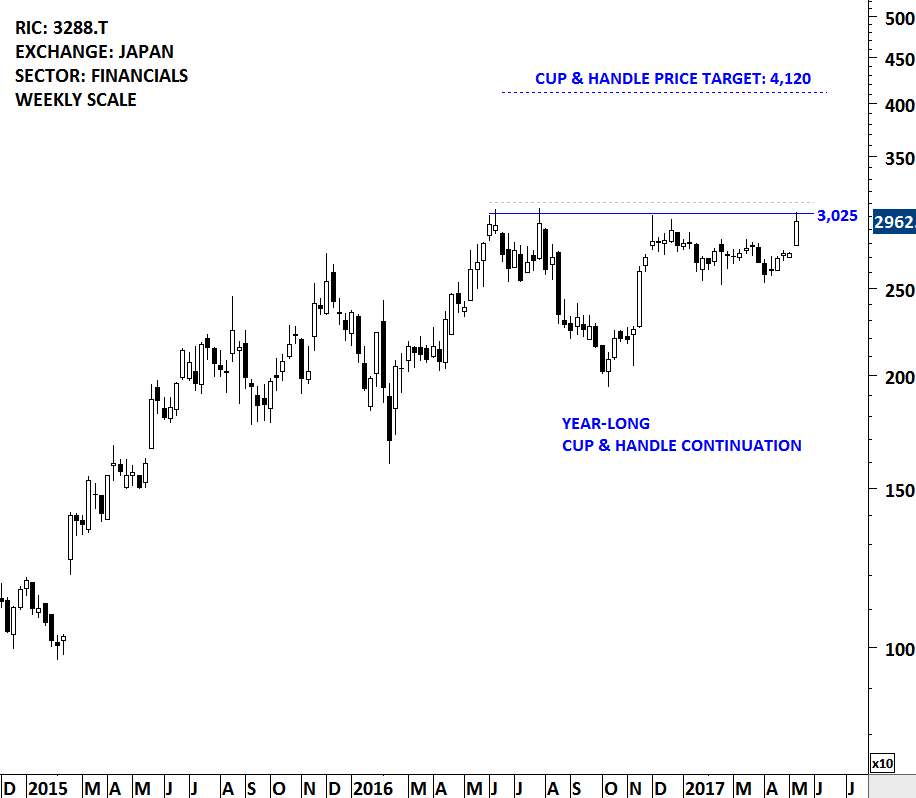
OPEN HOUSE CO LTD. (3288.T)
Open House Co., Ltd. is principally engaged in real estate related businesses. The stock is listed on the Tokyo Stock Exchange. Price chart formed a year-long cup & handle bullish continuation chart pattern with the strong horizontal boundary standing at 3,025 levels. A daily close above 3,110 levels will confirm the breakout from the bullish chart pattern with a possible price target of 4,120 levels. Breakout can push the stock to all-time high levels.
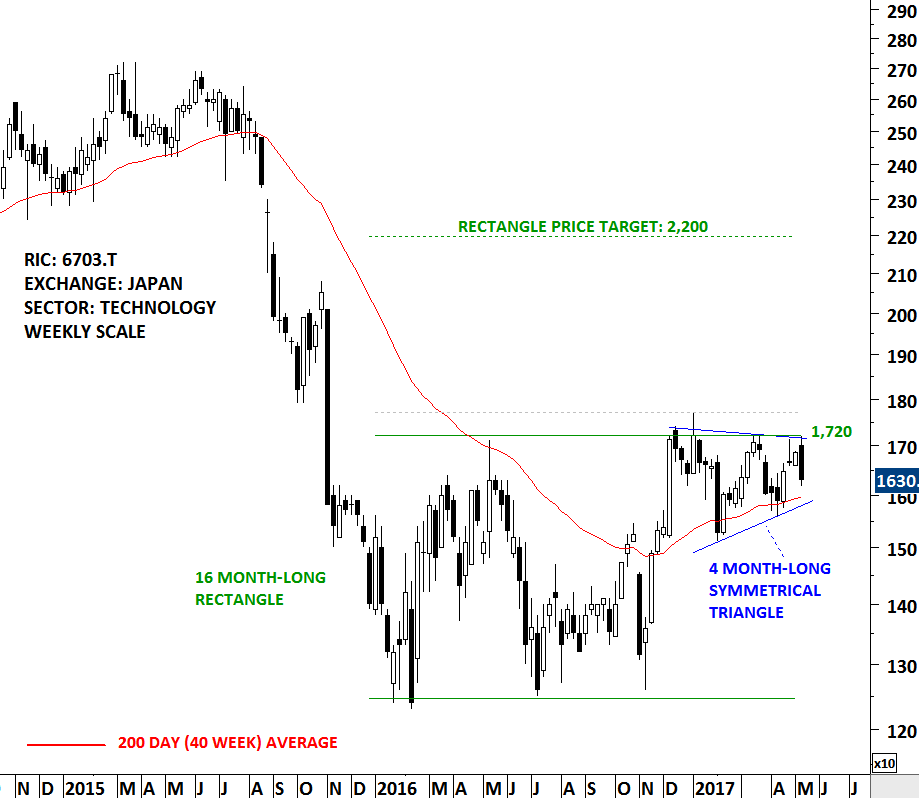
OKI ELECTRIC INDUSTRY (6703.T)
Oki Electric Industry Company, Limited is mainly engaged in the provision of information systems. The stock is listed on the Tokyo Stock Exchange. Price chart possibly formed a 16 month-long rectangle. Last 4 month’s consolidation can be identified as a symmetrical triangle. Both the rectangle and the symmetrical triangle has 1,720 levels as the strong resistance. Breakout from chart patterns that clear two resistances are usually significant. Breakout from the symmetrical triangle can also complete the rectangle chart pattern as a bottom reversal. A daily close above 1,770 levels will confirm the breakout with a possible price target of 2,200 levels.
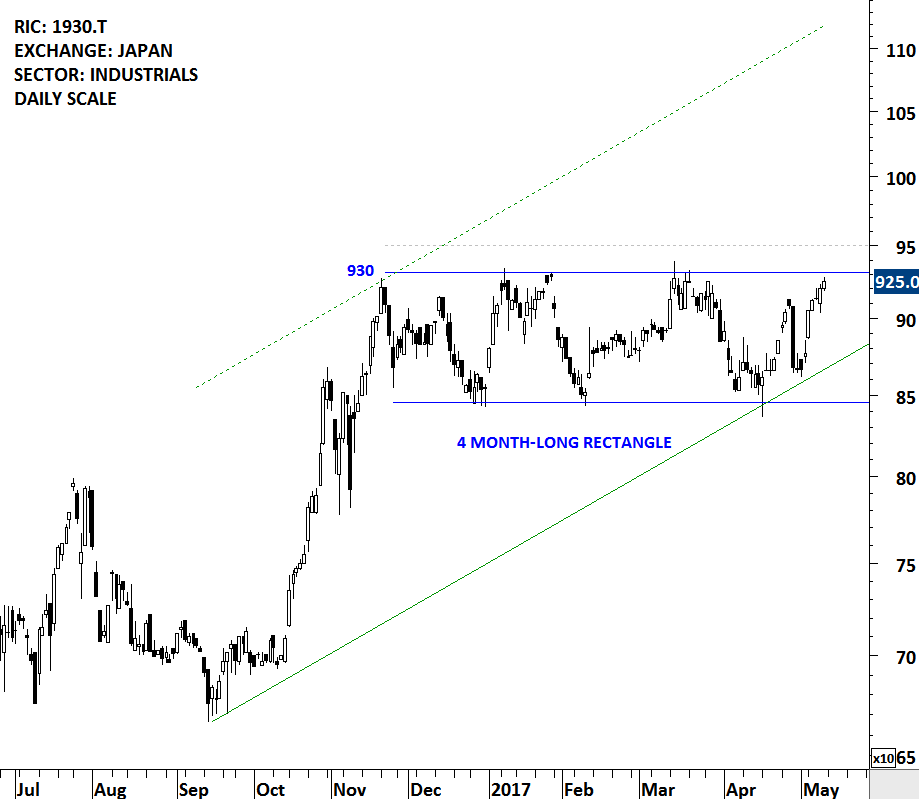
HOKURIKU ELECTRICAL CONSTRUCTION (1930.T)
HOKURIKU ELECTRICAL CONSTRUCTION CO., LTD. is a Japan-based company mainly engaged in the facilities construction business. The stock is a small-cap company listed on the Tokyo Stock Exchange. Price chart formed a 4 month-long rectangle with the strong horizontal boundary standing at 930 levels. Rectangles in an uptrend is usually classified as a continuation chart pattern. A daily close above 950 levels will confirm the breakout.
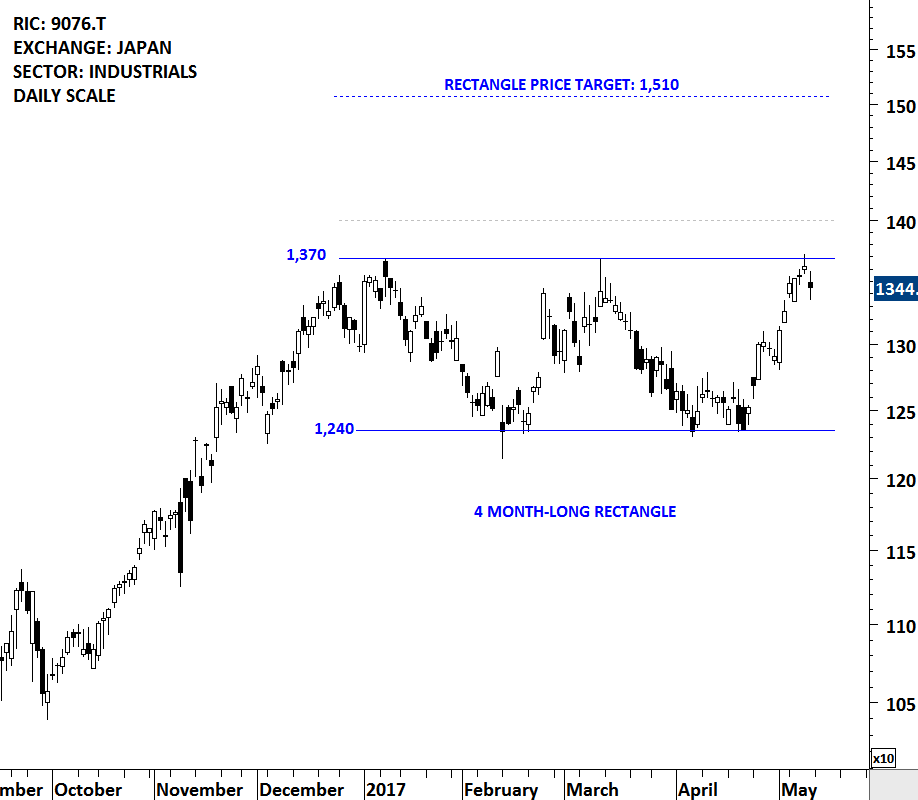
SEINO HOLDINGS CO (9076.T)
SEINO HOLDINGS CO., LTD. is a Japan-based company mainly engaged in the logistics business. The stock is listed on the Tokyo Stock Exchange. Price chart formed a 4 month-long rectangle with the horizontal resistance standing at 1,370 levels. A daily close above 1,400 levels will confirm the breakout from the bullish continuation chart pattern with the possible price target of 1,510 levels. Rectangles are usually continuation chart patterns and form as a pause in a steady uptrend.
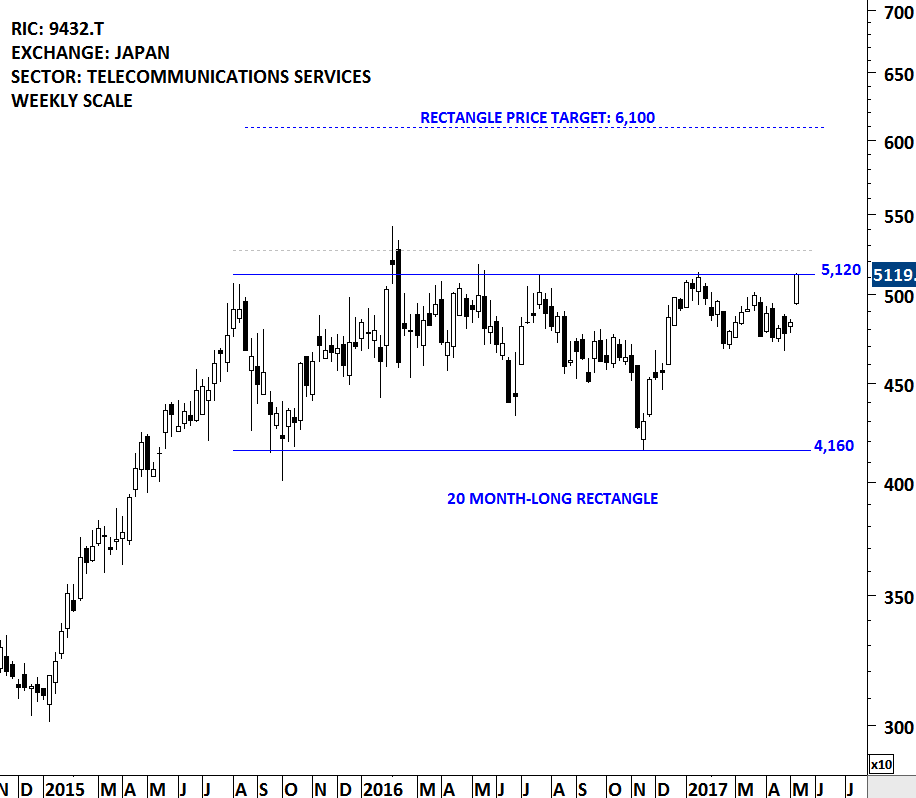
NIPPON TELEGRAPH & TELEPHONE CORP. (9432.T)
Nippon Telegraph and Telephone Corporation (NTT) is a provider of fixed and mobile voice related services, Internet Protocol (IP)/packet communications services, telecommunications equipment, system integration and other telecommunications-related services in Japan. The stock is listed on the Tokyo Stock Exchange. Price chart formed a 20 month-long rectangle with the strong horizontal resistance standing at 5,120 levels. A daily close above 5,270 levels will confirm the breakout with a possible price target of 6,100 levels. This week’s price action pushed the stock to the boundary of the multi-month rectangle.
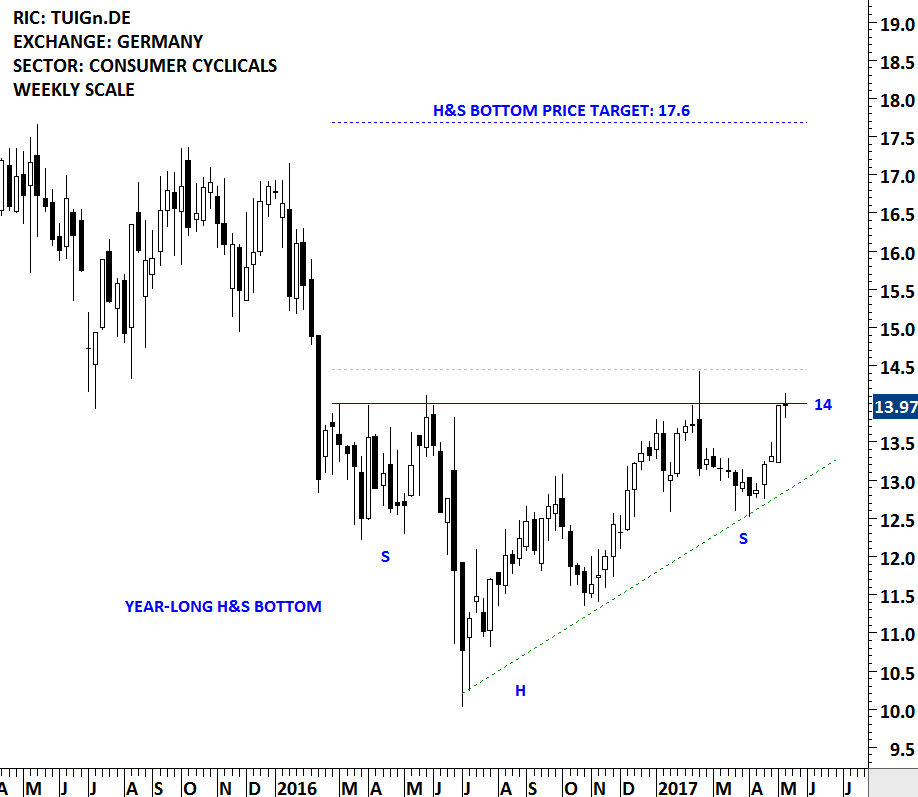
TUI AG (TUIGn.DE)
TUI AG is a Germany-based integrated tourism group that operates through five segments: Central Region, Western Region, Hotels and Resorts, Cruises and Other Tourism. The stock is listed on the Germany’s XETRA. Price chart formed a year-long H&S bottom with the strong horizontal resistance standing at 14 levels. H&S bottoms are bullish reversal chart patterns. Completion of a H&S bottom can reverse the downtrend. A daily close above 14.45 levels will confirm the breakout from the bullish reversal chart pattern with a possible price target of 17.6 levels.
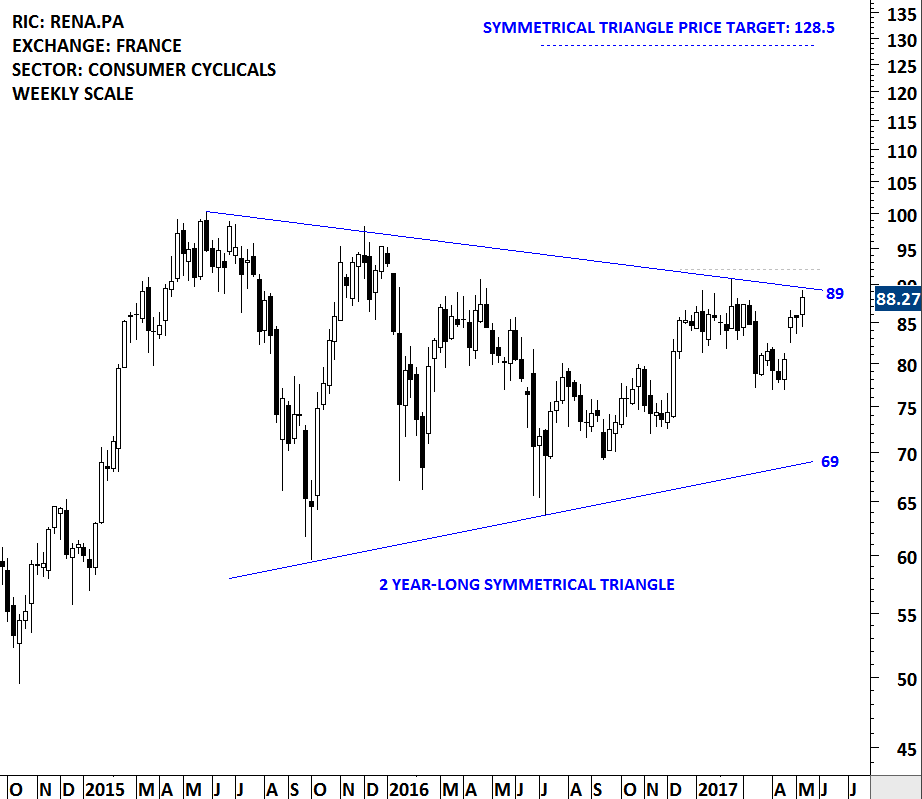
RENAULT SA (RENA.PA)
Renault SA is a France based company primarily engaged in the manufacture of automobiles and the provision of related services. The stock is listed on the Paris Stock Exchange. Price chart formed a 2 year-long symmetrical triangle with the upper boundary standing as resistance at 89 levels. TOC Co. which is completing its chart pattern with a strong breakout had a similar setup. Breakout on Japan’s TOC Co. is discussed in the alerts section of this report. Similar chart patterns can develop in different markets, sectors and time frames. A daily close above 92 levels will confirm the breakout from the 2 year-long symmetrical triangle with the possible price target of 128.5 levels.
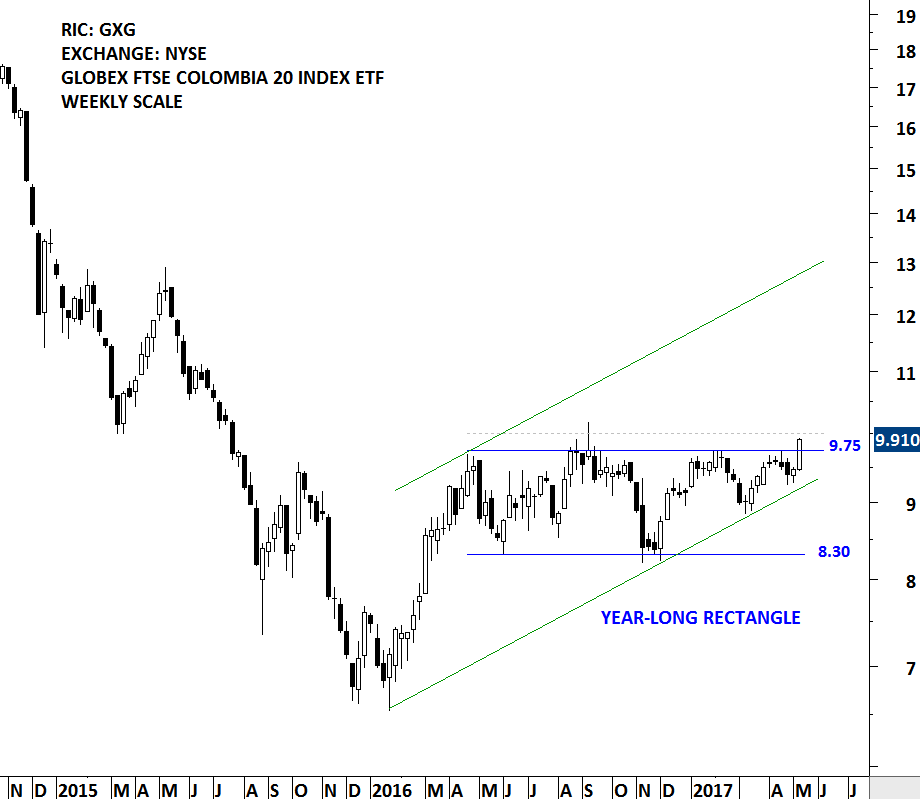
GLOBAL X MSCI COLOMBIA ETF (GXG)
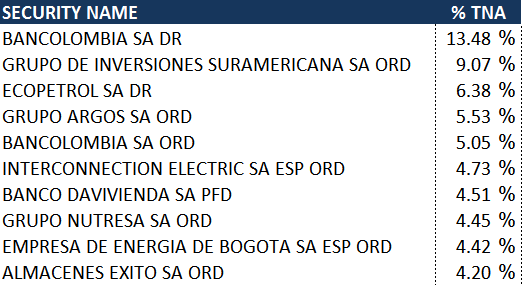
Global X MSCI Colombia ETF is an exchange traded fund that seeks to provide investment results that correspond generally to the price and yield performance of the Colombia Index. The Colombia Index is free float adjusted, liquidity tested and market capitalization-weighted index that is designed to measure equity market performance in Colombia. The ETF is listed on the New York Stock Exchange. Price chart formed a year-long rectangle with the strong horizontal resistance standing at 9.75 levels. This week’s price action closed above the pattern boundary. Edwards and Magee in their book Technical Analysis of Stock Trends suggest that a stock should breakout or breakdown by a 3% margin above or below the resistance/support (on a daily closing basis) for a clear chart pattern breakout signal. A daily close above 10 levels will confirm the breakout from the year-long rectangle continuation chart pattern. As of 30 April 2017 the top 10 holdings in the Global X MSCI Colombia ETF can be seen in the table below.
Global X MSCI Colombia ETF top 10 holdings (As of 30 April 2017)
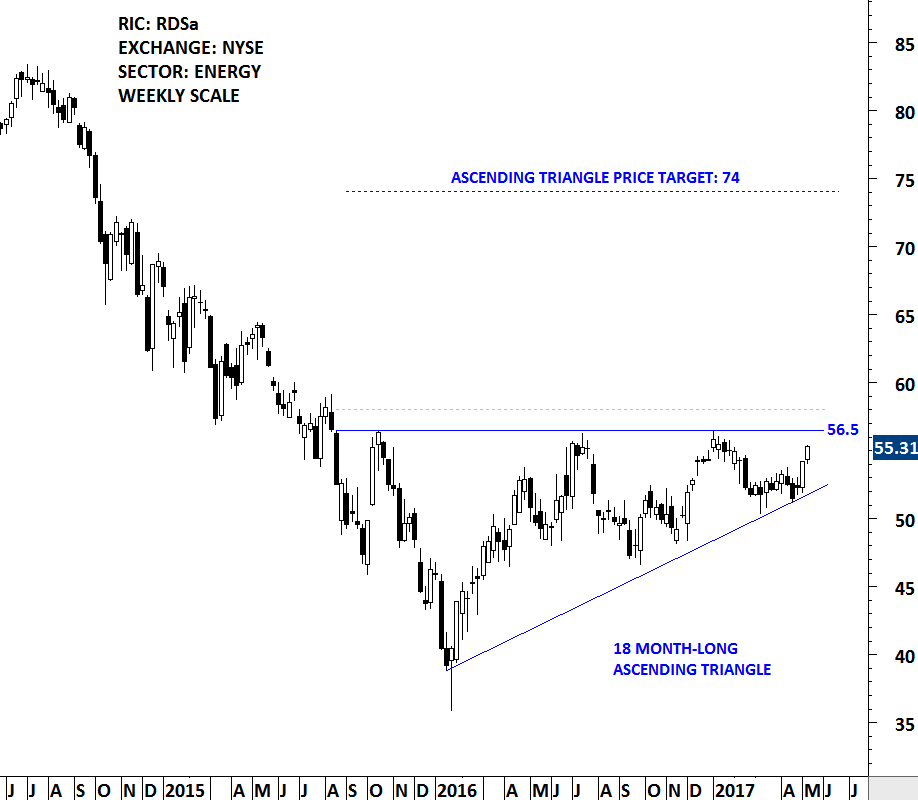
ROYAL DUTCH SHELL PLC (RDSa)
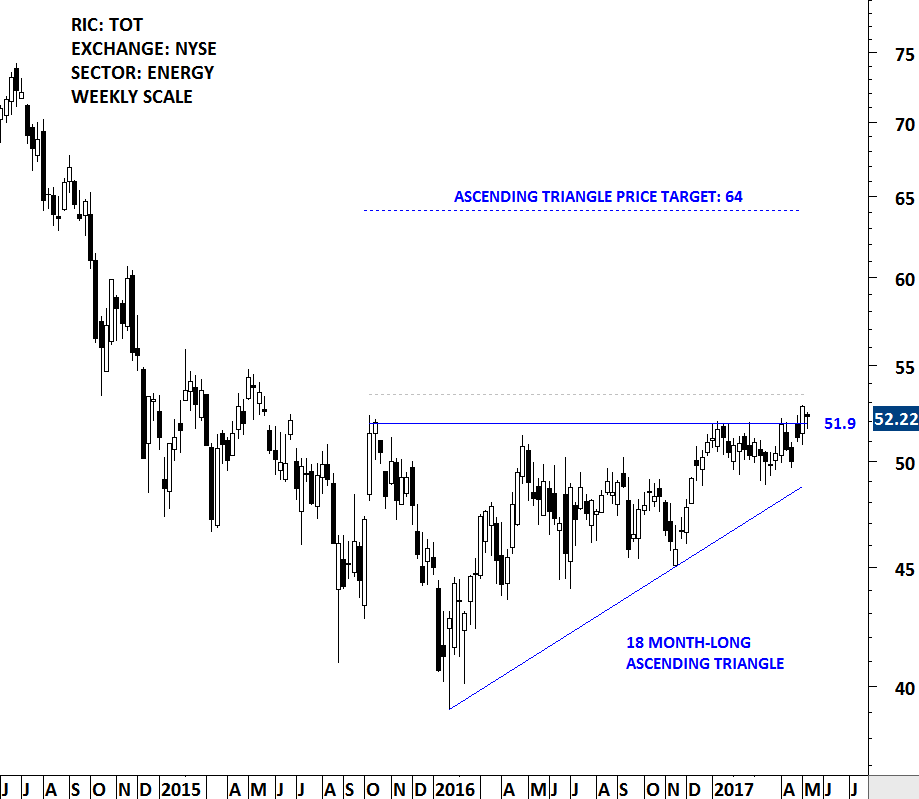
The Royal Dutch Shell plc explores for crude oil and natural gas around the world, both in conventional fields and from sources, such as tight rock, shale and coal formations. The stock is listed in European exchanges as well as the New York Stock Exchange. The chart below shows the New York Stock Exchange listing. Price chart formed an 18 month-long ascending triangle with the strong horizontal resistance standing at 56.5 levels. Ascending triangle is a bullish continuation chart pattern. It can act as a bottom reversal after lengthy downtrends. A daily close above 58 levels will confirm the breakout from the multi-month base formation with a possible price target of 74 levels. Royal Dutch might be at the early stages of a possible breakout. However, it is important to keep an eye on the energy sector equities. Similar bullish reversal chart patterns are developing in different securities. The following chart shows TOTAL that was discussed in the Global Equity Markets April 8, 2017 report. TOTAL has a similar chart set-up and is now close to generating a new chart pattern breakout signal.