Video Tutorial – Long Term Charts
Our Founding Membership launch is now OPEN!
For a 10-day period only, take advantage of our very low Founding Membership rate (locked for life) and join me on this new chapter. See https://blog.techcharts.net for more details.
Long Term Charts – Video Tutorial
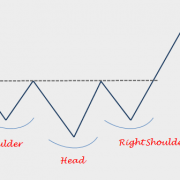
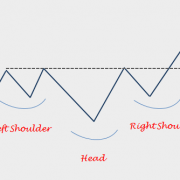
Richard W. Schabacker discussed the importance of chart patterns in the averages, in his book Technical Analysis and Stock Market Profits. He concluded that if many individual issues were to make strong Head and Shoulders formations at exactly the same time, the average chart would, obviously, show a similar Head and Shoulders. However, since the many different stocks do not, as a rule, make their ‘‘peaks and valleys’’ on precisely the same days, the average chart is likely to show a less specialized and distinct pattern. We should, for this reason, expect the averages to show Common or Rounding Turns more often than do the charts of individual issues at times of important reversals.
Most stocks sooner or later will follow the major swings of the market. Individual stocks in a sector or industry group might form similar chart patterns due to economic cycles or sector rotation. These individual stocks can be affected by other factors such as commodity prices.
One should stay alert and start anticipating a major shift in the direction of the trend after finding similar chart patterns developing in a specific sector or industry group. It is important to note that these chart patterns are usually well-defined on the individual stocks when compared with the chart patterns on the averages.
The video tutorial discusses what can be next for the European banks by giving examples from the two major trading themes in energy sector equities and mining companies.
Regards,
Aksel Kibar


