MSCI ALL COUNTRIES WORLD INDEX
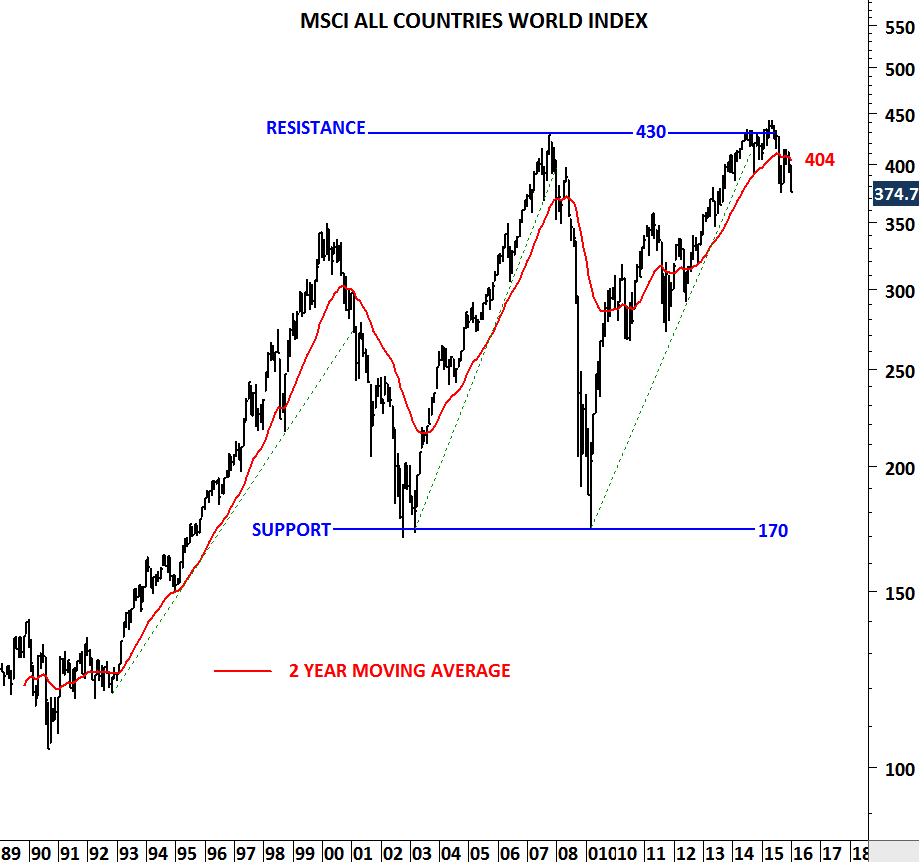
2016 started with negative performance for global equities. And weak performance can continue in the coming months. Sharp sell-off in Chinese equities mainly driven by a devaluation of the Chinese yuan, resulted in a broad market weakness. Sharp price action is making the headlines as it is one of the few bad starts for the new year in several decades. However, since April 2015 charts have been showing market weakness. (Earlier updates on MSCI ALL COUNTRIES WORLD INDEX here)
Weakness can be seen from the MSCI ALL COUNTRIES WORLD INDEX failing to breakout to new high levels in April 2015. Global equities experienced the first sharp sell-off in August 2015. Last quarter of 2015 was a reaction to August sell-off. Now, it seems like the downward momentum is picking up steam. Index is below its long-term average once again. Breakdown below the September low at 374, can send the index towards 300-350 area. MSCI All Countries World Index captures large and mid cap representation across 23 Developed Markets and 23 Emerging Markets countries. (For more information on MSCI indices) With 2,491 constituents, the index covers approximately 85% of the global investable equity opportunity set.
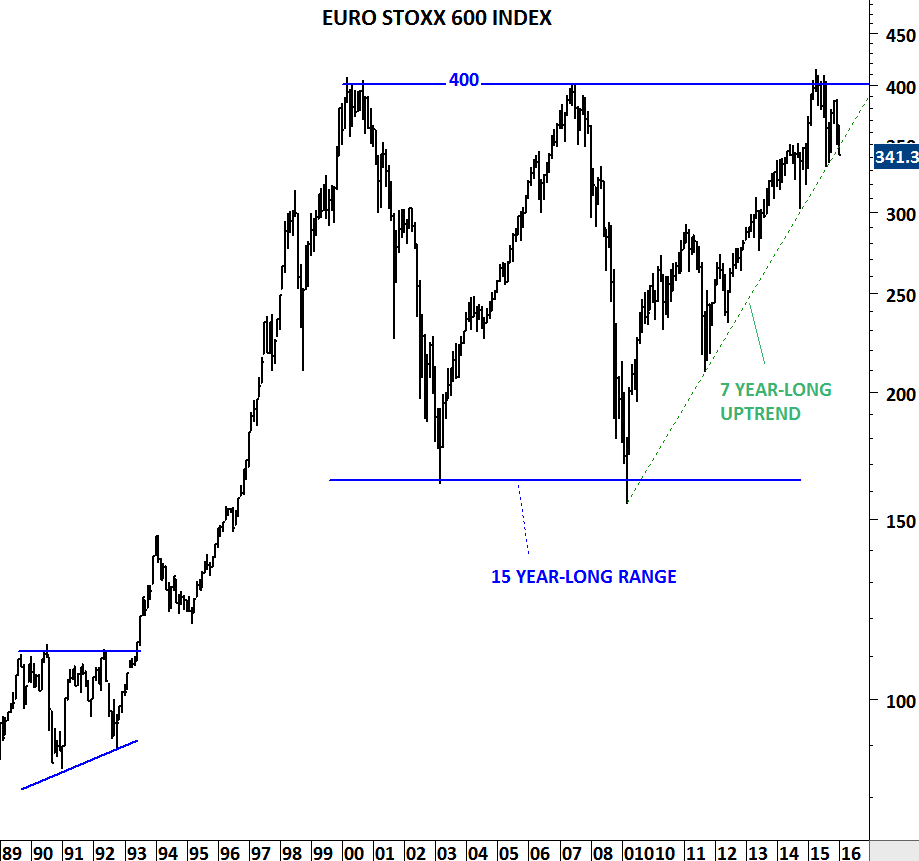
Europe’s STOXX 600 index has similar deteriorating outlook with the index now testing a 7 year-long trend line support. In April 2015 STOXX 600 reversed from 400 levels for the third time since 2000. Failure to clear 400 during its 3rd test suggests supply is overcoming the demand every time index tests 400 levels. If we see Euro Stoxx 600 breaking down its long-term trend line support, we will expect a larger scale correction towards 300 levels.
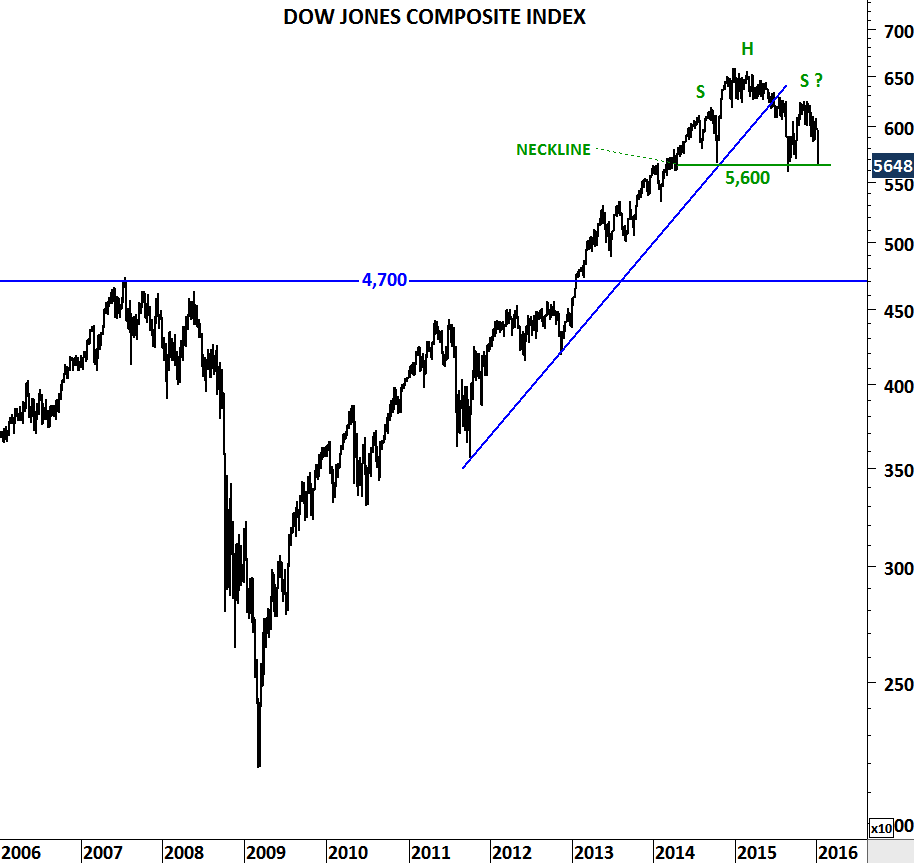
Dow Jones Composite index that measures changes within the 65 companies that make up three Dow Jones averages: the 30 stocks that form the Dow Jones Industrial Average (DJIA), the 20 stocks that make up the Dow Jones Transportation Average (DJTA) and the 15 stocks of the Dow Jones Utility Average (DJUA), is also showing weakness with a classic bearish chart pattern; Head and Shoulder Top. Support level for the index is at 5,600 levels. Breakdown below 5,600 can send the Dow Jones Composite Index towards 4,700-5,000 area. (For more information on Head and Shoulder Top chart pattern)