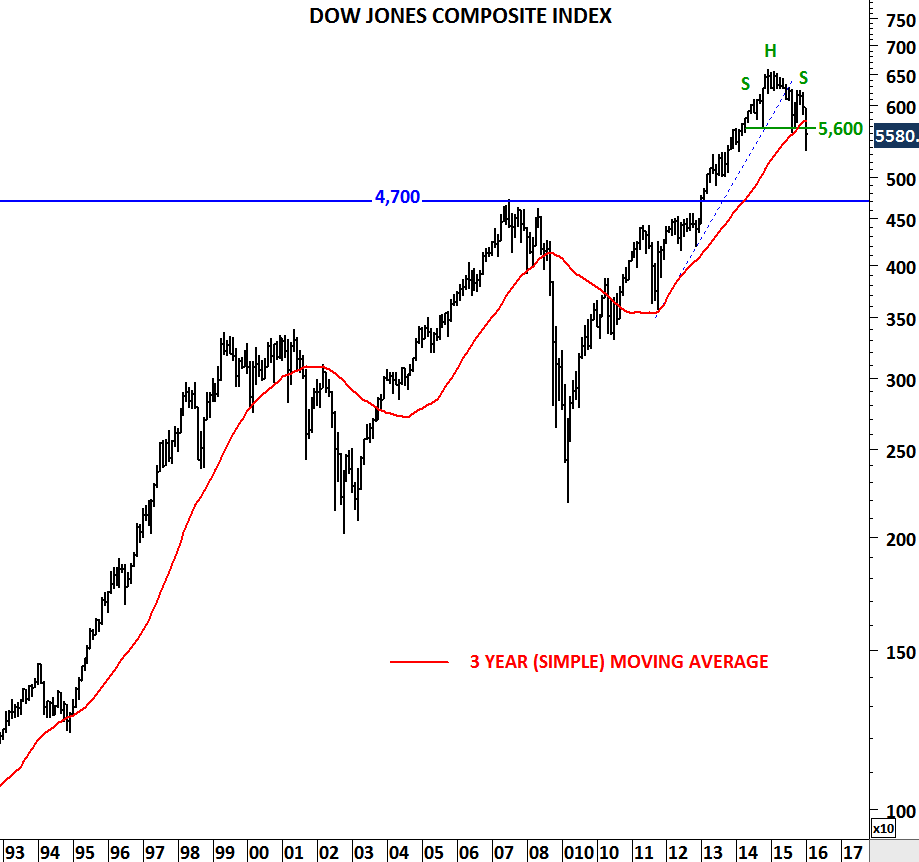
MSCI ACWI, EUROSTOXX and DOW JONES
Volatility increased in the global equity markets. Last week of January will be important as we get closer to the end of the month. Why the last week of January is important? After the sharp sell-off equities are now trying to rebound. Another week of strength will result in a “close” at the higher end of monthly bars. This is the case for almost all the indices analyzed below. However, a flat or weak market action in the last week of the month will result in a “close” at the lower end of the monthly bars. A long monthly bar with a close at the lower end will confirm sellers willingness to push the markets lower. When there is an increase in volatility, it is always better to step back and look at charts with long-term focus. Preferably one or two higher degree than your usual template. This is one of the reason I’m paying close attention to monthly charts. Daily price movements can be considered “noise” in such highly volatile trading.
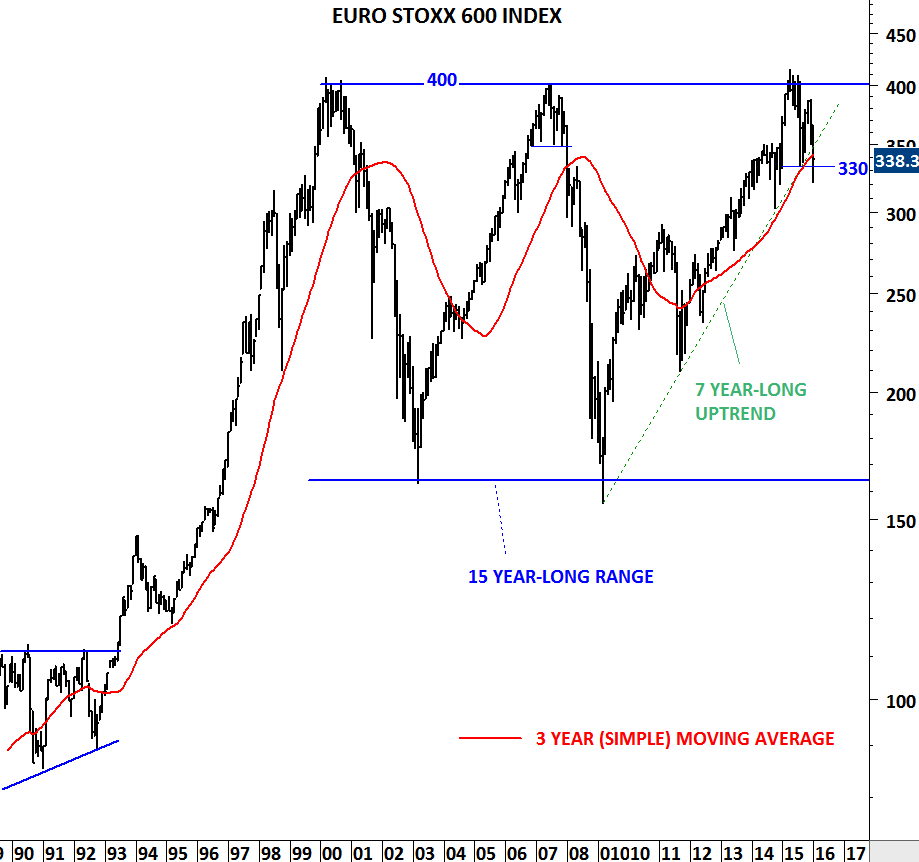
If EURO STOXX 600 manages to push above 350 levels, an immediate correction will be negated. However, a weak monthly close below August 2015 low (330) will suggest weakness for the coming months.
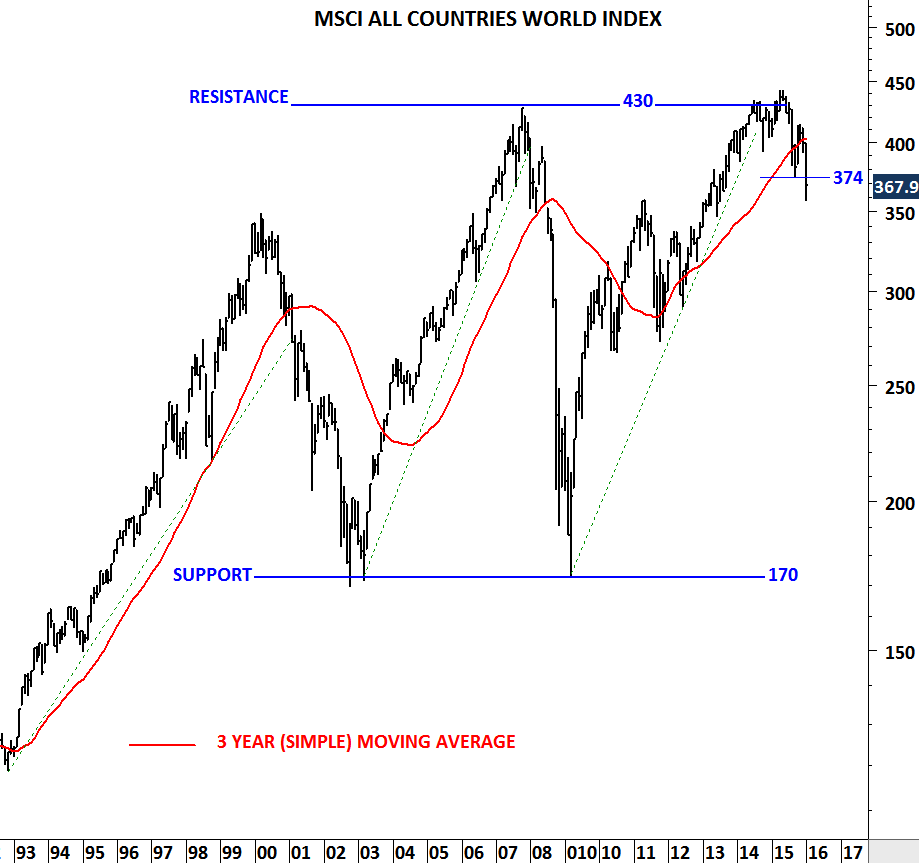
MSCI ALL COUNTRIES WORLD INDEX has similar technical outlook. Failure to push above August 2015 low at 374 levels will result in further weakness in the coming months. In order to compare all charts in this update, I added the 3 year simple moving average. You can pick different periods for the long-term average. Having a long-term filter on a chart is better than not having at all. When price is below the long-term average one should be more alert on the possibility of continued correction. In this case it is important to note that price is below several long-term averages.