
S&P 500 INDEX and VIX
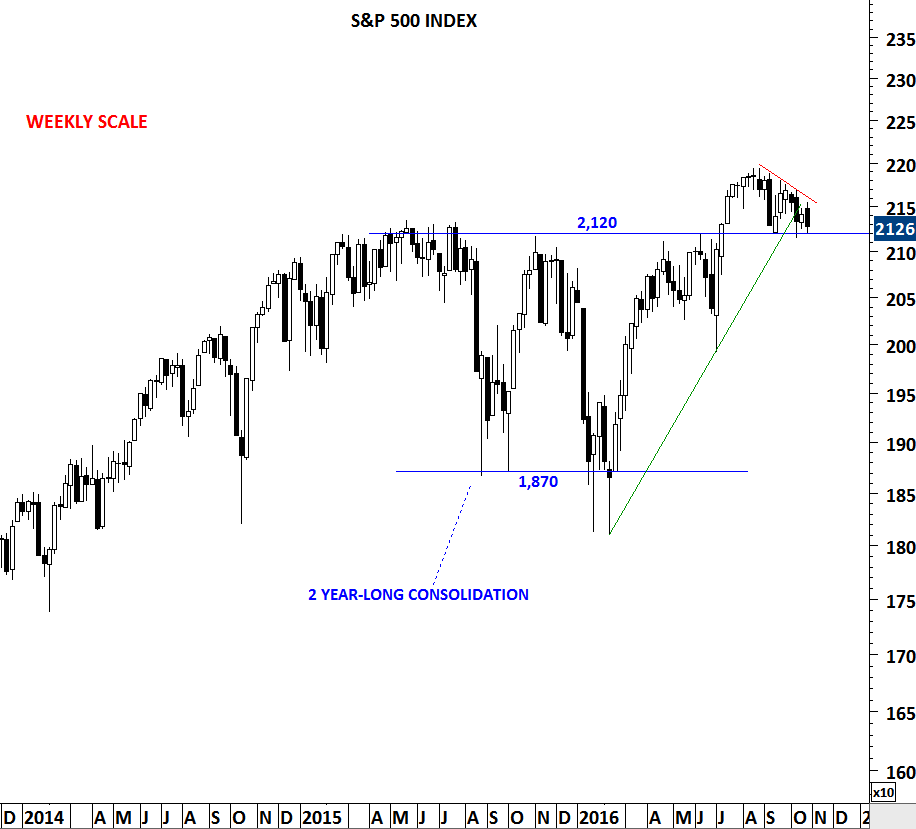
S&P 500 INDEX weekly scale price chart
S&P 500 index is resting on the 2 year-long support/resistance level. Breakout to all time highs in July 2016 was followed by a weak rally in July-August period. Since mid-August the index has been in a sideways consolidation. The pull-back reached the previously broken resistance at 2,120 levels. Price action in the September-October period can be identified as a descending triangle with the horizontal boundary (support) standing at 2,120 levels. Over the past two months the S&P 500 index tested the strong support for 3 times. Breakdown below 2,120 levels will signal further correction for the U.S. Equities.
CBOE Volatility index is consolidating between 13 and 17 levels. Breakdown below 2,120 on the S&P 500 index could also result in a breakout on the VIX. The level to watch on the CBOE VIX is 17.35. If S&P 500 index manages to hold above 2,120 levels, last two months sideways consolidation will be labelled as a pull back and we will expect new highs in the coming months. In that case 17-18 area should become a medium term high for the CBOE VIX.
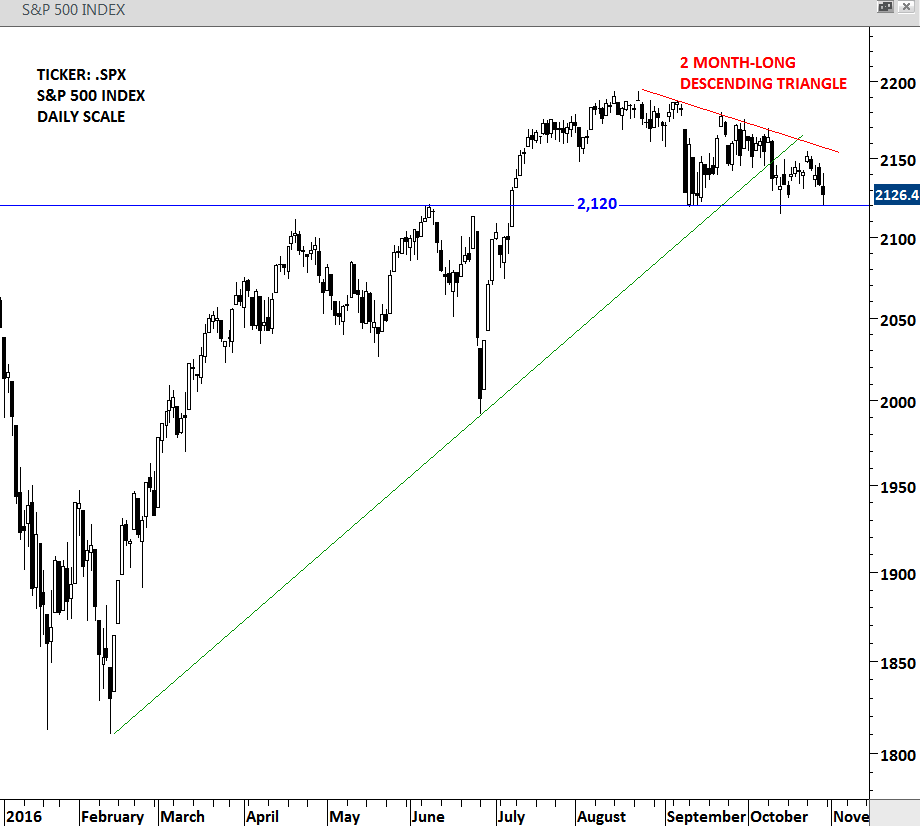
S&P 500 INDEX daily scale price chart
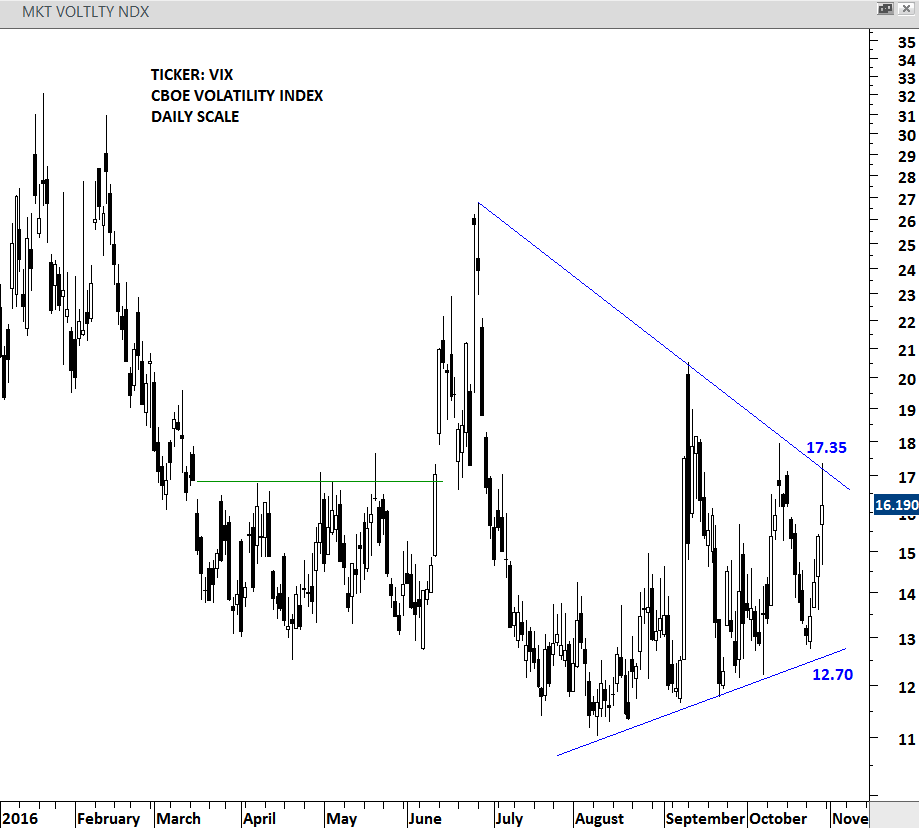
CBOE VOLATILITY INDEX daily scale price chart