GLOBAL EQUITY MARKETS – December 22, 2018
REVIEW
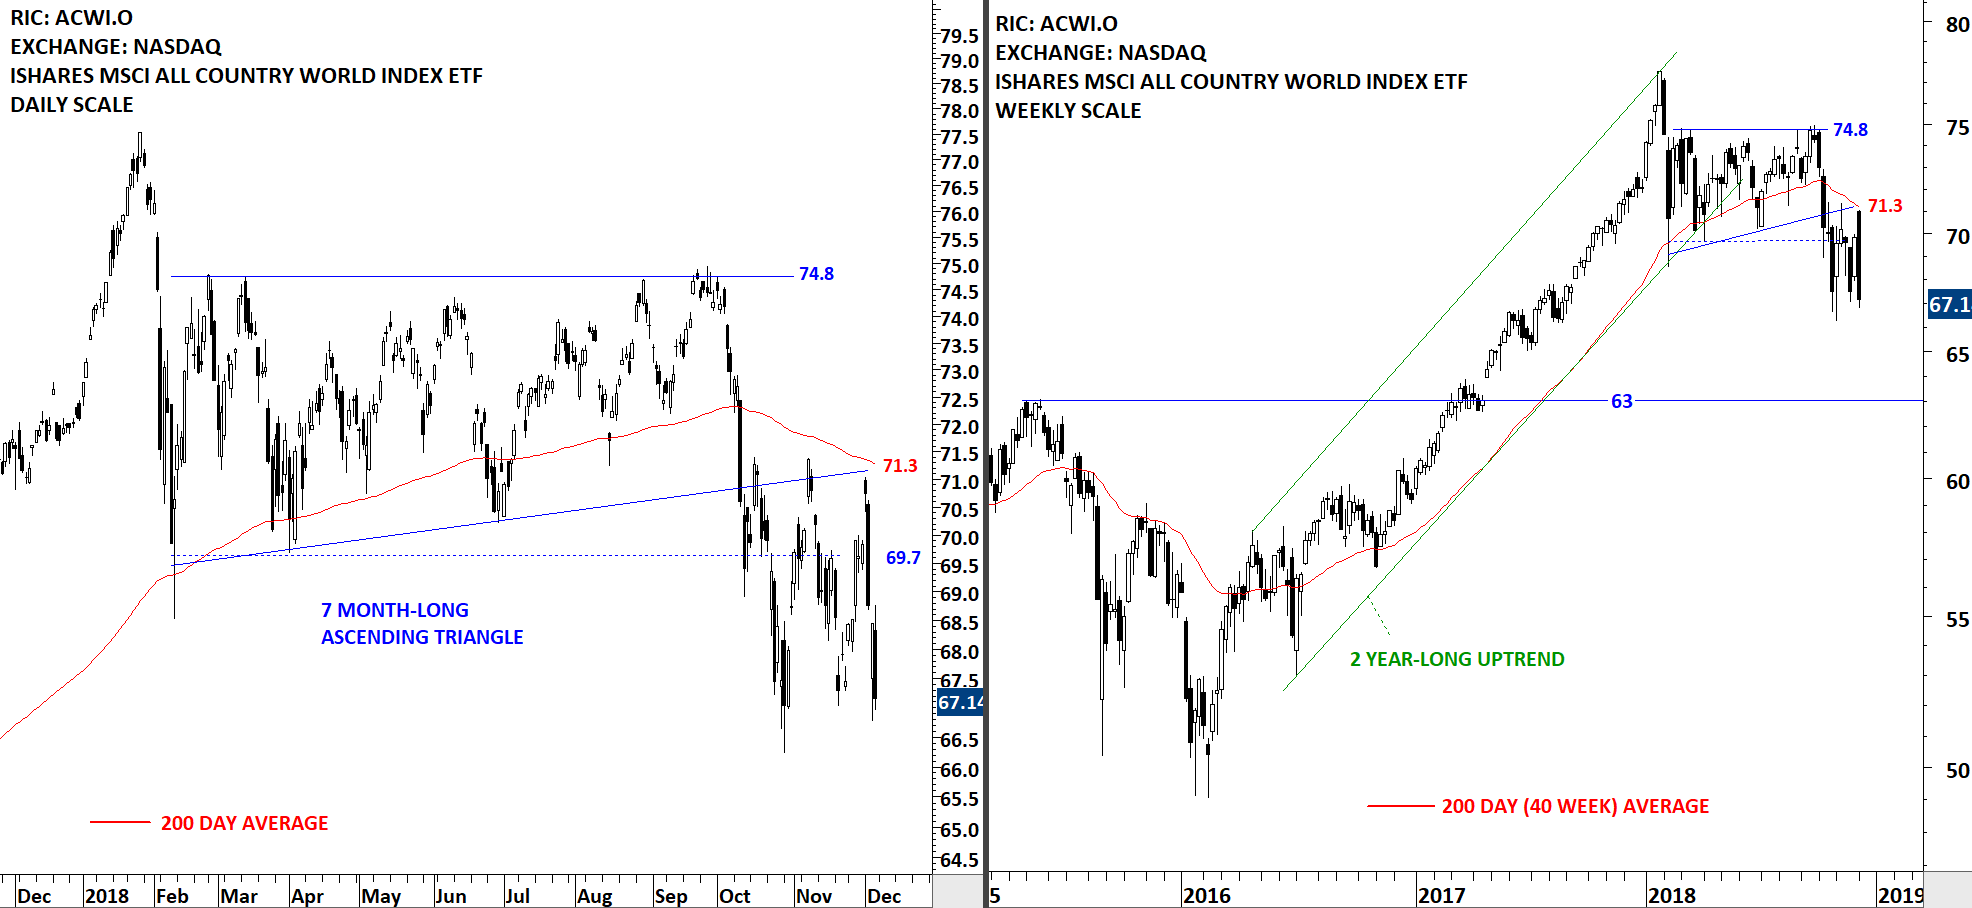
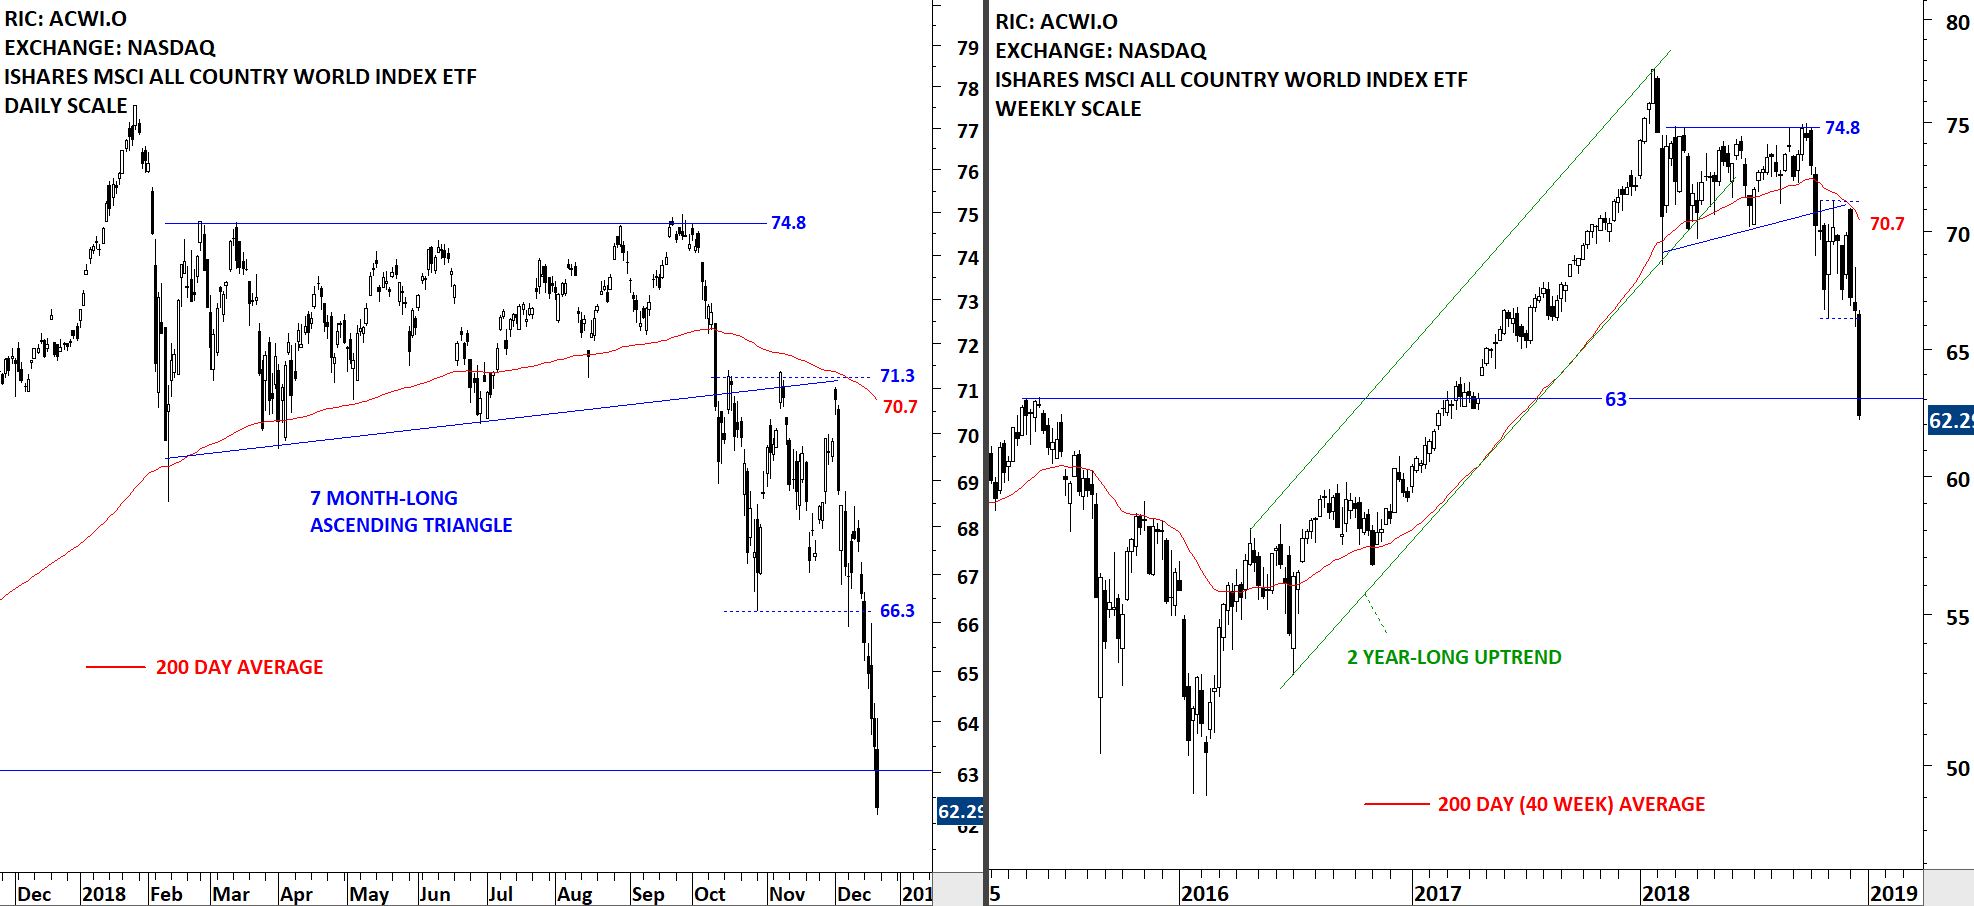
Global equity markets performance as measured by the iShares MSCI All Country World Index ETF (ACWI.O) broke down the 3 month-long sideways consolidation by breaching the support at 66.3 levels. Breakdown was followed by a sharp drop towards the next support level at 63 levels. Nothing good happens below the 200-day moving average. Back in October the long-term trend following indicator alerted us to the change in trend. Previous support becomes the new resistance. 66.3 levels will act as short-term resistance if markets experience any rebound. In the short-term, there is no chart pattern that would signal a trend reversal.
 Read More