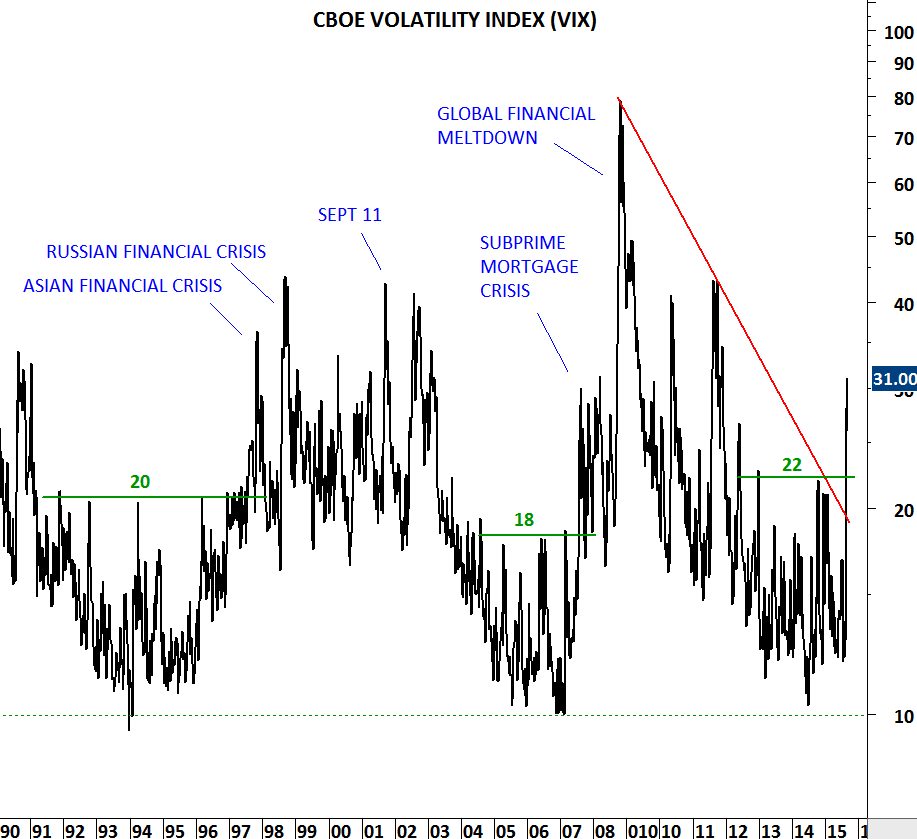
CBOE VOLATILITY INDEX (VIX)
CBOE Volatility index moves into a new territory of high volatility. Usually high volatility periods suggest corrections in equity markets. In the past several decades breakouts above 20 levels on the VIX was followed by major equity market corrections.
Chart shows CBOE Volatility Index with weekly closing prices. Last week of August the VIX closed at 26.05 levels which was clearly above strong resistance at 22. Last few weeks surge in volatility cleared two important technical levels. Both the 7 year-long downward sloping trend line and the horizontal resistance at 22 levels were broken on the upside, suggesting a change in trend.
Unless we see a sharp reversal below 22 levels, following weeks/months will lead to higher volatility levels and further weakness in global equity markets.
*Chart shows updated current price as of 1/9/2015 EST 12:30 PM