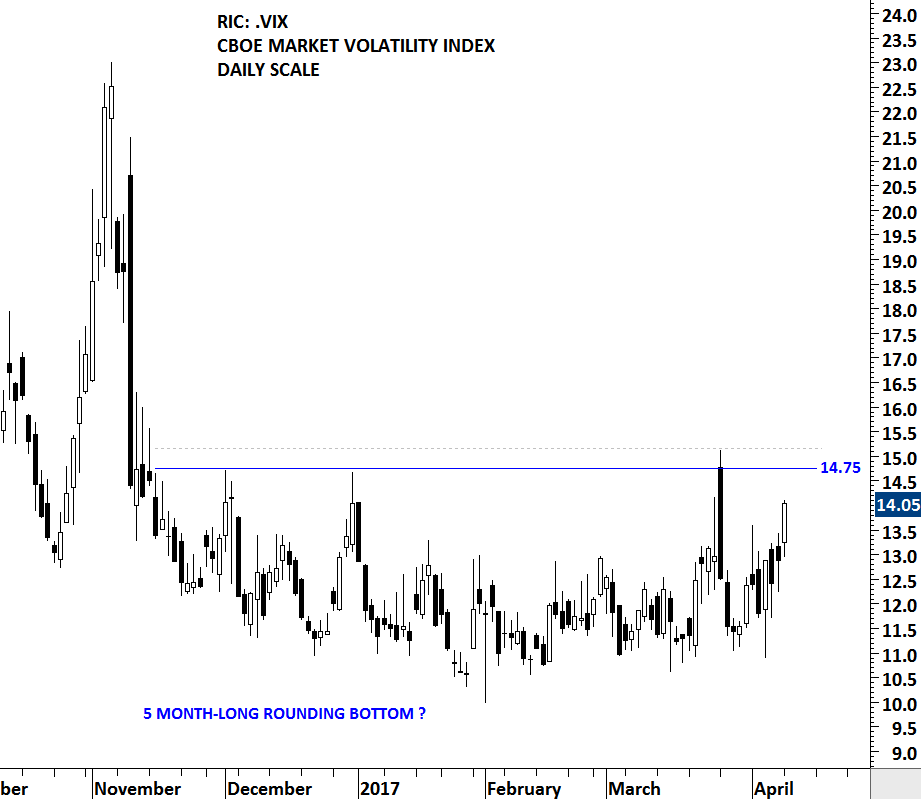
CBOE VOLATILITY INDEX (VIX)
Strong technical support & resistance levels are formed after consecutive tests of the same price level. Support/resistance areas show the battle between the buyers and the sellers. The strong resistance for the CBOE VOLATILITY INDEX (VIX) stands at 14.75 levels. Over the past 5 months, the VIX consolidated between 10 and 15 levels. Price tested the horizontal resistance at 14.75 for 3 times over the course of the 5 month-long consolidation. Since the beginning of April, volatility index has been inching higher towards the strong resistance. A daily close above 15.15 levels can complete the 5 month-long consolidation and result in a spike in volatility. A spike in volatility can put downward pressure on global equity indices. This chart should be on your radar in the coming weeks.
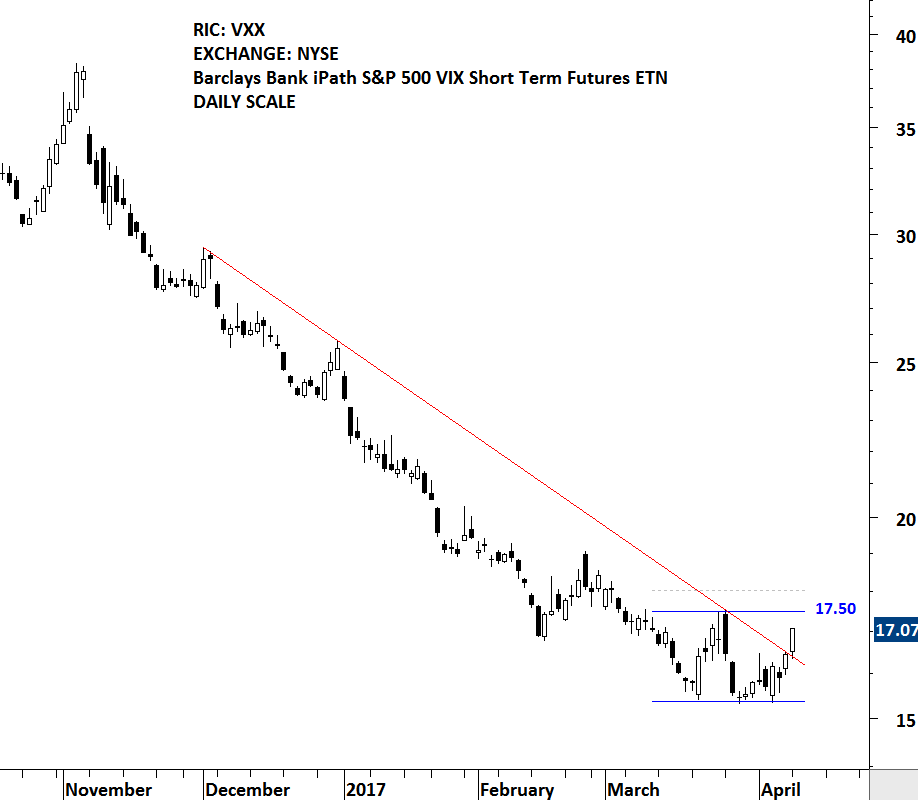
CBOE Volatility Index has a liquid futures market. For equity traders who don’t have access to futures markets, VXX is Barclays Bank iPath S&P 500 VIX Short Term Futures ETN. Ideally VXX would track the CBOE’s VIX index—the market’s de facto volatility indicator. However since there are no investments available that directly track the VIX, Barclays chose to track the next best choice: VIX futures. Unfortunately using VIX futures introduces a host of problems. The worst is value decay over time. Another problem is that the combination of VIX futures that VXX tracks does not follow the VIX index particularly well. With all the disadvantages compared to trading directly the VIX futures, the VXX ETN can still act as a good short-term tool to play the volatility. VXX trades like a stock. It can be bought, sold, or sold short anytime the market is open, including pre-market and after-market time periods. The VXX ETN is listed on the New York Stock Exchange.
Short-term resistance for the VXX stands at 17.50 levels. A daily close above 18 levels will complete the short-term base formation.