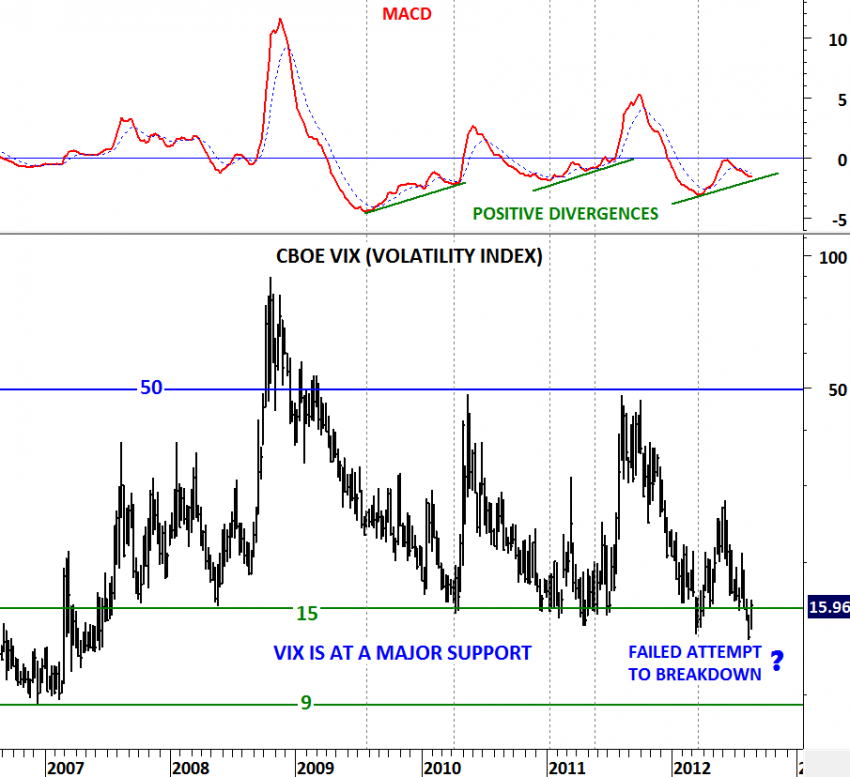
CBOE VIX
Earlier during the month I wrote about CBOE VIX. Volatility is a good measure of market sentiment. Historical chart studies show 3 important levels for CBOE VIX. 50 level has been an extreme pessimism in the equity markets and 9 & 15 levels; extreme optimism. Over the past 5 years VIX couldn’t break below 15 levels. As a result, equity market peaks occurred every time VIX reached 15 levels. In the past few weeks, CBOE VIX made an attempt to break below 15 levels. This was critical as it would have pushed the volatility index and the sentiment to a new extreme. However, the attempt failed to break down the important support level. We are now back into the trading range between 15 and 50. Given that MACD is generating a positive divergence (a warning signal for a possible reversal), we are likely to see higher prices on the VIX, that could result in a weak equity market. We continue to watch 15 levels as an important support and unless index closes below 15 levels on a weekly basis, we expect higher VIX levels in the coming months.


