Over the past two weeks, global equity markets rebounded from strong support levels. Last two week’s recovery came after the S&P 500’s pull back to its long-term support level at 2,125 levels. Long-term charts of S&P 500 index and a broader representation of global equity market performance, the MSCI ALL COUNTRIES WORLD INDEX, possibly completed a re-test of the broken resistance/support levels. Once a resistance is cleared it becomes support and vice versa.
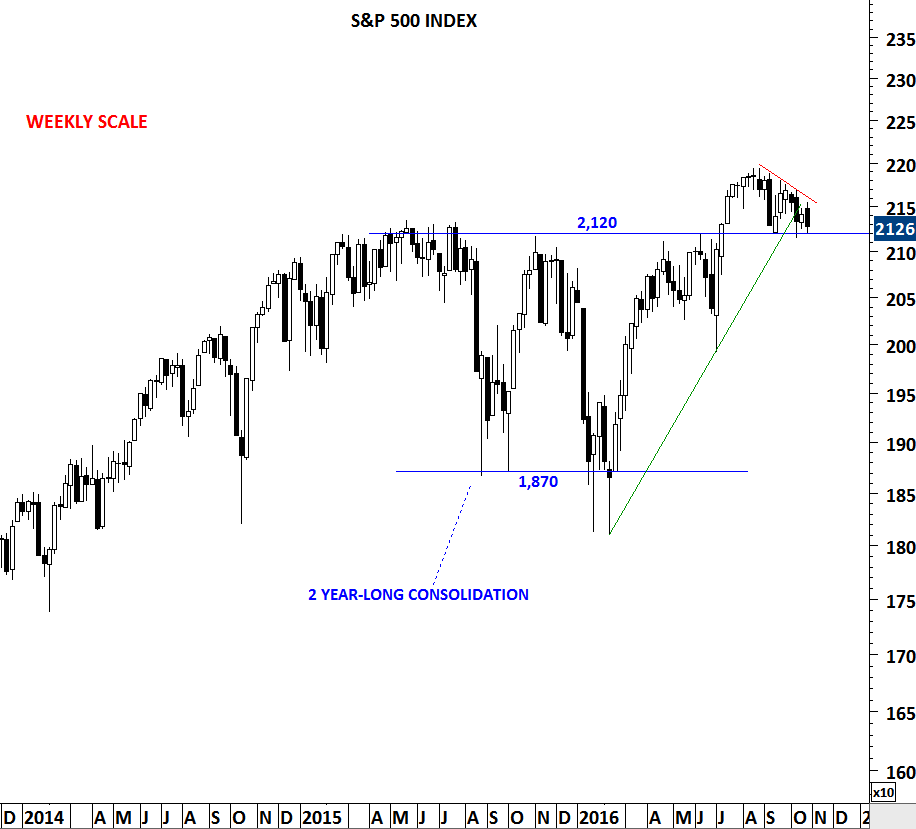
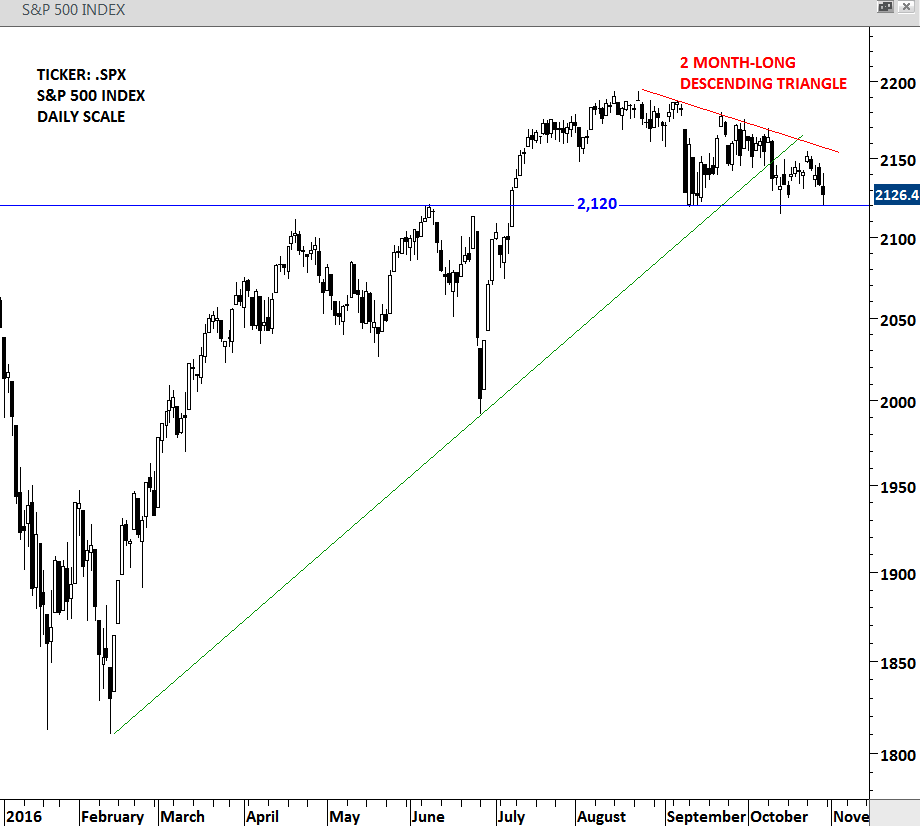
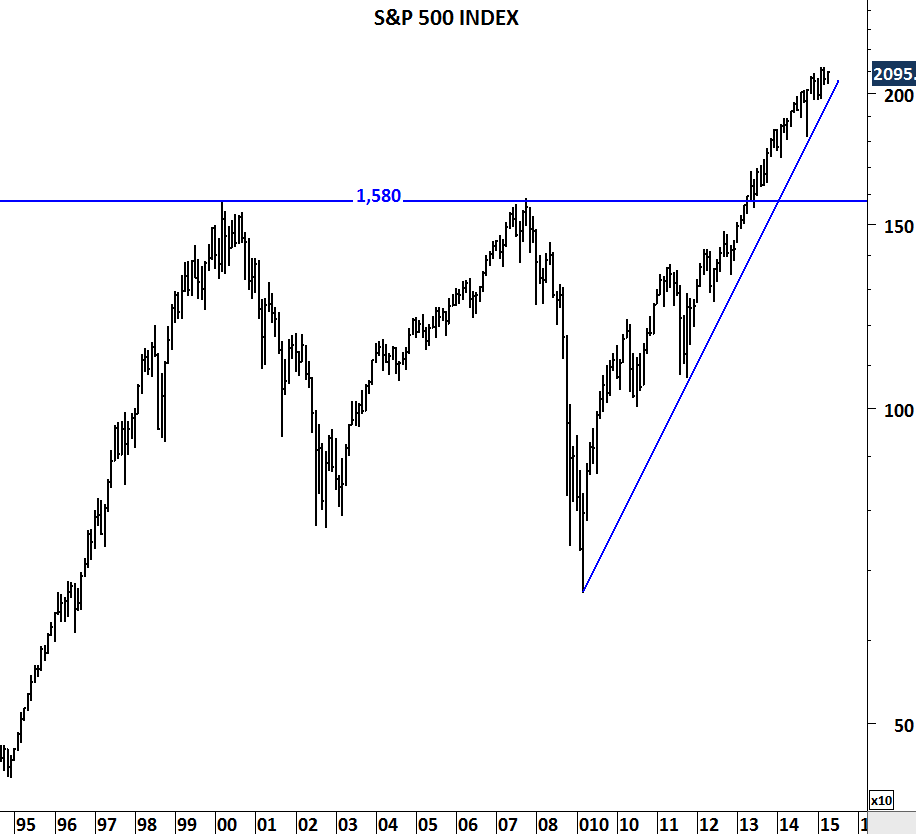
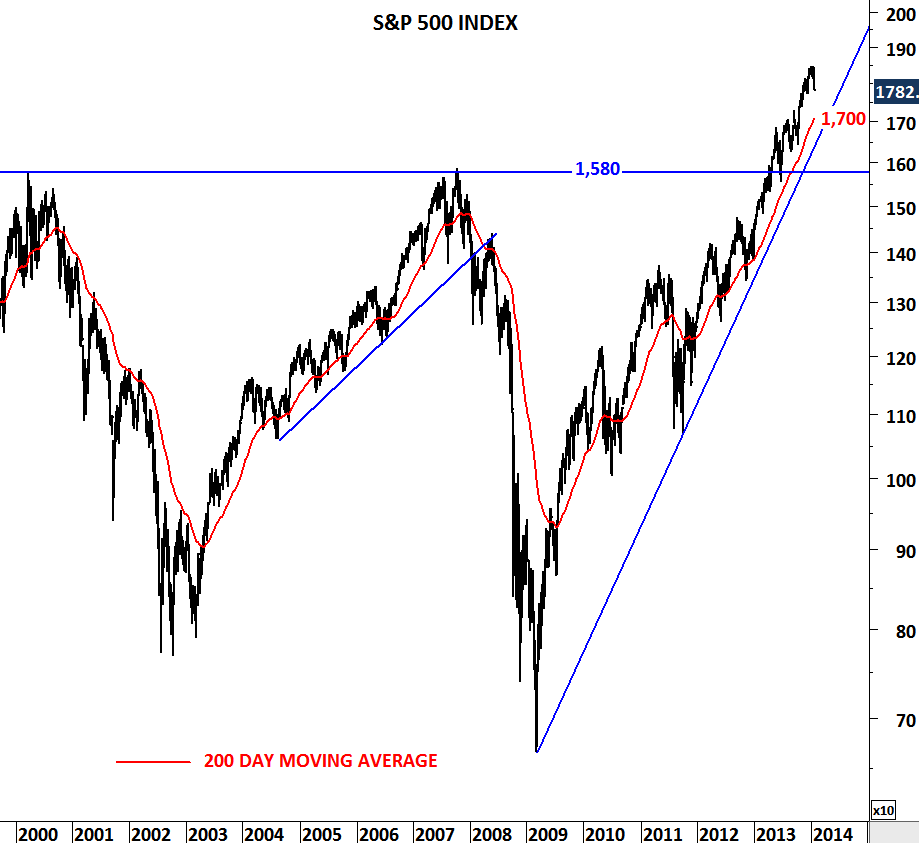
S&P 500 index, a benchmark for large cap US equities broke out of a year-long sideways consolidation in mid-July. After reaching 2,193 levels in mid-August, the index pulled back to test the broken resistance at 2,125 levels. Both the year-long upward trend line and the horizontal support held well and the index rebounded without any technical damage to the long-term trend. Unless the markets reverse once again to challenge the support at 2,125 levels, we will claim the latest price action was a pullback and is likely to be followed by a resumption of the long-term uptrend.
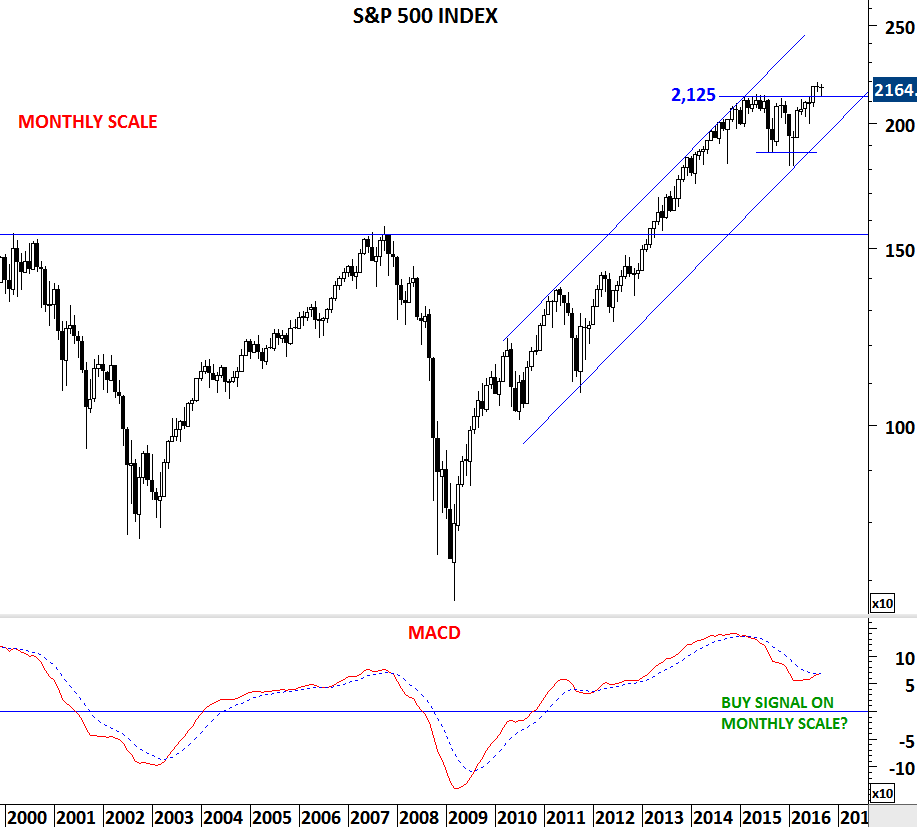
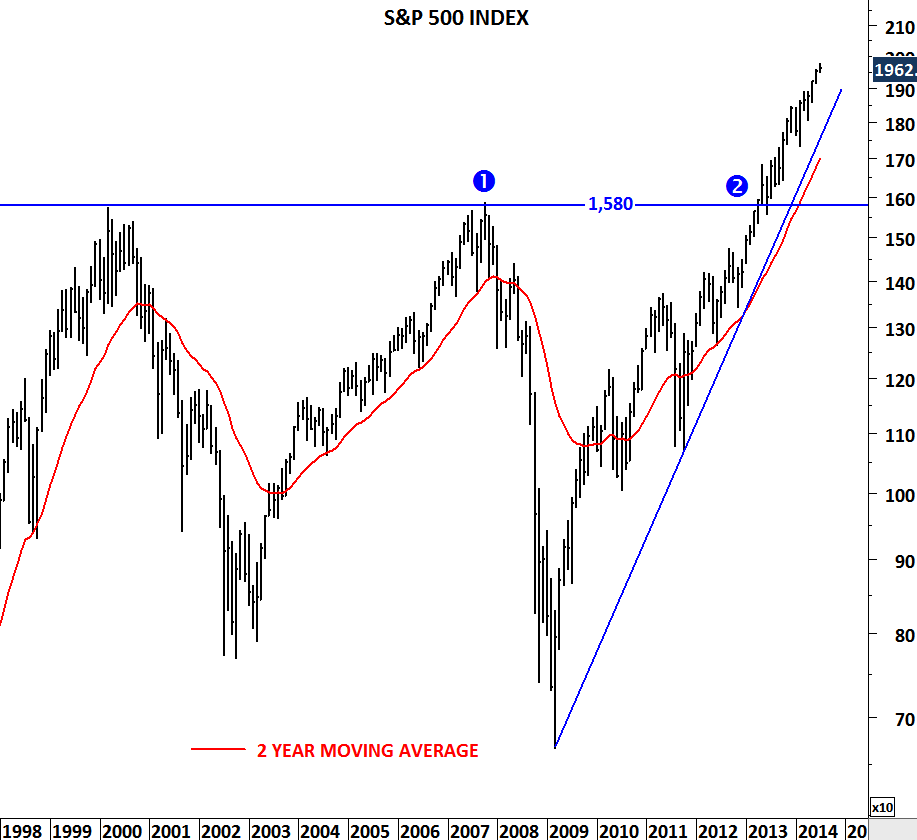
Monthly scale price chart of S&P 500 index
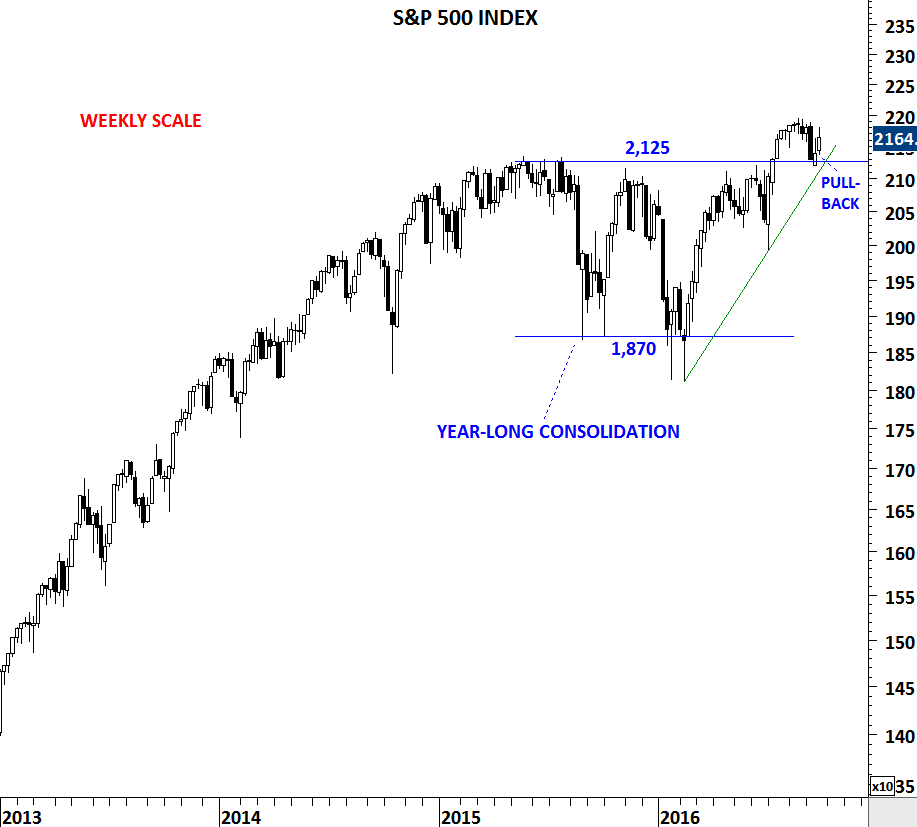
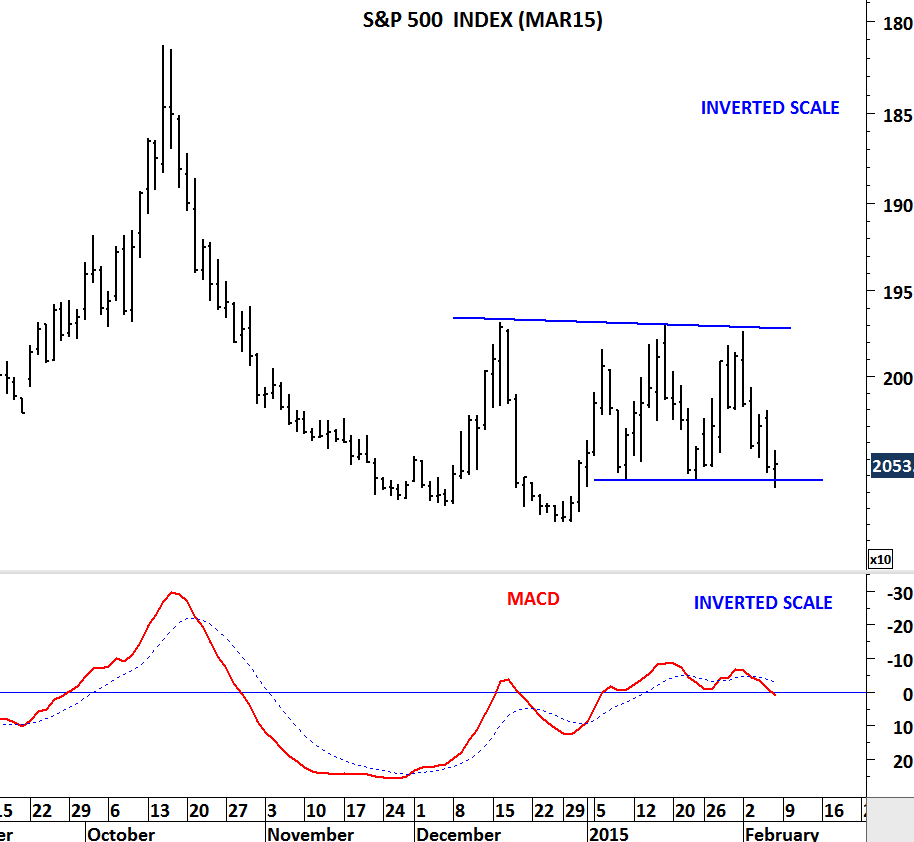
Weekly scale price chart of S&P 500 index
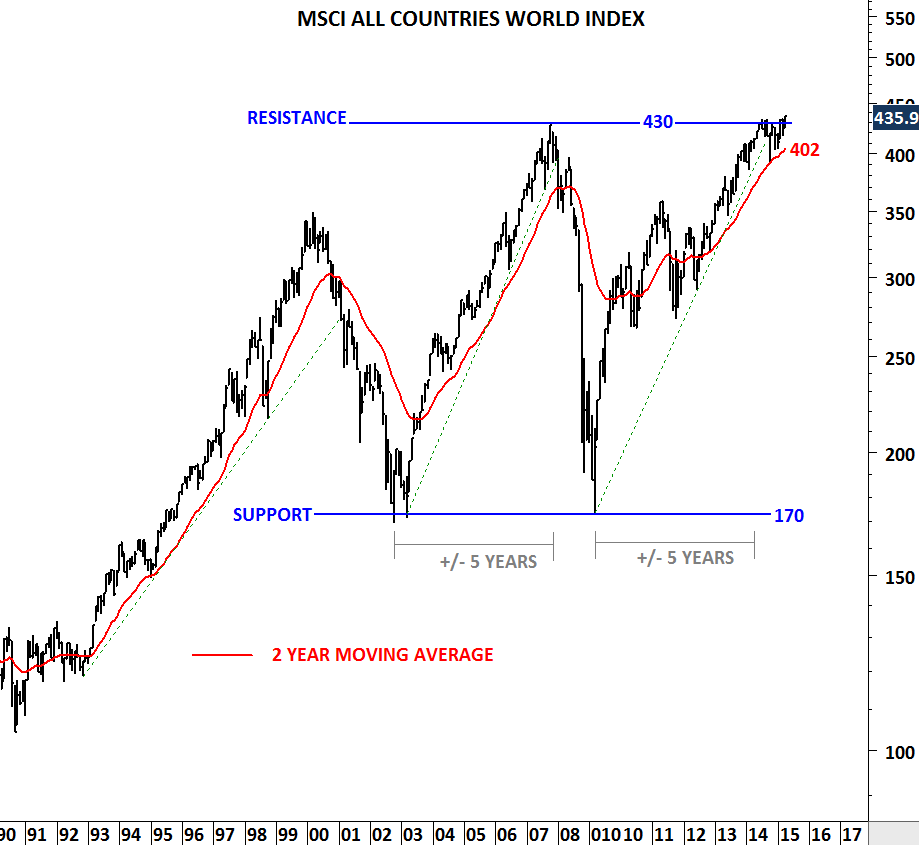
MSCI ALL COUNTRIES WORLD INDEX captures large and mid cap representation across 23 Developed Markets and 23 Emerging Markets countries. With 2,481 constituents, the index covers approximately 85% of the global investable equity opportunity set. Please note that iShares has an MSCI ACWI ETF that seeks to track the MSCI ALL COUNTRIES WORLD INDEX.
In mid-July MSCI ACWI, similar to S&P 500 index, completed a significant chart pattern. A year-long H&S continuation chart pattern was completed with a breakout above 410 levels. Since then the index possibly completed a pull back to the neckline of the H&S chart pattern. Last week’s sharp reversal increased the likelihood of a continuation towards 443 levels. Unless the index reverses to challenge the support at 405 levels, we will identify the latest price action as a pullback that is likely to be followed by a resumption of the long-term uptrend.

Monthly scale price chart of MSCI ACWI
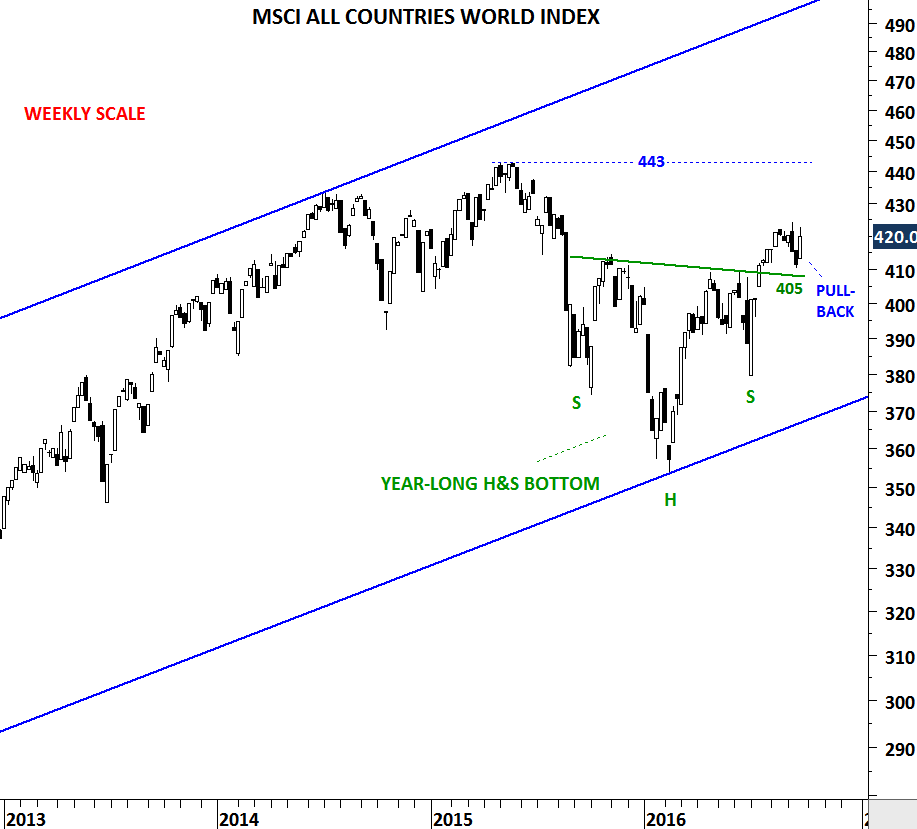
Weekly scale price chart of MSCI ACWI
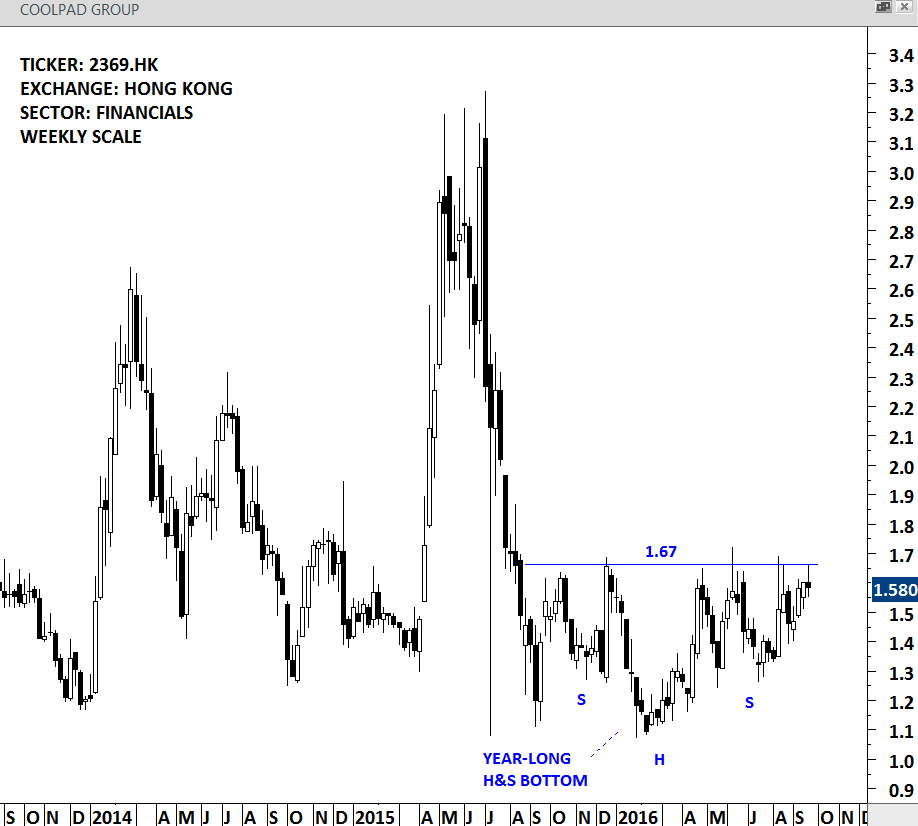
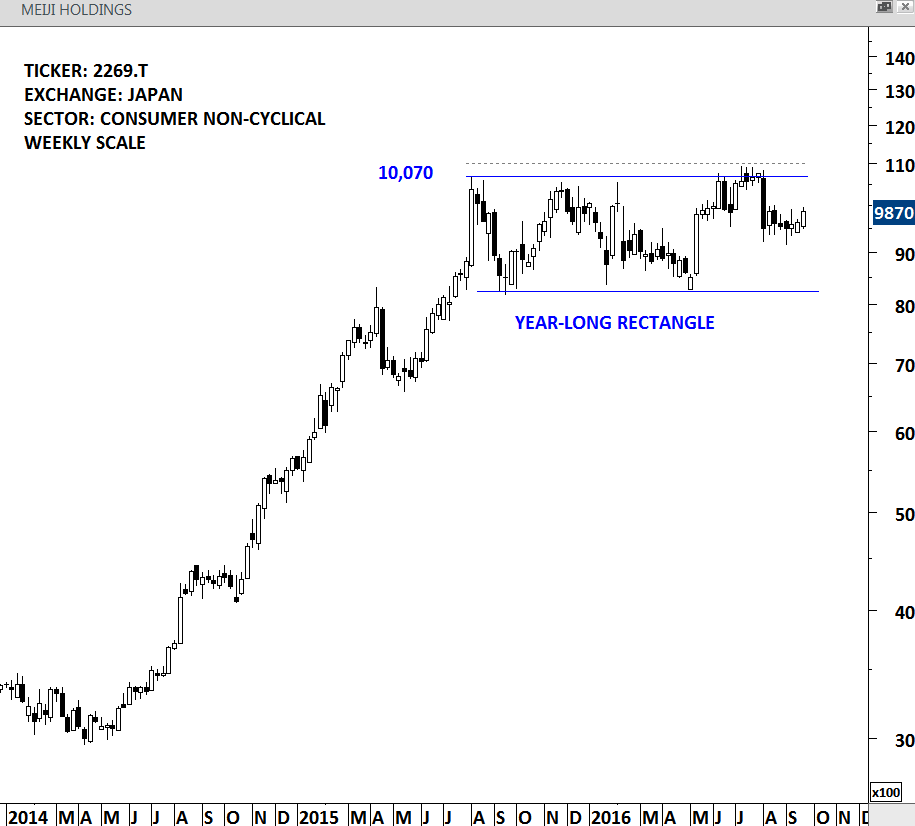
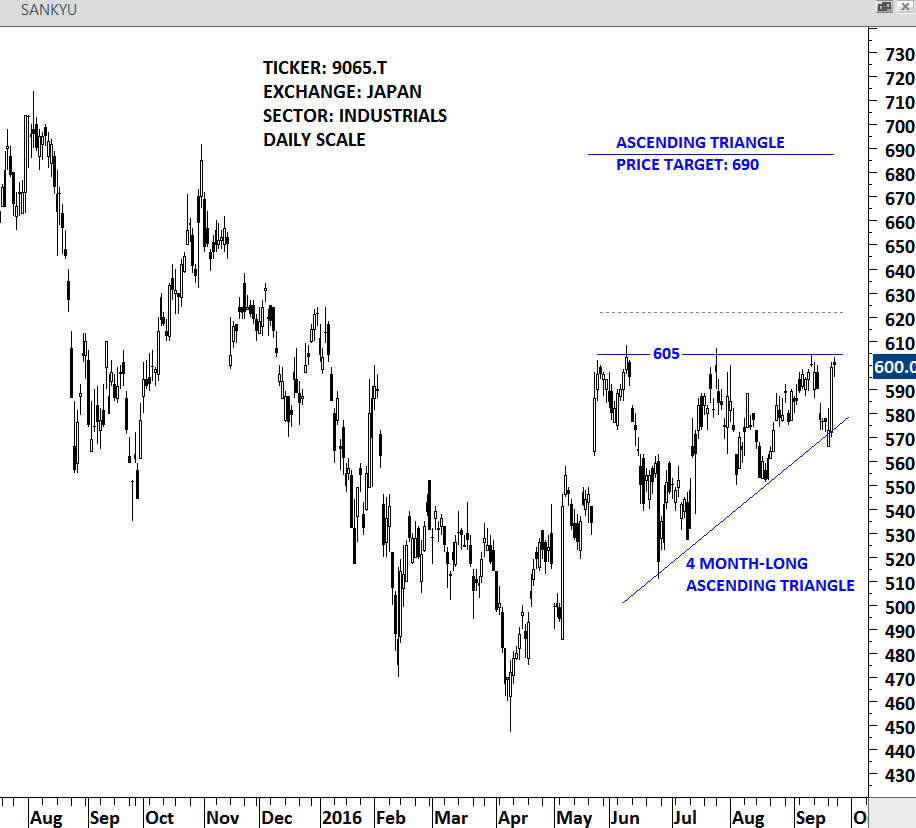
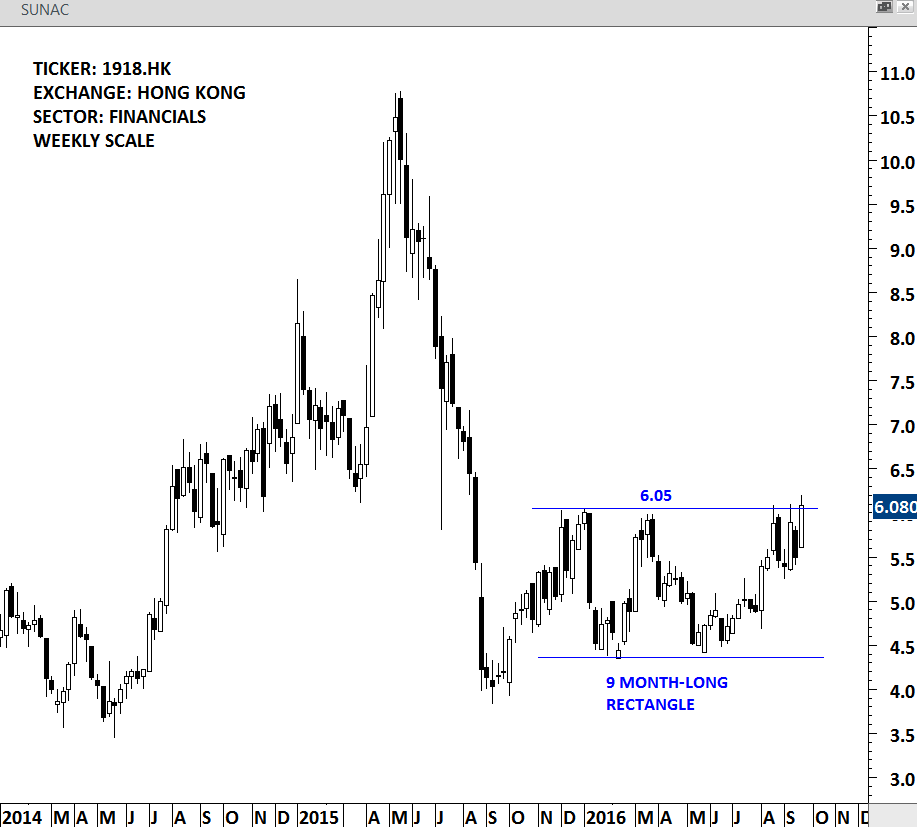
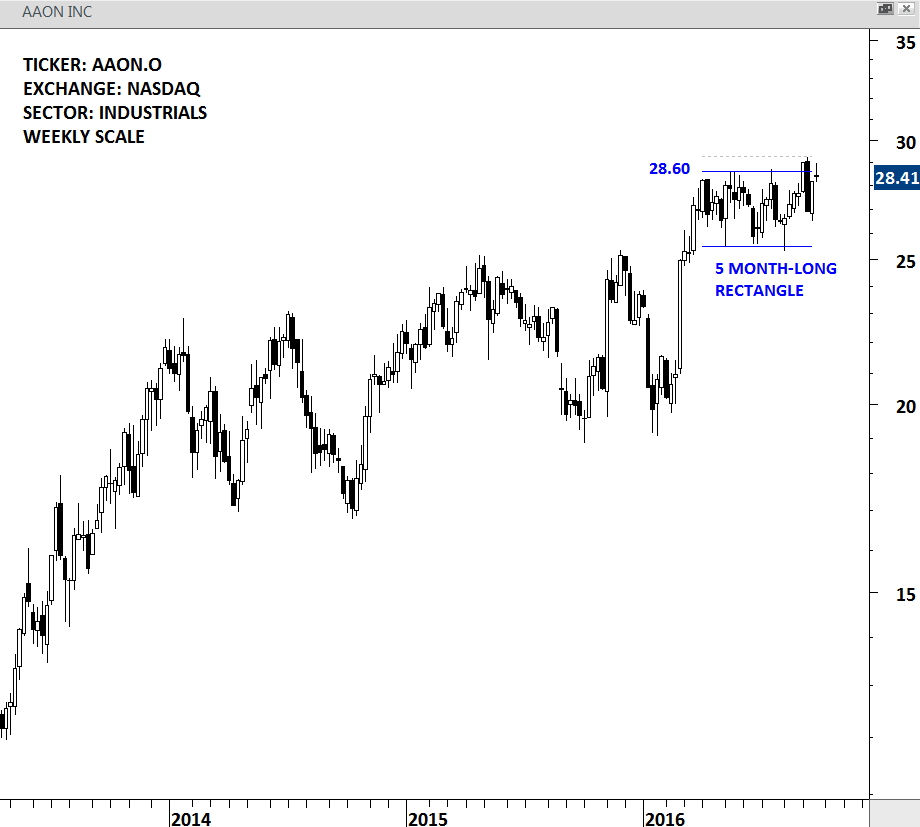
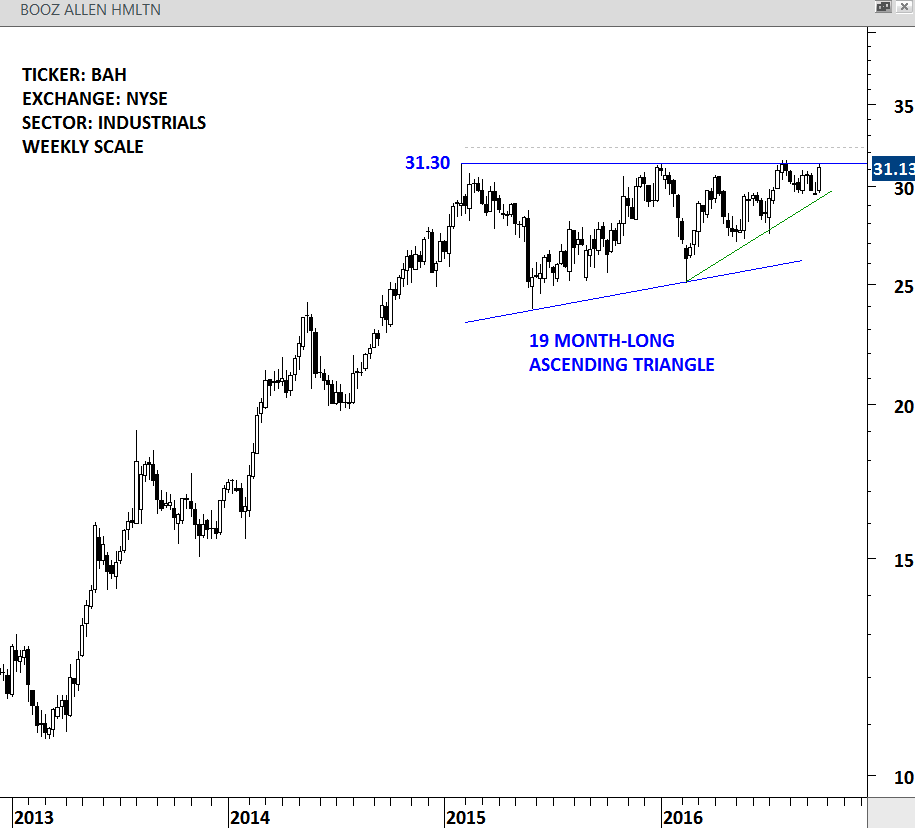
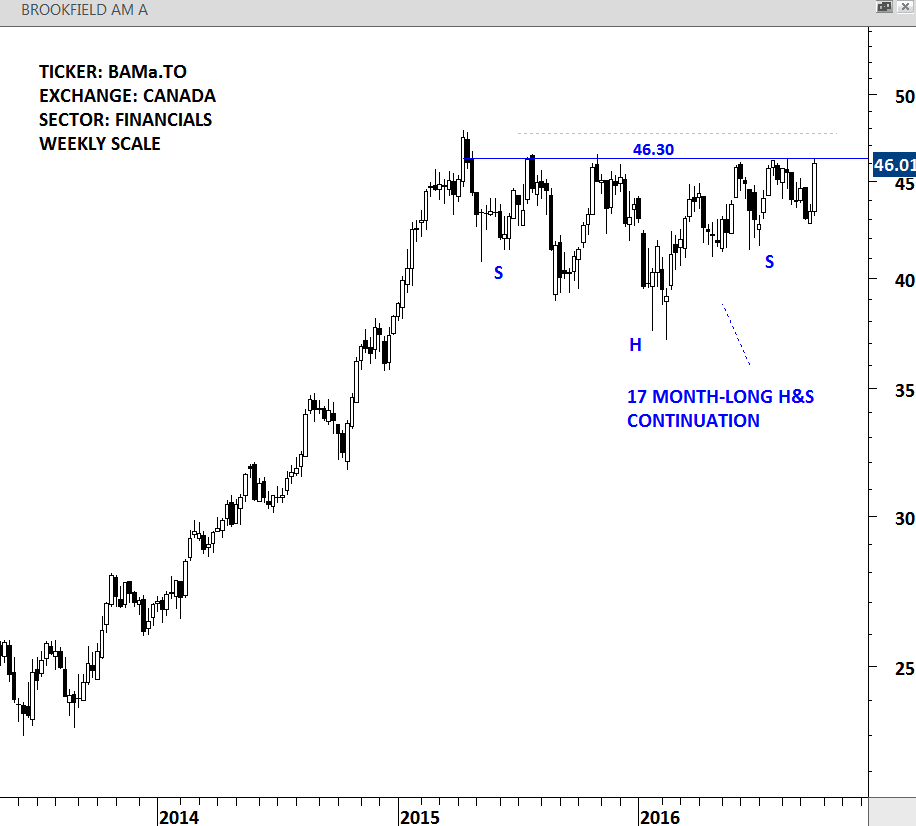
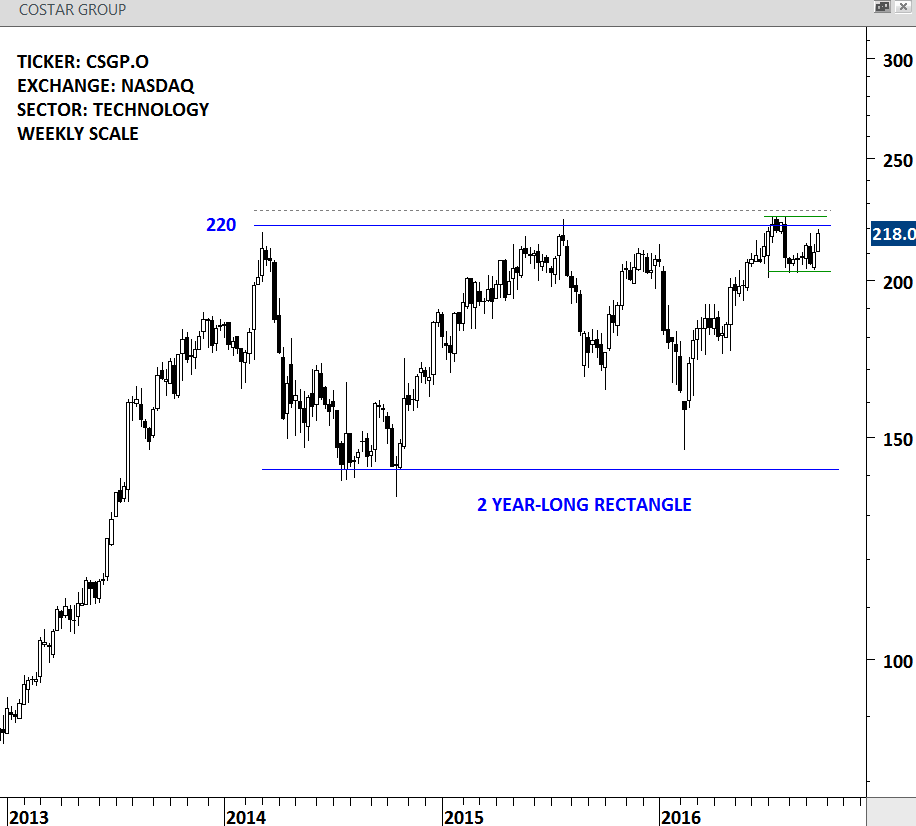
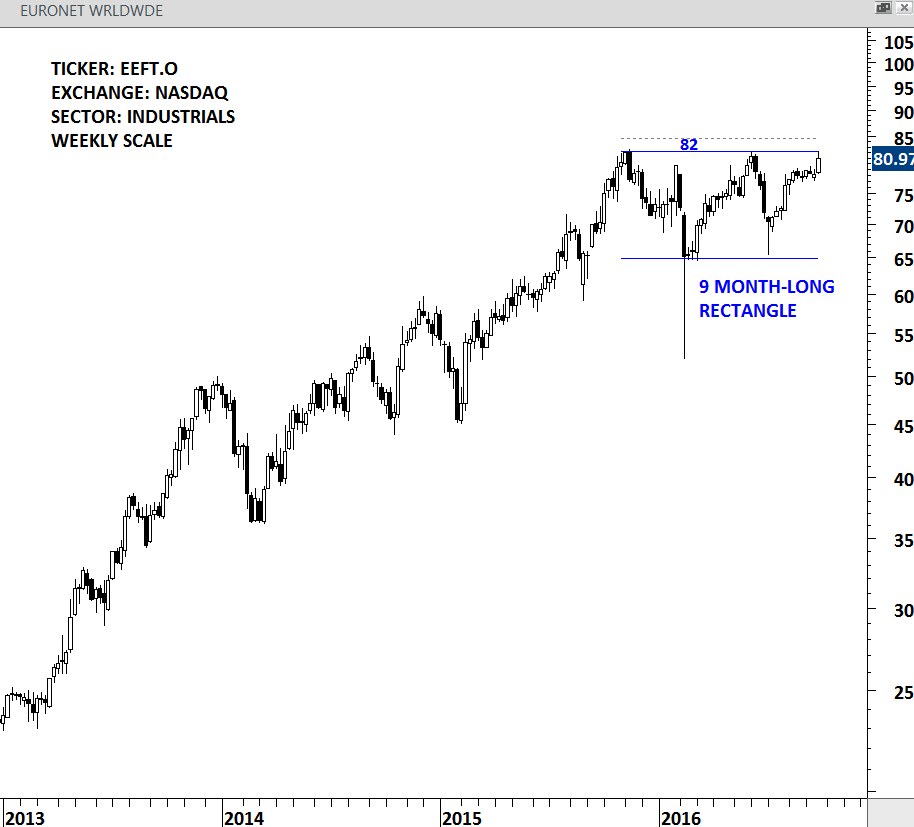
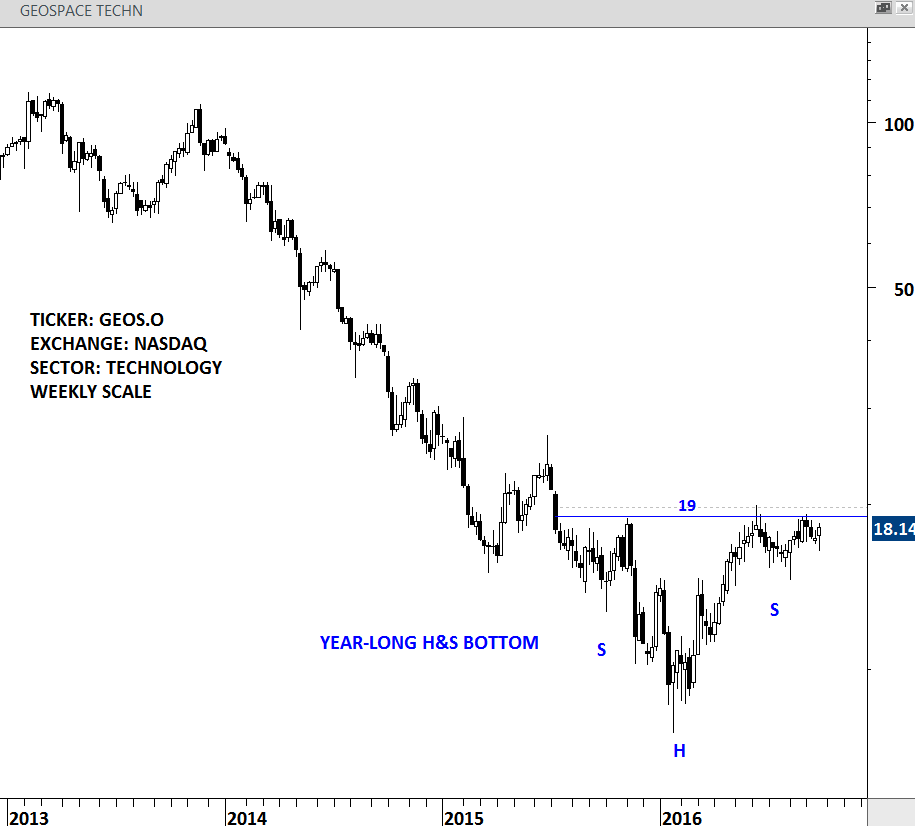
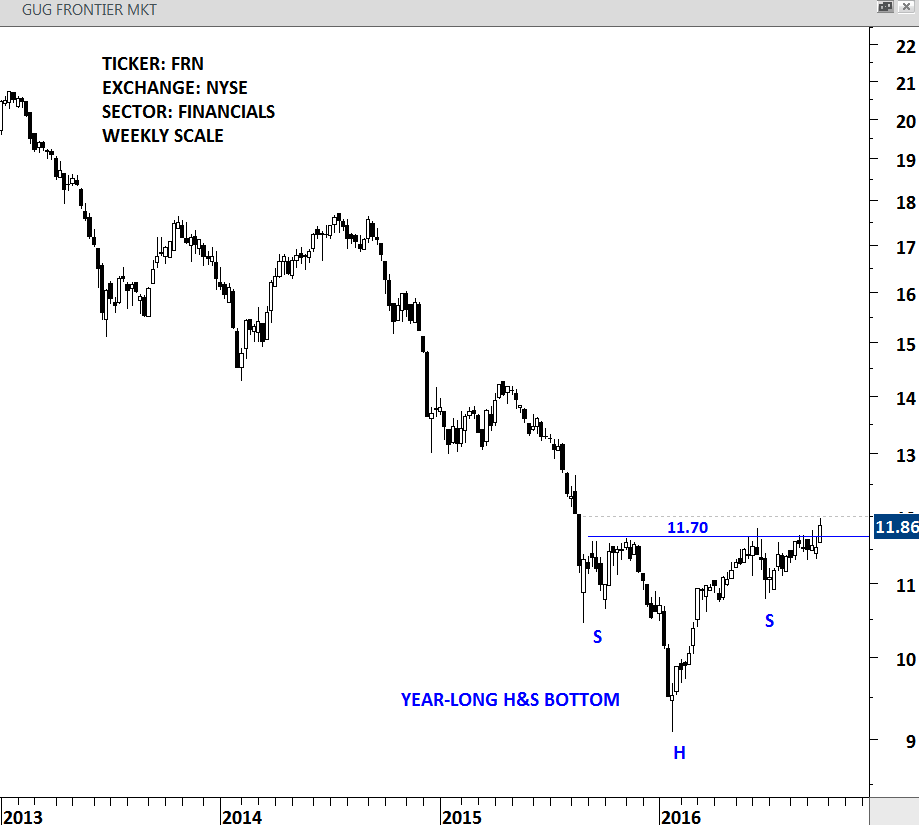
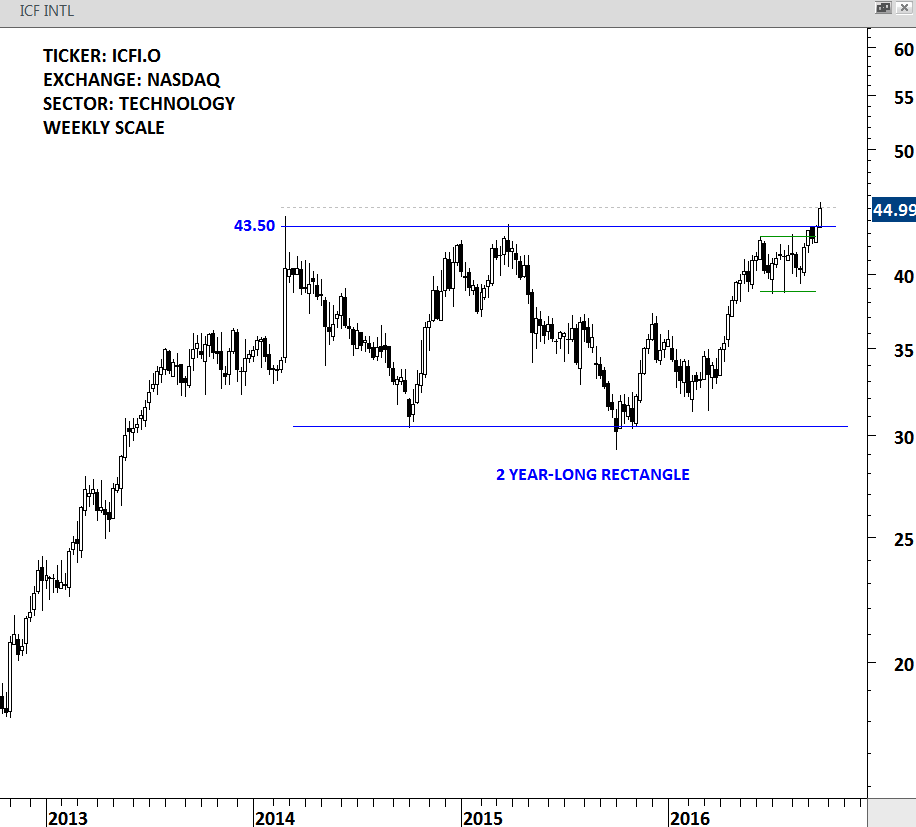
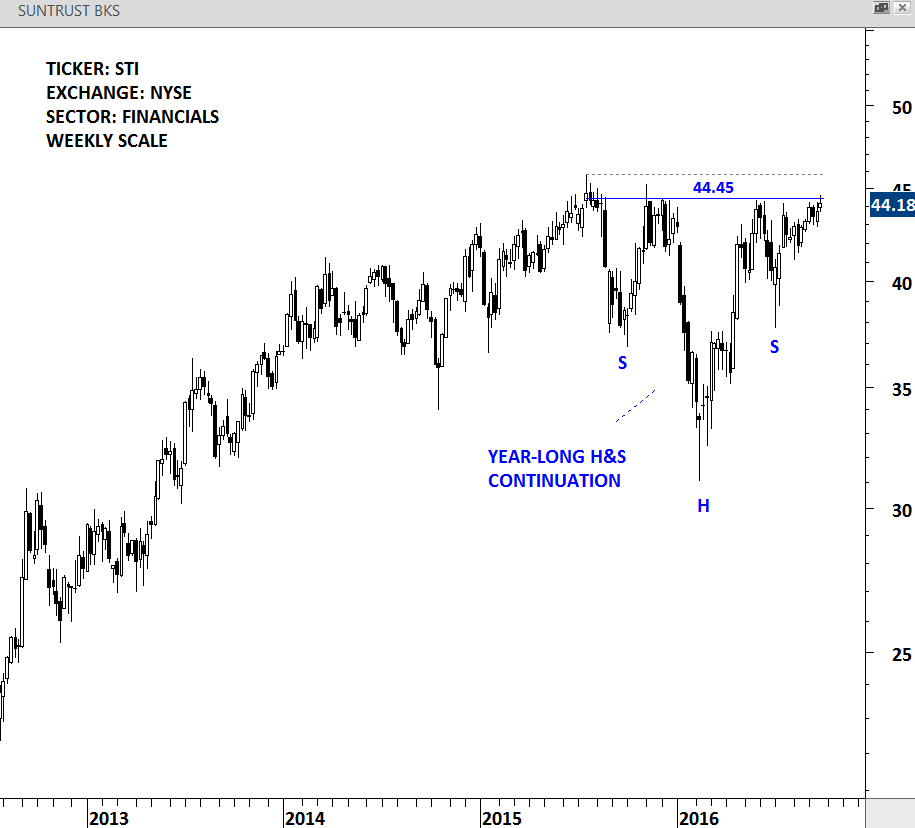
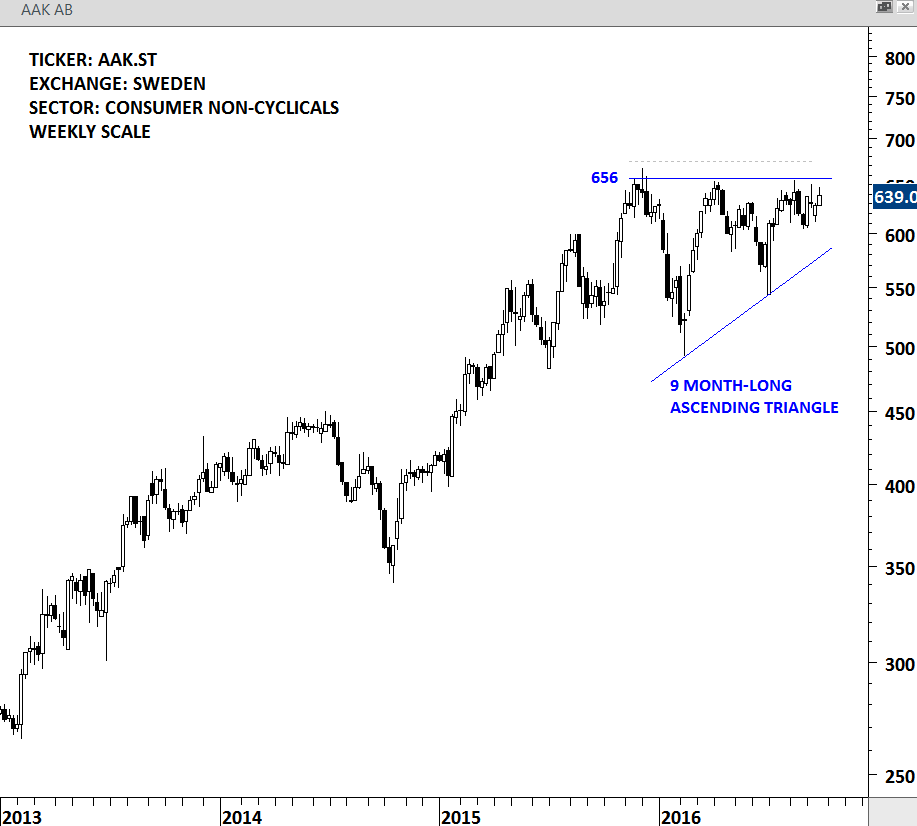
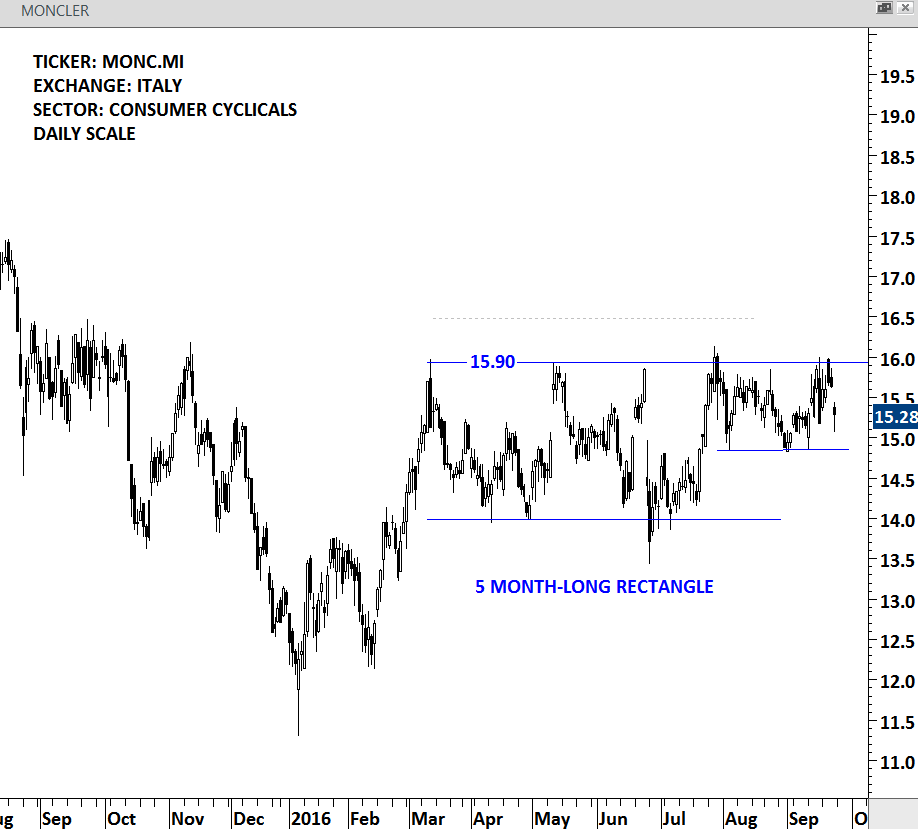
If global equity indices mentioned above resume their uptrends, we are likely to see fresh new highs on several individual securities. Financial media usually pays attention to 52 week highs as a measure of security’s strength. There is even a better way to look at this; all-time highs. It is usually difficult for investors to buy stocks that are reaching their all-time highs. But usually the most promising part of an uptrend starts when a stock moves into uncharted territory in other words all-time highs. Below are some of the stocks on my watch-list that are likely to breakout to all-time highs and some that are likely to record 52 week highs. These stocks formed clear bullish chart patterns with identifiable horizontal boundaries. Breakouts will not only complete the chart patterns but also will push the stocks to all time highs and 52 week highs.
U.S. & CANADA
EUROPE
JAPAN & HONG KONG