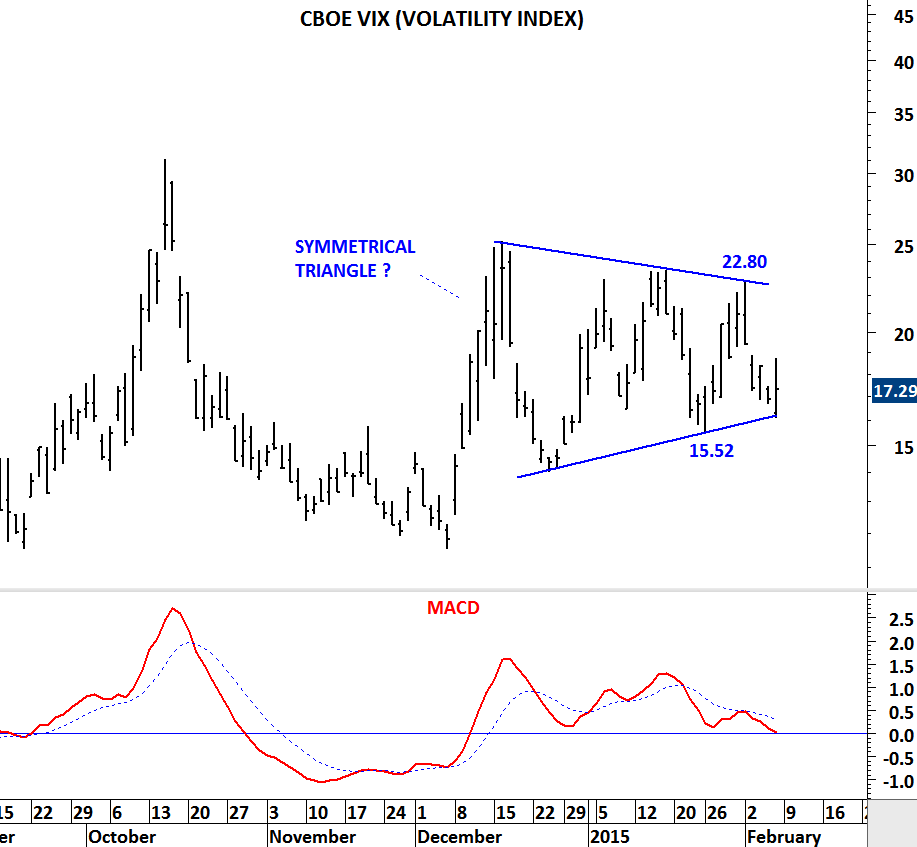
CBOE VIX (VOLATILITY INDEX)
During the sharp correction in October 2014, S&P 500 index reached 1,800 levels and CBOE VIX jumped to 31 levels. VIX is often called the “fear index”. Higher levels of VIX can coincide with market corrections. Over the past 2 months CBOE VIX has been consolidating in a tight range. Consolidation can be a symmetrical triangle. Breakout from this consolidation will result in high volatility for U.S. equities. Breakout above 22.80 levels can send the VIX to 35-40 area. Breakdown below 15.52 levels will be positive for equities. I have posted the S&P 500 index futures on an inverted scale to see the price movements in sync with the VIX. Symmetrical triangle chart pattern (if it is a valid one) should resolve in the next few days/week.
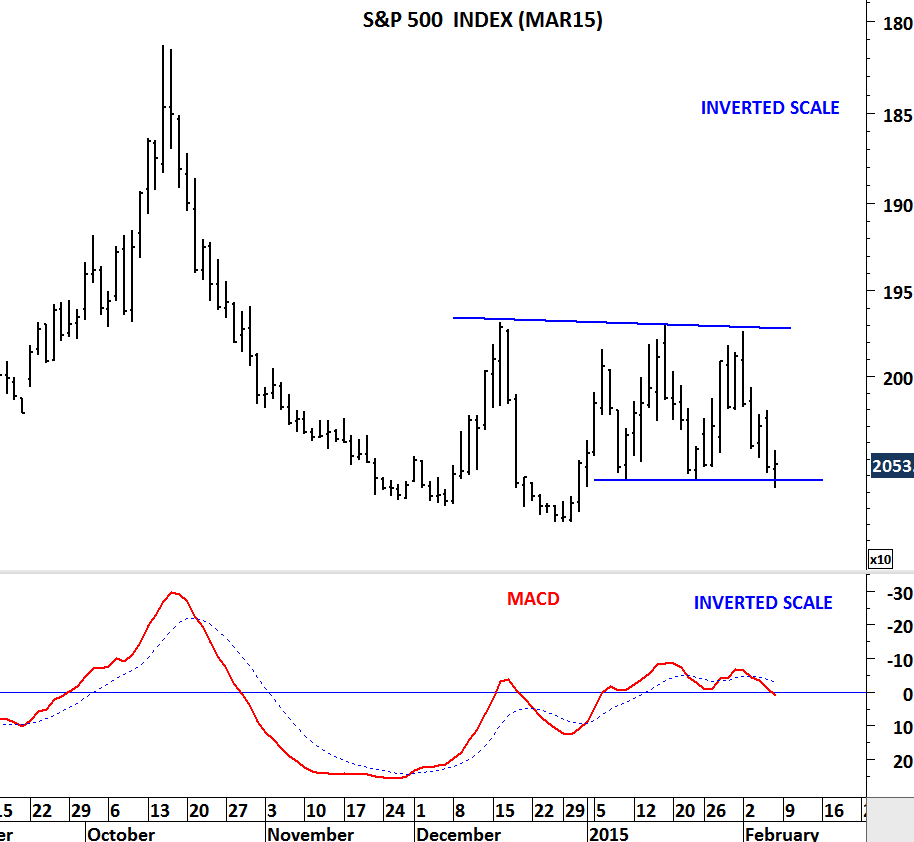
S&P 500 INDEX (MAR 2015) FUTURES PRICE