GERMANY DAX INDEX
Germany’s DAX Index is forming a 4 month-long rectangle chart pattern. Rectangles are classified as continuation chart patterns. Breakouts are usually in the direction of the previous trend. Since the beginning of 2016, DAX index is in a uptrend. Since mid-August the index has been in a sideways consolidation between 10,200 and 10,800. The index tested the upper boundary of the rectangle for four times over the past four months. Breakout above 10,800 will be positive and suggest higher levels. Chart pattern price target stands at 11,400 levels.
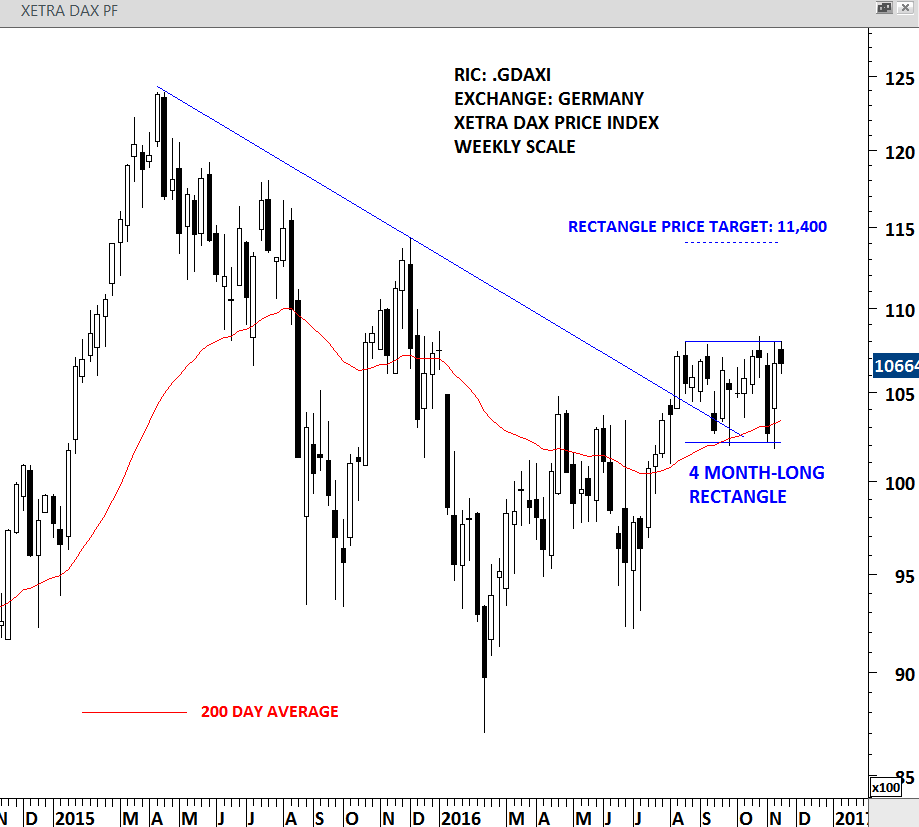
WEEKLY SCALE PRICE CHART OF DAX INDEX
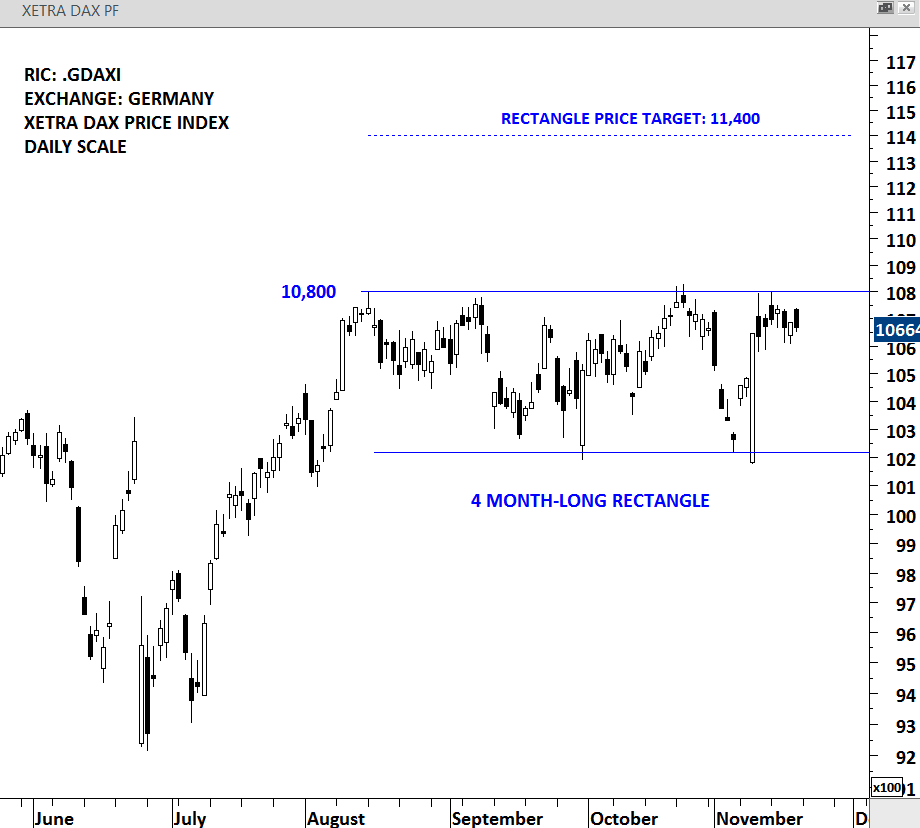
DAILY SCALE PRICE CHART OF DAX INDEX
There are DAX index futures contracts and index ETFs to trade the price action on the possible breakout. Below is the price chart of the Ishares DAX UCITS ETF (in EUR) listed in Germany. It is one of the most liquid instruments that tracks the performance of the DAX 30 index. On the Ishares DAX UCITS ETF, upper boundary of the rectangle stands at 94.60 levels.
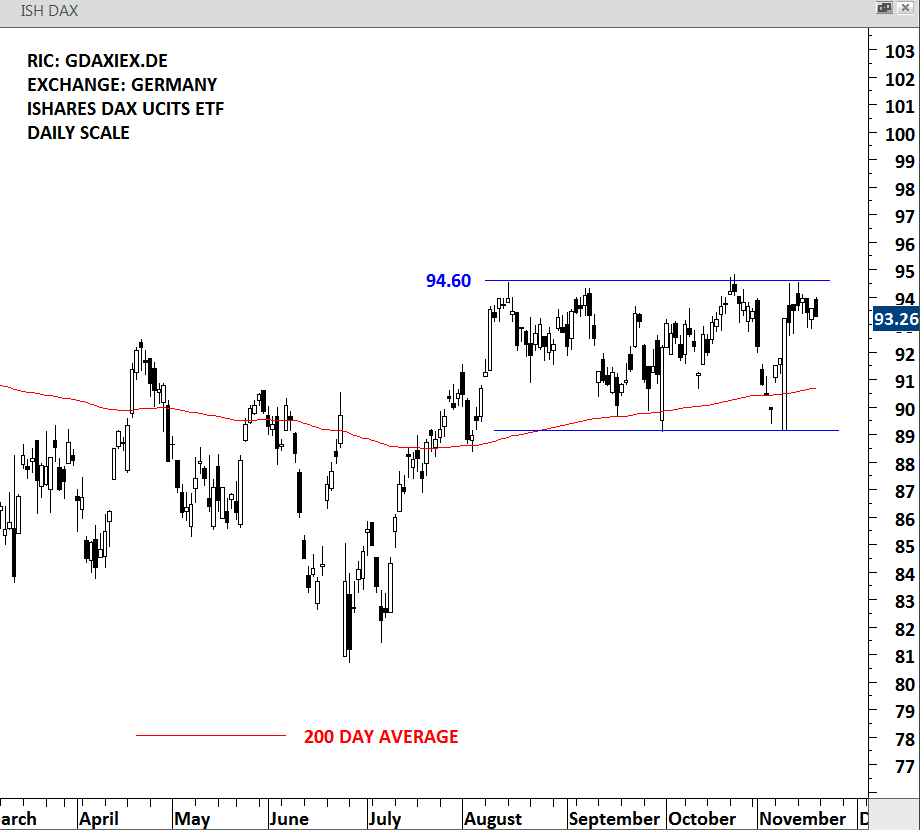
DAILY SCALE PRICE CHART OF ISHARES DAX UCITS ETF