WTI CRUDE OIL and BRENT CRUDE OIL prices are developing bullish chart patterns. Year-long inverse H&S chart patterns are close to completion. Both WTI Crude and Brent Crude are challenging their necklines. For Brent Crude oil the year-long horizontal resistance stands at $52 levels. For WTI, the neckline stands at $50 levels. Breakout above the strong resistances can push prices towards $70 levels in the following months. $70 is the possible H&S bottom price target.
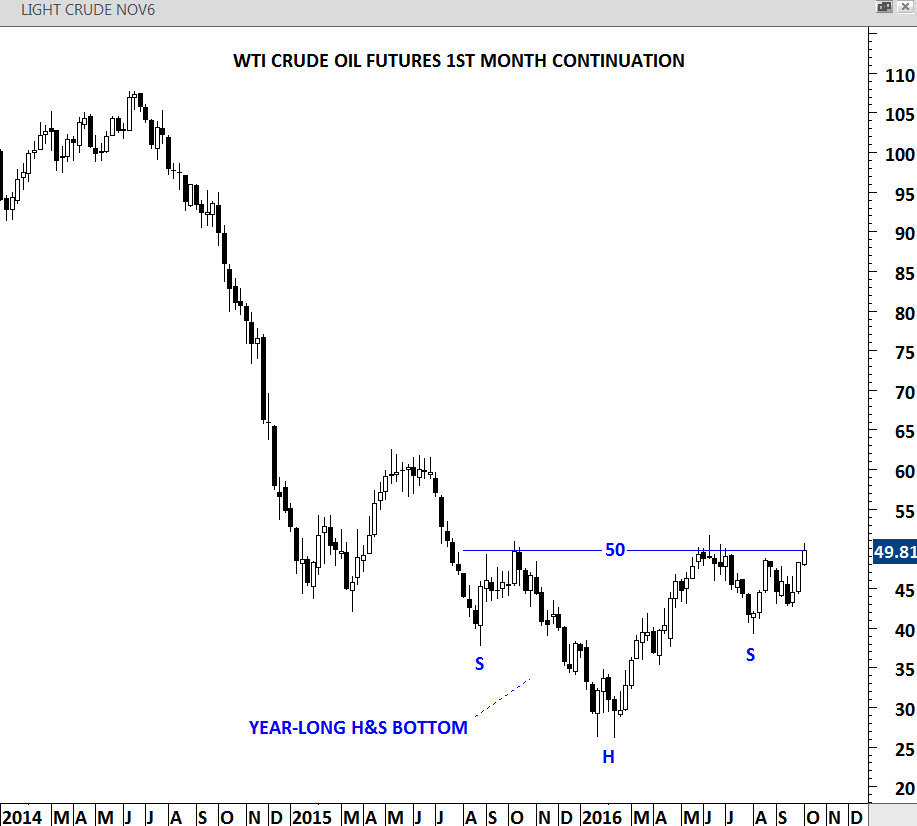
WTI CRUDE OIL weekly scale price chart
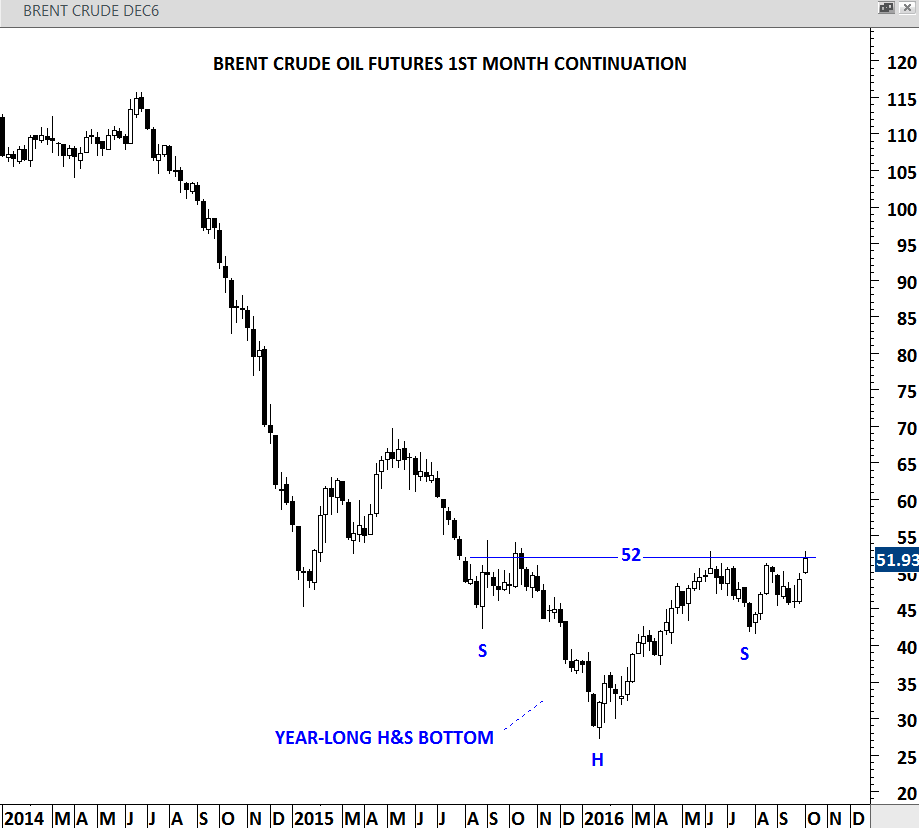
BRENT CRUDE OIL weekly scale price chart
Similar bullish technical outlook can be identified on several equities in the energy sector and energy related exchange traded funds. Below are some of the equities from Tech Charts watchlist. Note: According to Edwards & Magee a breakout is confirmed when a stock records a daily close above the resistance by 3% margin. Levels on the charts below take this guideline into consideration.
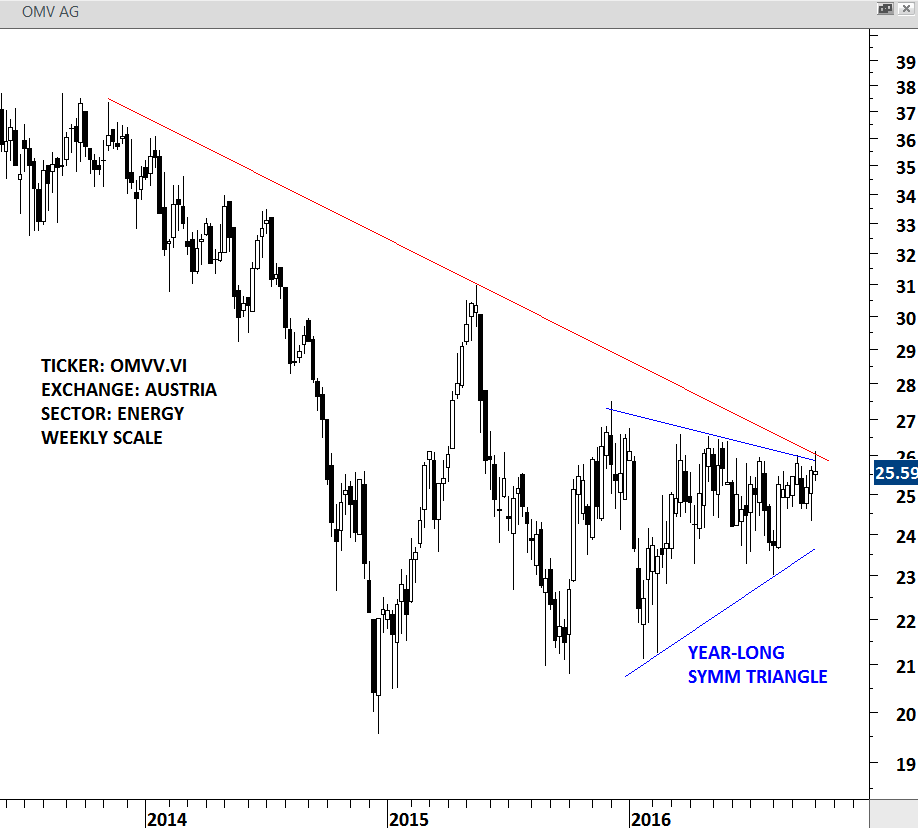
OMV AG an Austria based integrated oil and gas company forms a year-long symmetrical triangle. Stock has been challenging the upper boundary of its consolidation. Breakout above 26.5 levels should generate fresh chart pattern breakout signal.
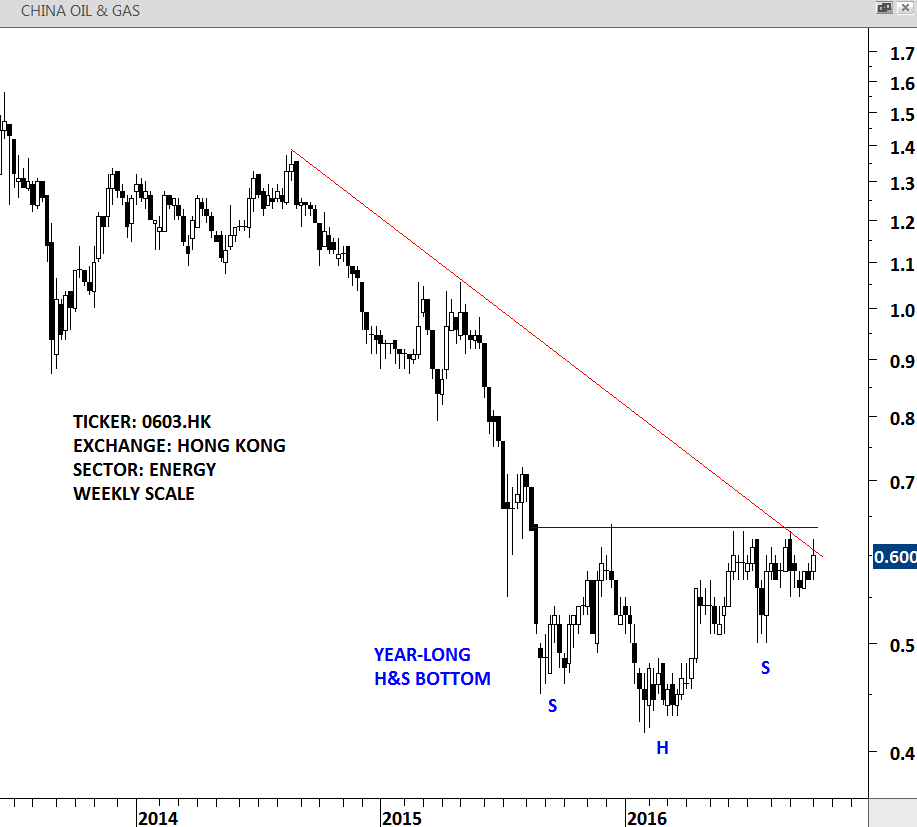
CHINA OIL & GAS Group limited is a Hong Kong based investment holding company principally engaged in natural gas and energy-related businesses. A decisive close above 0.65 will confirm breakout from year-long H&S chart pattern.
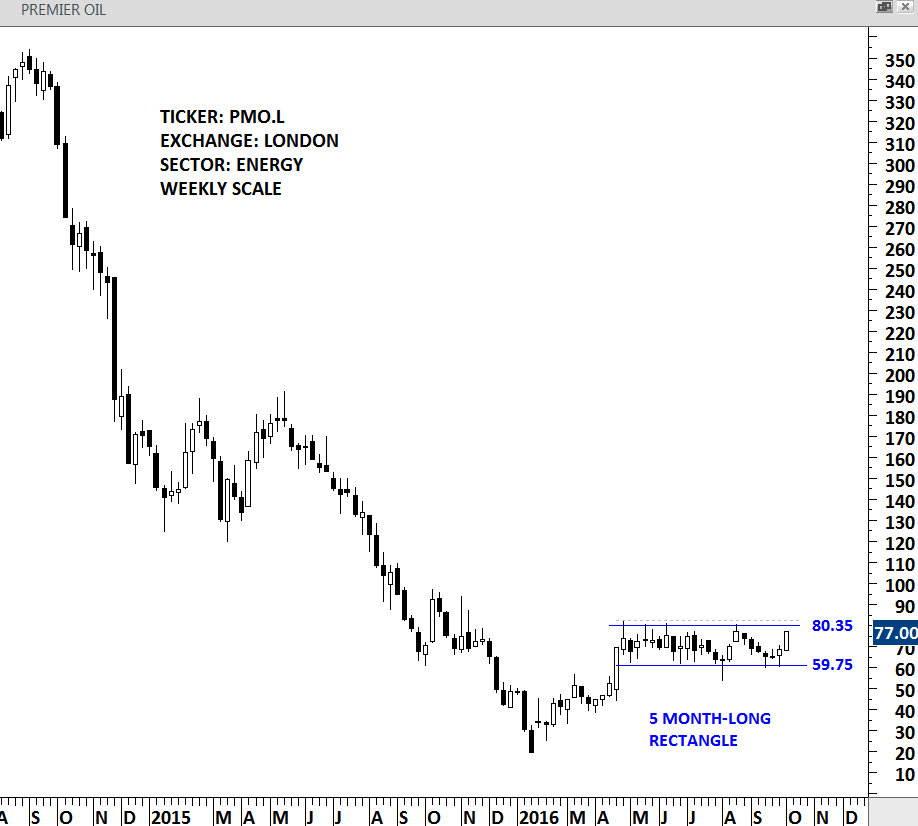
PREMIER OIL is an independent exploration and production company with oil and gas interests in the North Sea, South East Asia, Pakistan, the Falkland Islands and Latin America. The company is engaged in the business of upstream oil and gas exploration and production. Since the beginning of May 2016 the stock has been forming a rectangle (continuation) chart pattern with the boundaries between 59.75 and 80.35. A decisive close above 82.40 will confirm breakout from the 6 month-long rectangle chart pattern.
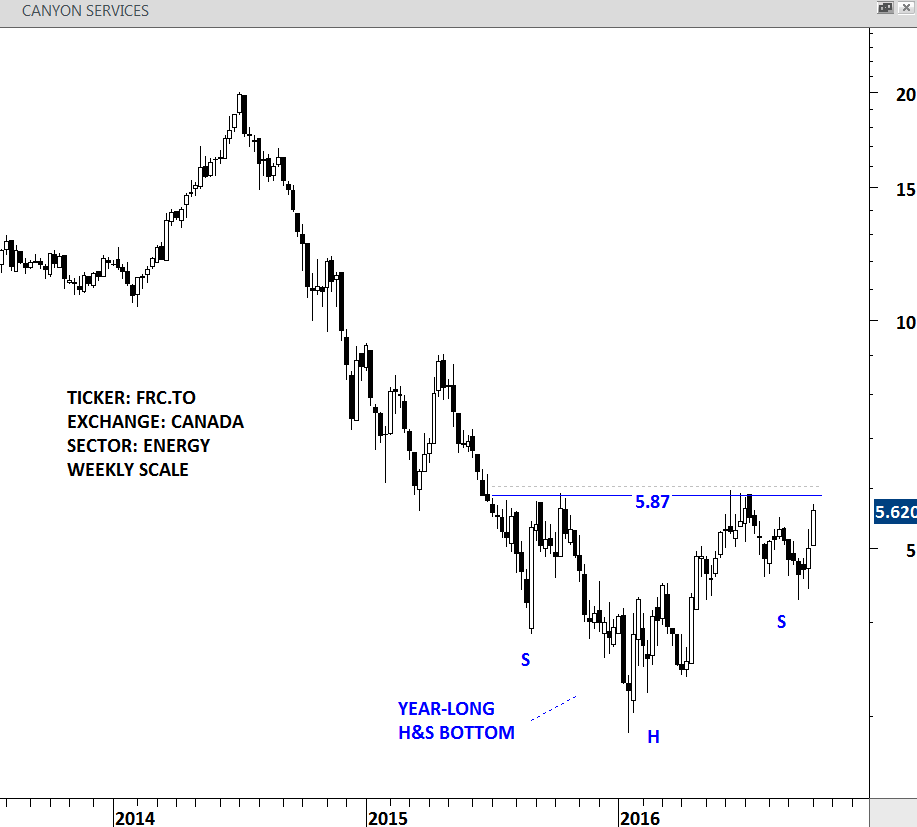
CANYON SERVICES GROUP provides stimulation and fluid management services to oil and gas exploration and production companies operating in the Western Canadian Sedimentary Basin. The company’s segments include Pressure Pumping Services and Fluid Management Services. Price chart of the, Toronto Stock Exchange listed Canyon Services has a text-book H&S bottom chart pattern. Year-long base formation has a horizontal resistance (neckline) at 5.87 levels. A decisive close above 6.05 will confirm breakout from the year-long H&S bottom.
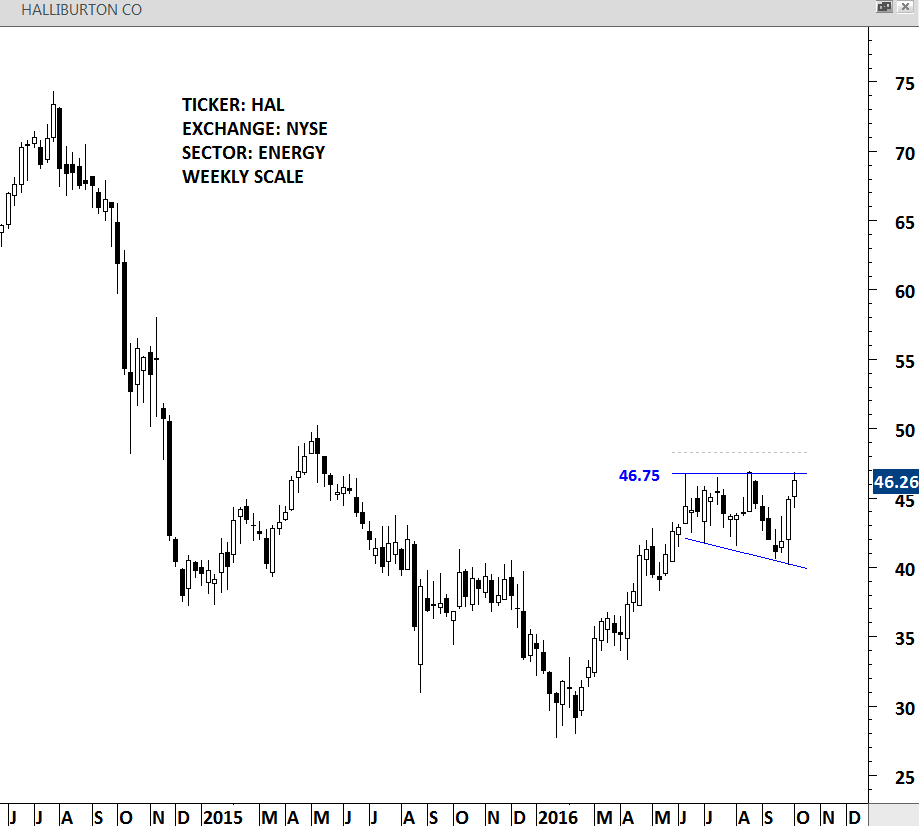
HALLIBURTON COMPANY is a provider of services and products to the upstream oil and natural gas industry. Price chart of the U.S. energy stock formed an inverted triangle with the horizontal boundary standing at 46.85 levels. Over the past 4 months, the resistance was tested 3 times. Breakout above 48.30 levels will complete the multi month consolidation.
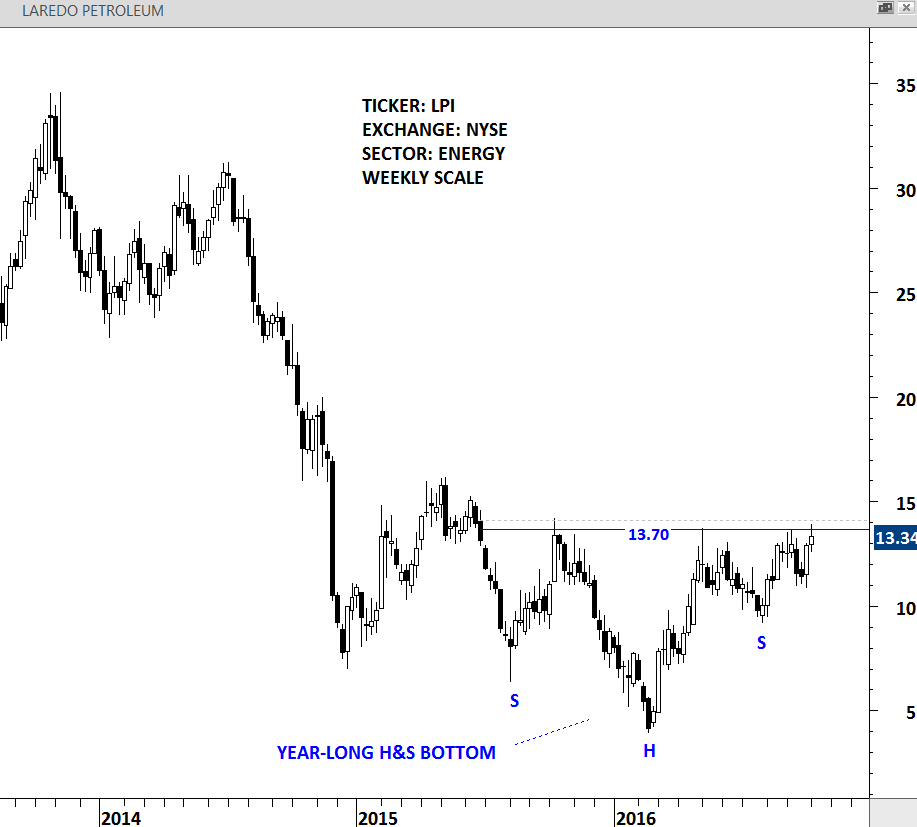
LAREDO PETROLEUM is an independent energy company focused on the acquisition, exploration and development of oil and natural gas properties, and the transportation of oil and natural gas from such properties primarily in the Permian Basin in West Texas. Price chart of Laredo Petroleum is forming a year-long H&S bottom with the neckline standing at 13.70 levels. A decisive close above 14.15 levels will confirm breakout from the bullish base formation.
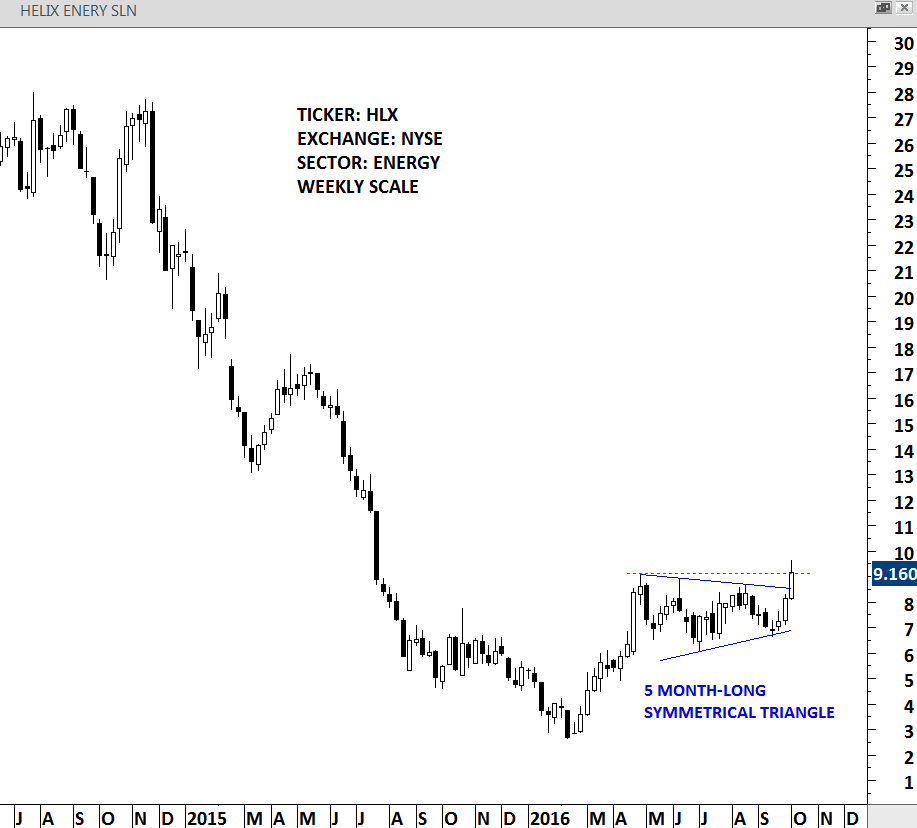
HELIX ENERGY is an international offshore energy services company. The company provides services to the offshore energy industry with a focus on well intervention and robotics operations. Price chart of HELIX ENERGY formed a 5 month-long symmetrical triangle. Breakout is underway with the strong weekly close of last week’s price action.
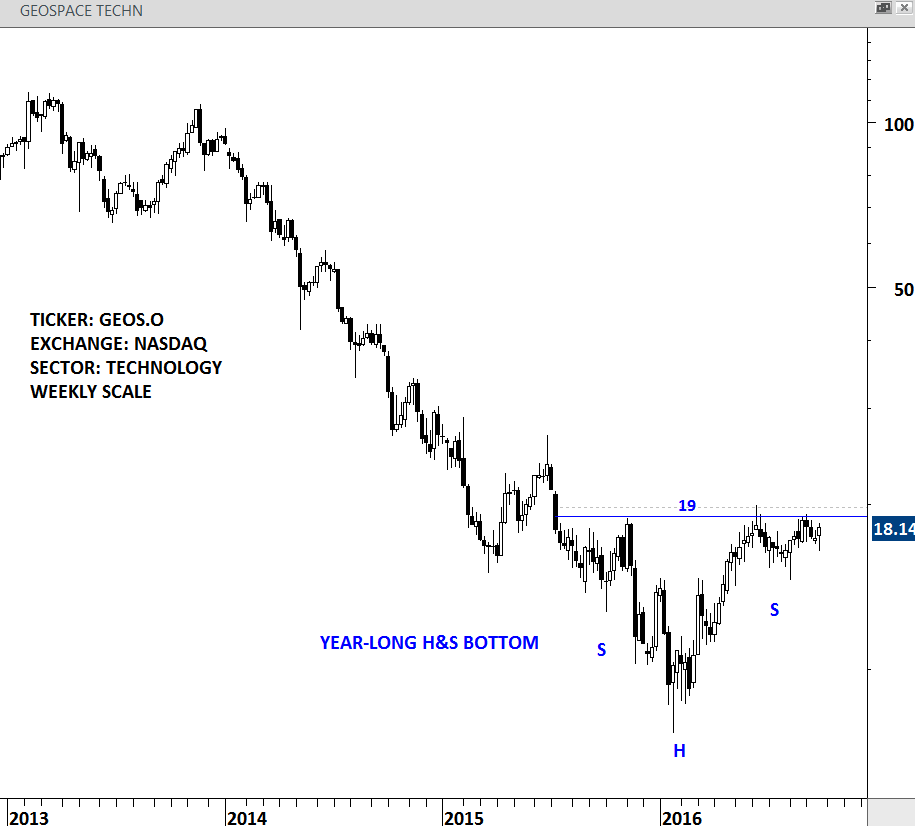
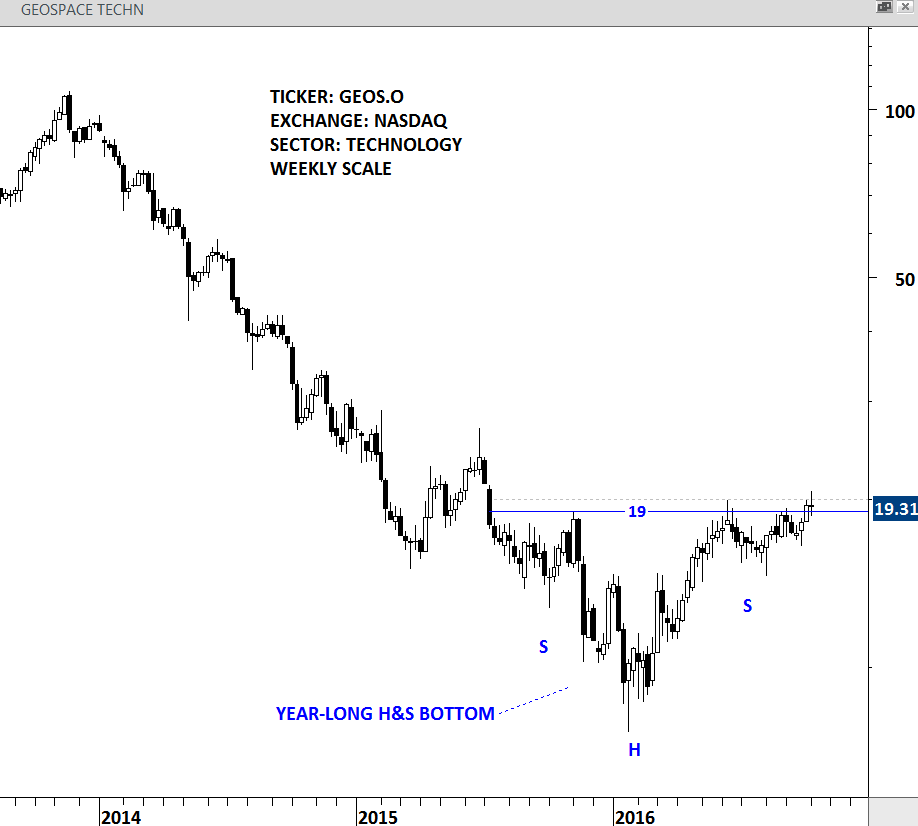
GEOSPACE TECHNOLOGIES CORP designs and manufactures instruments and equipment used in the oil and gas industry to acquire seismic data in order to locate, characterize and monitor hydrocarbon producing reservoirs. GEOSPACE TECHNOLOGIES formed a year-long H&S bottom with the neckline standing at 19 levels. A decisive close above 20 levels will confirm breakout from the multi-month bullish chart pattern.
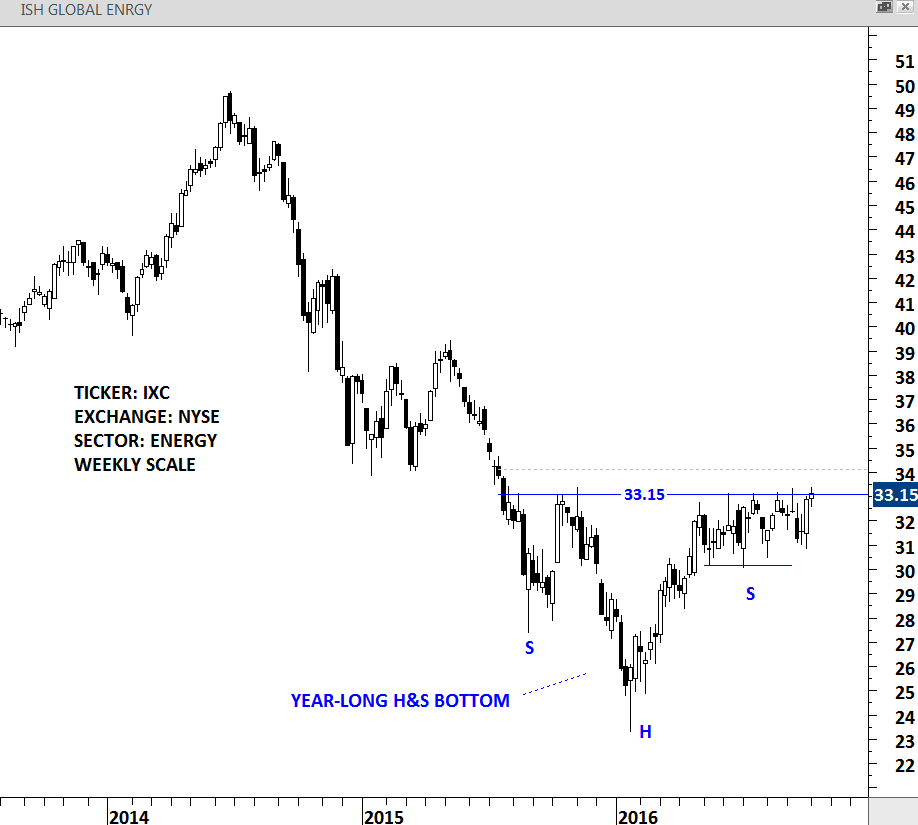
ISHARE GLOBAL ENERGY ETF is an exchange traded fund listed in the NYSE. The price chart of the energy ETF has a similar year-long H&S bottom with the neckline standing at 33.15 levels. A decisive close above 34.10 will confirm breakout from the multi-month base formation. The right shoulder of the H&S bottom can be identified as a rectangle with the boundaries standing at 30.50 and 33.15.