WTI CRUDE OIL

The chart above shows the continuous contract for Light Crude Oil. 200 day moving average and last 6 month’s downward trend (green line) are both strong resistance at $93 level. Light Crude formed a bearish wedge that could give way to another leg of sell-off towards $70-$75 range. Rebound has been weak and choppy which a clear pullback to the previously broken 200 day moving average. Unless we see a sharp recovery above $93 level we should expect lower prices on crude oil.

ROUGH RICE

Head and Shoulder is a common technical analysis chart pattern that helps us identify major reversals. An inverted H&S would signal a base formation and should be regarded as a bullish development on the price chart. While H&S top is a bearish chart pattern that signals further weakness in price. Rough Rice which lagged most of the agricultural commodities’ performance during 2009-2010 period might be forming an inverted H&S pattern. 16 level was critical resistance and Rough Rice broke above this in the last one month. If July-August period is a pullback to the broken resistance at 16 level, Rough Rice should resume its uptrend in the following weeks. First short-term target is at 20.50 and the calculated possible H&S formation price target is at 27.50. Failure to hold above 16 level will change the positive technical outlook to neutral/negative.

S&P GSCI (COMMODITY INDEX)

In the last two weeks we have seen sharp sell-off in commodities and equities. Some asset classes were hit harder than the others. I’ve adjusted my trend channel on the commodity index. 200 day moving average is now short/intermediate term resistance at 660 level. On the weekly scale the commodity index rebounded from the lower boundary of the last 2 year’s trend channel and closed the week at the highest level. Uptrend is still intact and for the intermediate term uptrend to resume in the following weeks GSCI should hold above 600-650 range. It is important to note that RSI is still above 40 level (positive).

U.S. Unemployment Rate (%)


Will the unemployment rate in U.S. decline towards 6% in the following years? Here is a quote from Warren Buffett: “The U.S. unemployment rate could fall to as low as 6% within a few years. In an interview on Bloomberg TV, Buffett said the U.S. will come back big time on employment when residential construction recovers. An unemployment rate of 6% is possible within a few years.”

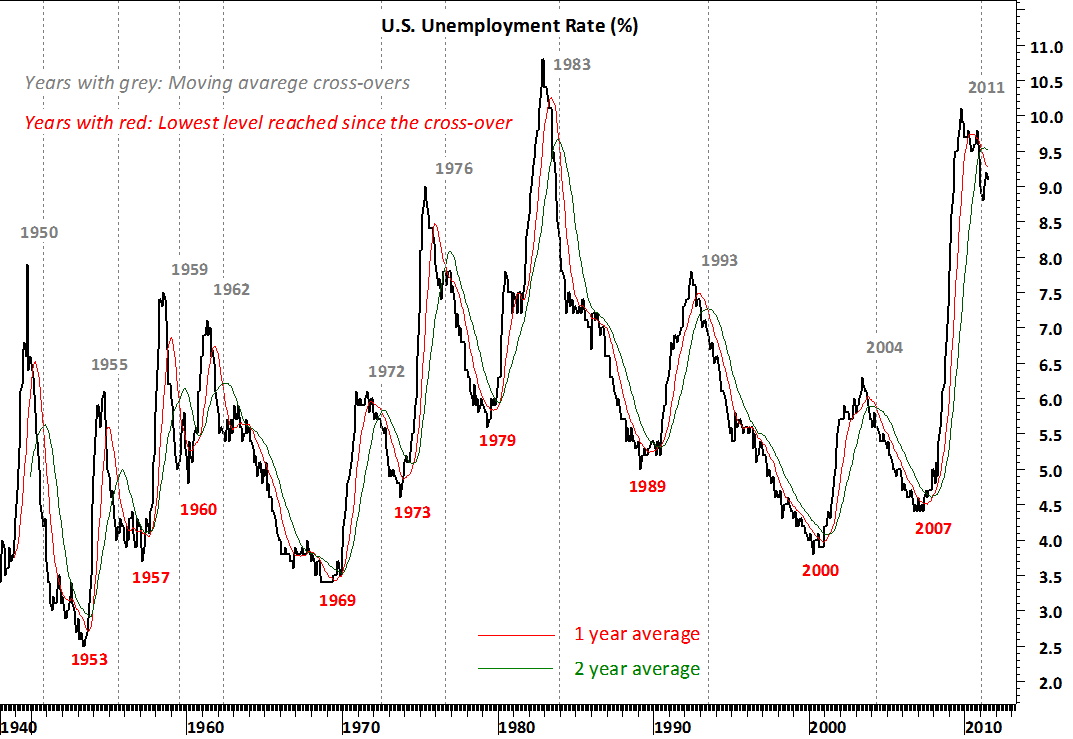
In this update I’m trying to understand and analyze the past behavior of the unemployment rate in the U.S. I’m using 1 & 2 year simple moving averages of the monthly data since 1948. The chart shows the years in grey color when moving averages crossed over (started a down trend in unemployment) and the years in red color when unemployment rate reached a low.  Out of 9 cross-overs in the past six decade, 2 were short-lived and downtrend in unemployment rate reversed in the following year after the cross-over. These were during 1959-1960 and 1972-1973. After mild recoveries in the unemployment rate, economic outlook weakened and rate moved higher.

However, of the remaining 7 cross-overs in the past six decade, unemployment continued to decline for a minimum of 2 years and maximum of 7 years. Latest cross-over occurred in the beginning of 2011. If history is a guide in the worst case  unemployment rate can continue lower for another year until 2012. In the best case we are headed towards 6% levels in the next 3-7 years.

US 10 YR T-NOTES

Here is a chart of US 10 Year Treasury Notes. The chart is plotted on a weekly scale and analyzes the past decade. Long term trend lines worked perfect. In the second half of 2007 T-Notes broke out of a four-year long downtrend at 108 level and rallied towards 120 and then towards 130 level. Since the beginning of 2009, 10 YR T-NOTES price has been consolidating in a long-term range. We are now close to the upper boundary of this range which is at 126 level. This is a strong resistance and should stop the treasury rally for some time. We will keep a close eye on this long-term pattern and watch for a possible breakout. What we need to know for now is: “strong resistance is ahead…”

DOW JONES INDUSTRIAL AVERGAE

This chart shows the Dow Jones Industrial Average on a weekly scale. I’ve been reading analysis of the US indices forming a possible H&S top or going through a distribution phase that could reverse the uptrend. I believe Dow Jones Industrial Average is forming a sideways consolidation range. Symmetrical triangle or a contracting range should be regarded as a bullish set-up for the index. It is important to note that DJIA is still holding above its 200 day moving average (red-line). I believe the uptrend is still intact and the 5 month-long consolidation could resolve with an upward breakout. Strong support is at 11,900 level for the Dow Jones Industrial Average. A break below this level will breach both the 200 day moving average and the lower boundary of the intermediate term consolidation range.

S&P GSCI (COMMODITY INDEX)

The chart above shows the Goldman Sachs Commodity Index for the past 5 years. Different from other updates on this post I wanted to show that the uptrend in commodities is still intact and continues in a clear parallel trend channel. In the last few months we have seen commodities pulling back to their 200 day moving averages and finding support. This was a mean-reversion and it might be over. 650 level will be strong support in the following months (lower boundary of the trend channel and the 200 day moving average). Uptrend is still intact and could target 800 levels.