
CHINA SSE 5O INDEX
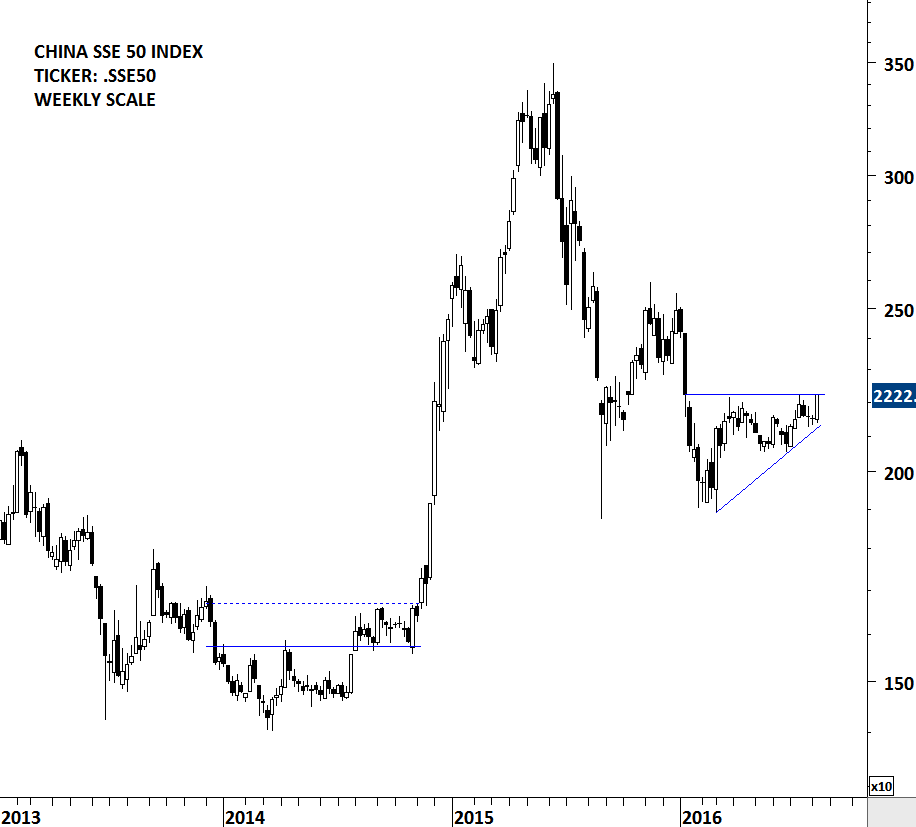
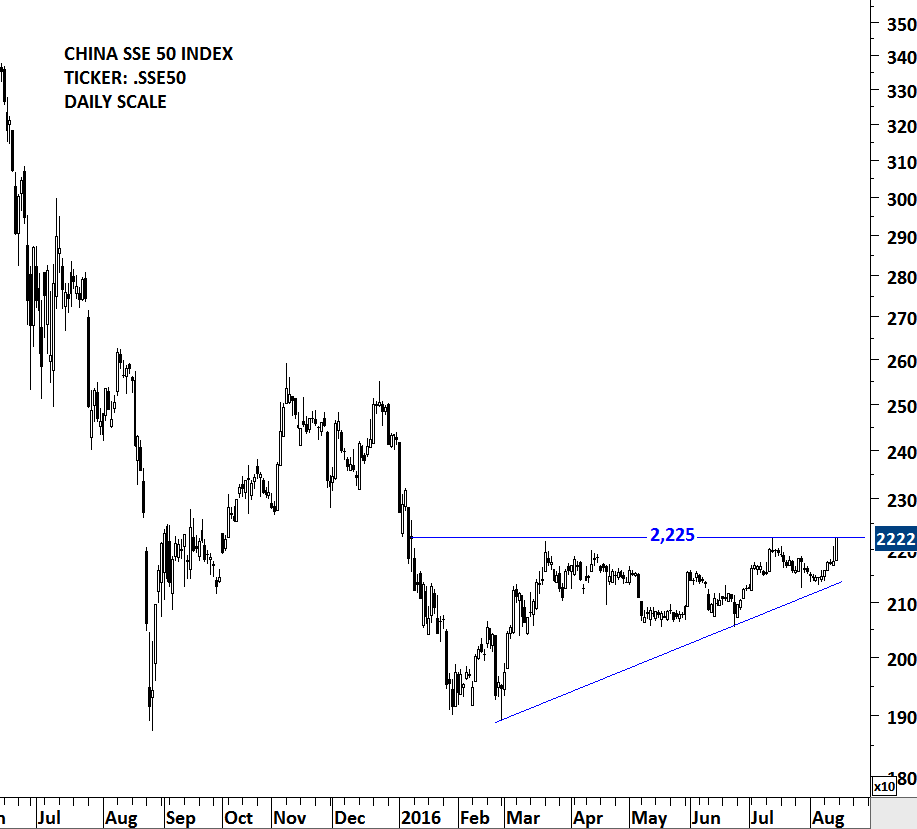
Chinese equities might be on the verge of a strong breakout. This week’s price action pushed the SSE 50 Index to the horizontal resistance at 2,225 levels. Since the beginning of 2016, SSE 50 has been recording higher lows, a bullish signal. Another week of strong price action can clear the 8 month-long resistance and push the index towards 2,500 levels. Volatility is low both on the daily and weekly charts suggesting a trend period might develop after a decisive breakout.
There are several bullish chart set-ups in Hong Kong listed securities. I share below some of the clear chart patterns that are likely to resolve on the upside if we see a breakout on the Chinese benchmark equity index.
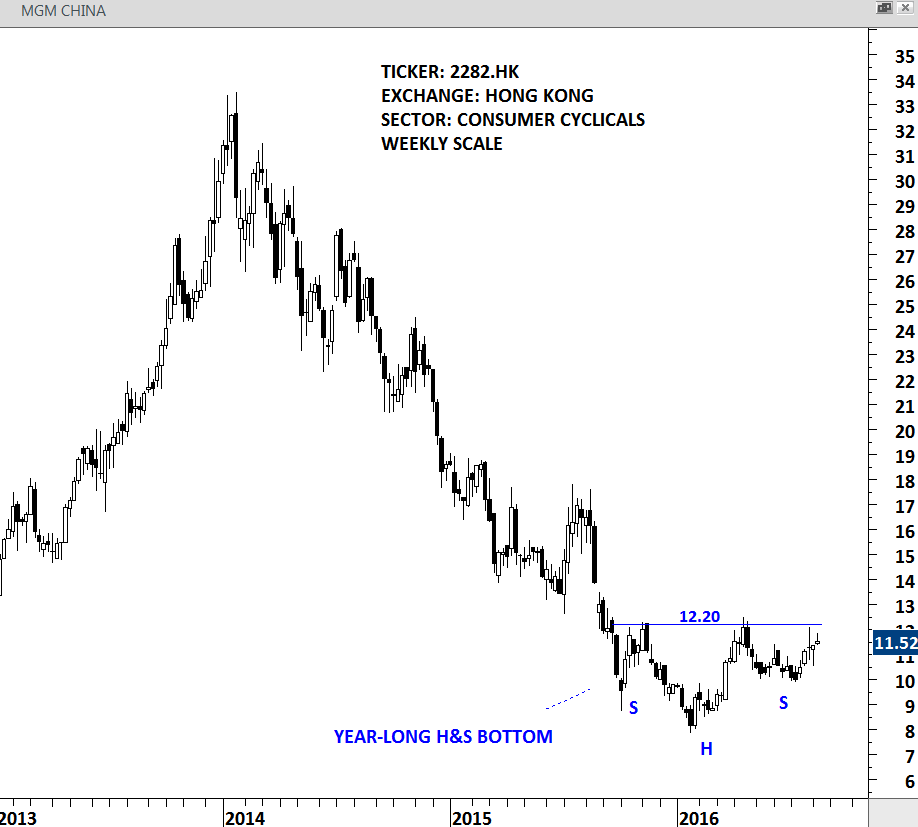
MGM CHINA formed a year-long H&S bottom, a bullish reversal chart pattern, with the neckline standing at 12.20 levels. Breakout above 12.20 can push the stock higher to test 17-18 area.
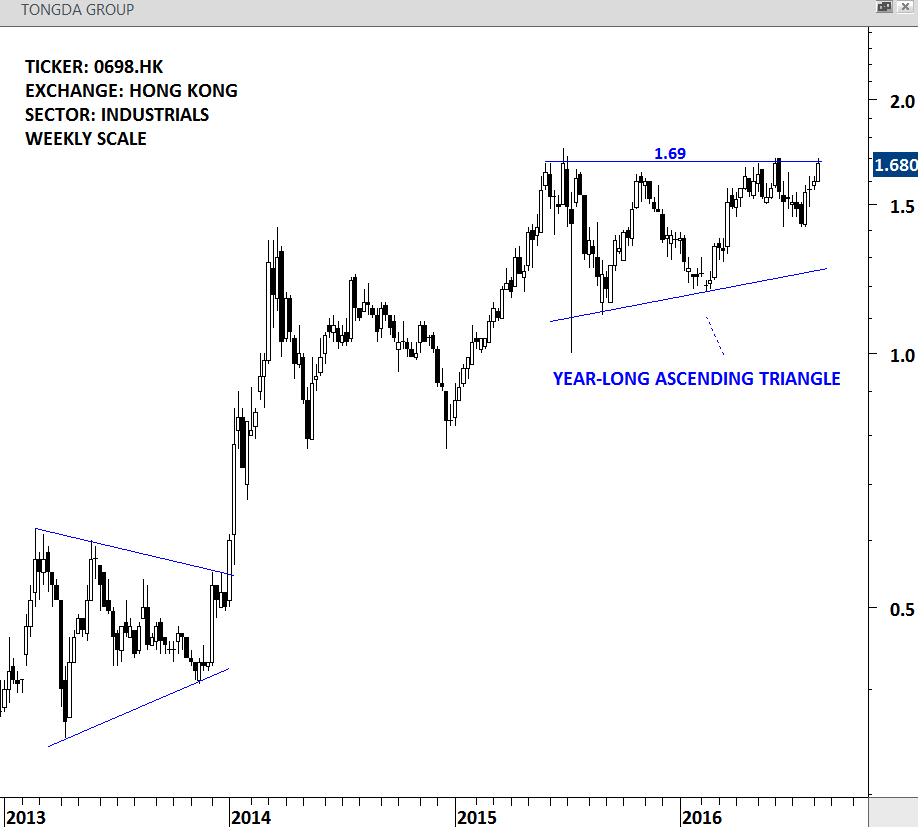
TONGDA GROUP formed a year-long ascending triangle, a bullish continuation chart pattern, with the strong horizontal resistance standing at 1.69. Breakout above 1.69 can push prices towards 2.0 levels.
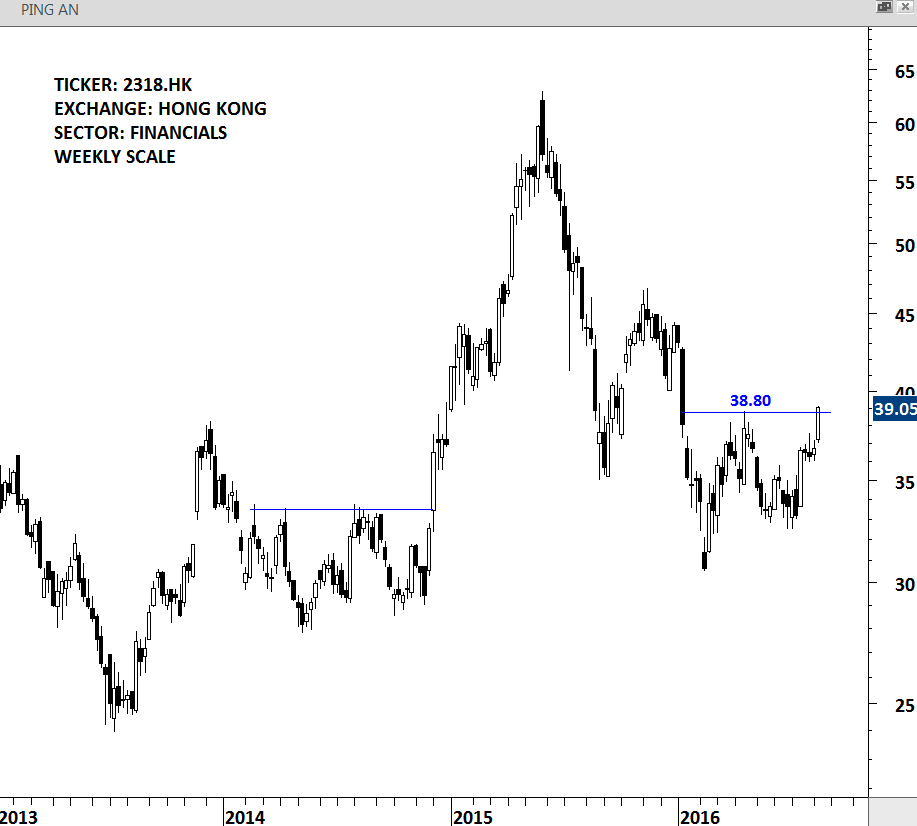
PING AN is now testing the horizontal resistance at 38.80. Stock closed slightly above the resistance. However, this week’s price action will confirm the breakout. Another strong weekly close will complete the multi-month base formation.
Note: According to Edwards and Magee, a daily close above the resistance by a 3% margin is required to confirm a breakout. I follow this approach to confirm a breakout.