Posts

GLOBAL EQUITY MARKETS – May 18, 2019

REVIEW


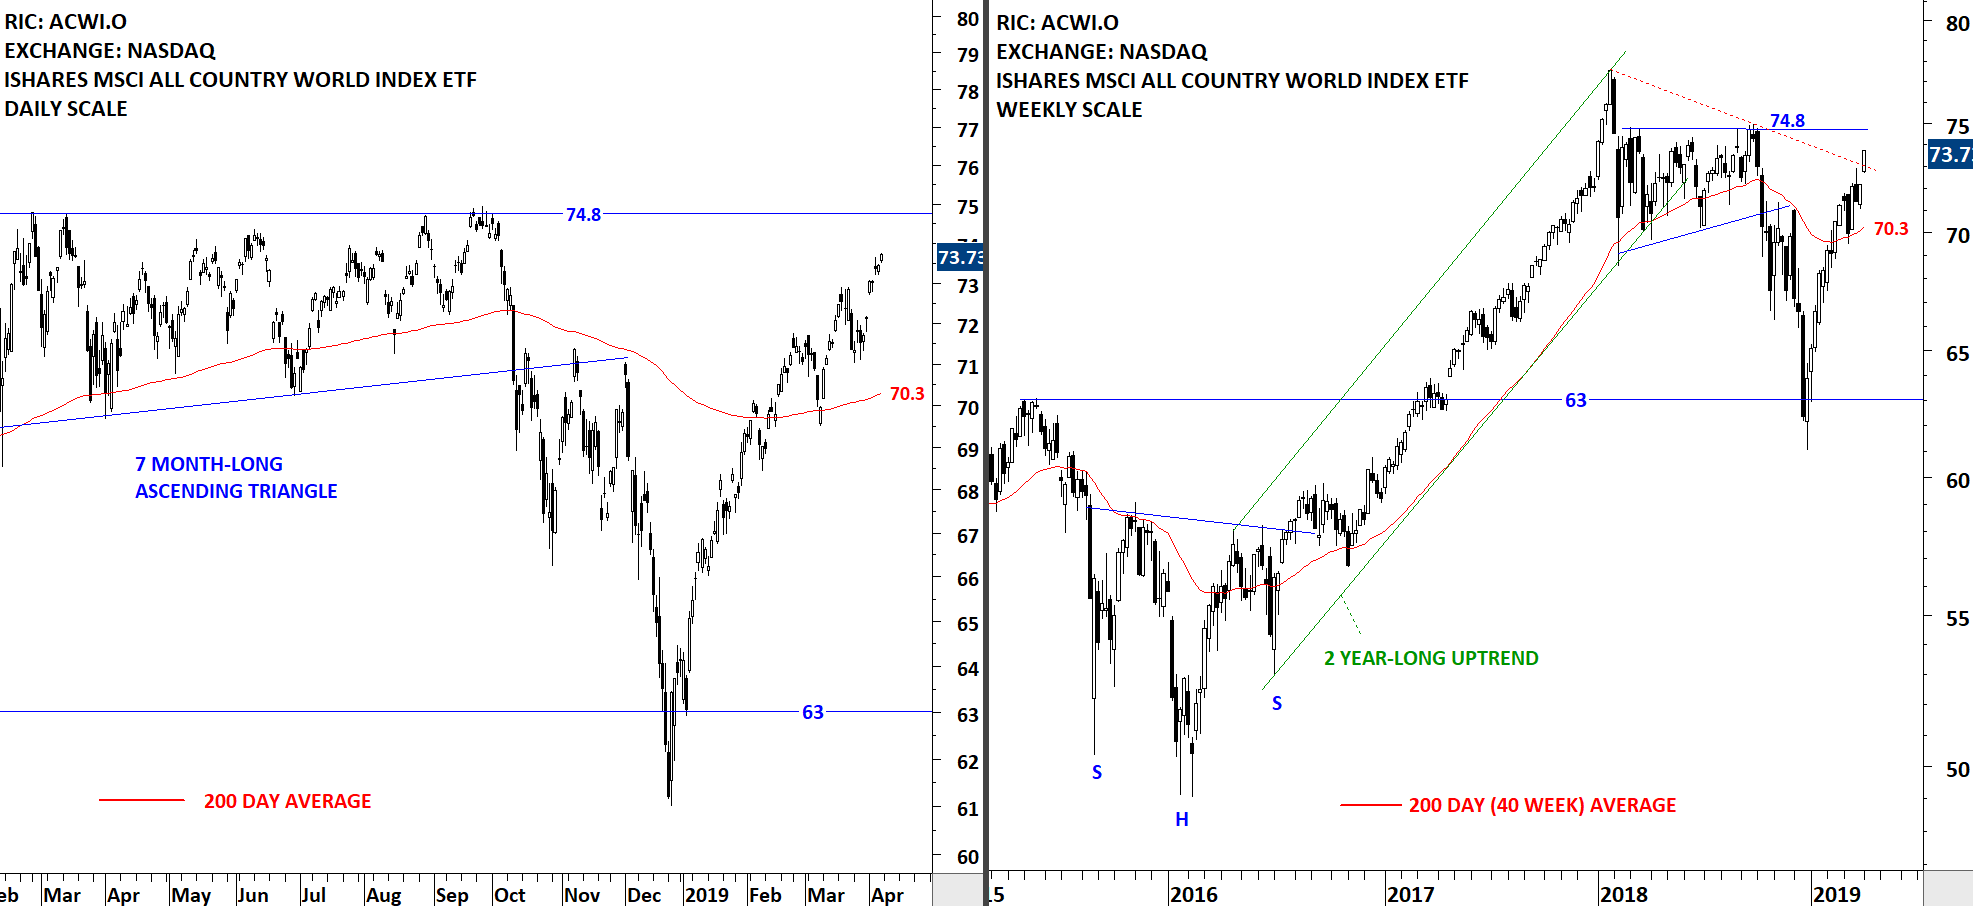
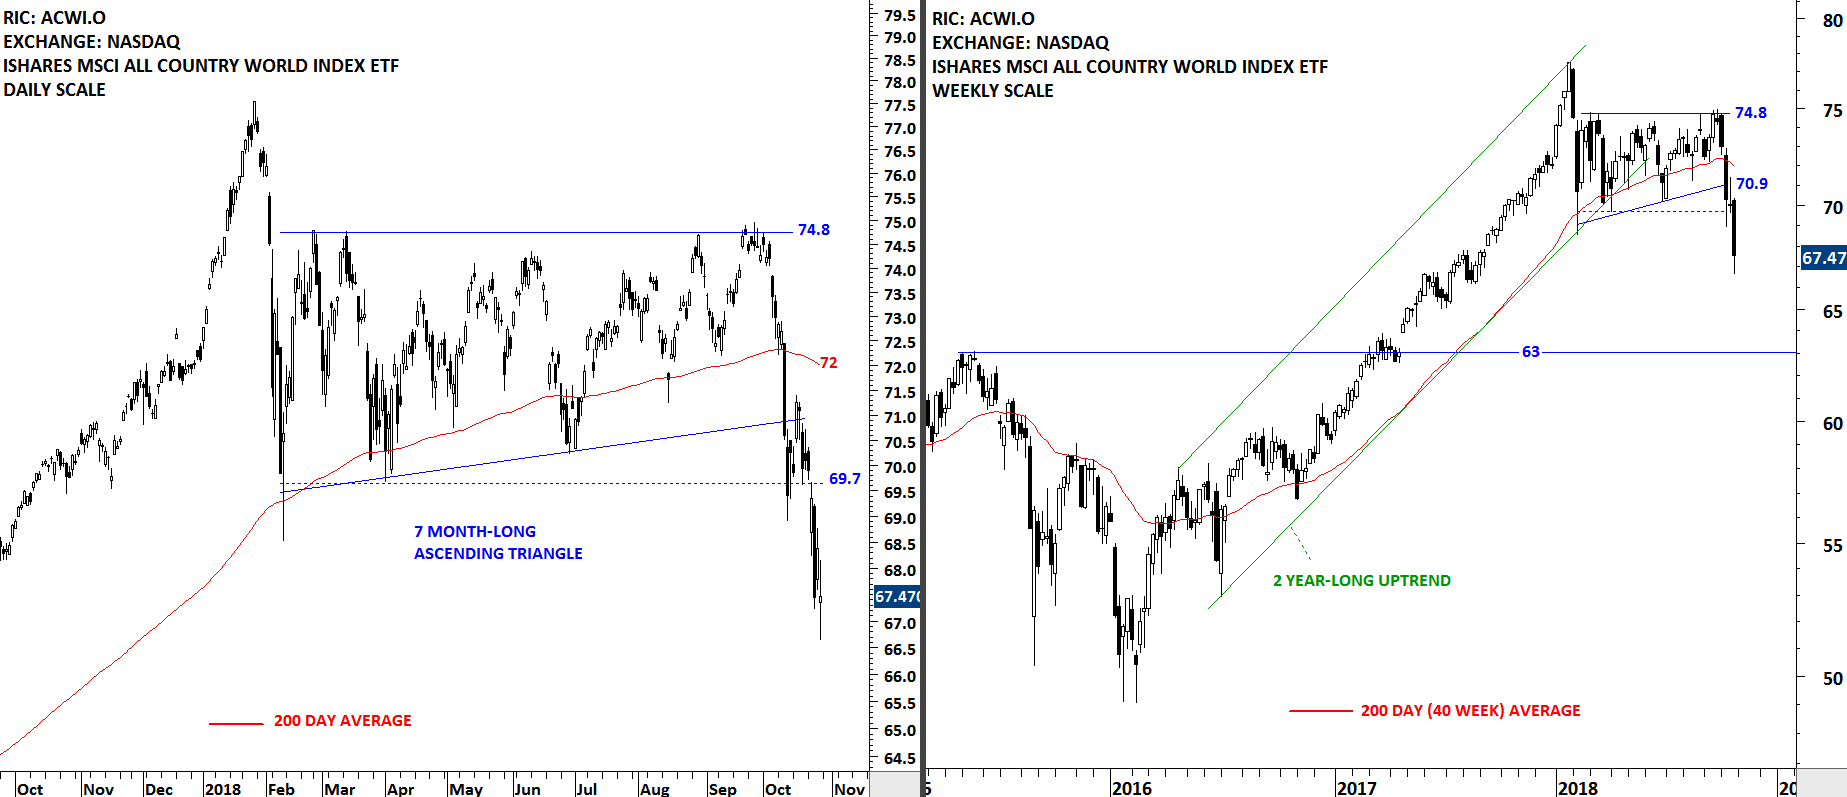
The benchmark for the Global equity markets performance, the iShares MSCI All Country World Index ETF (ACWI.O), pulled back from the strong resistance at 74.8 levels. During the week price tested the long-term 200-day average at 71 levels and rebounded. For now we can conclude that the 200-day average acted as support. In the following weeks I will monitor the price action around the average. Failure to hold above 71 levels can result in a larger scale correction. The daily scale price chart can form a short-term H&S top. Both the neckline of the possible H&S top and the 200-day moving average are overlapping at the same level (71). In the short-term, as long as the price remains above 71 support, ACWI ETF is expected to trade between 71 and 74.8 levels.

Read More

GLOBAL EQUITY MARKETS – April 6, 2019

REVIEW


The benchmark for Global equity markets performance, the iShares MSCI All Country World Index ETF (ACWI.O) continues to remain strong. The ETF had a strong rebound from support at 63 levels and since then the uptrend resumed without any significant setback. In February the ETF cleared its 200-day moving average and continues to trend above its long-term average. In the short-term horizontal resistance at 74.8 levels can act as an overhead supply. Strong support is the 200-day average at 70.3 levels.

Read More

GLOBAL EQUITY MARKETS – October 27, 2018

REVIEW


The benchmark for Global equity markets performance, iShares MSCI All Country World Index ETF (ACWI.O) broke down its February lows with a long weekly candle. The ACWI ETF is now clearly below its long-term 200-day moving average. February low at 69.7 levels will become the new strong resistance. Next support area for the ACWI ETF is between 63 and 65. In the short-term the daily chart needs to form some sort of a reversal chart pattern to conclude that the downtrend is over. The iShares MSCI All Country World Index ETF (ACWI.O) is in a downtrend.

Read More

GLOBAL EQUITY MARKETS – May 27, 2017

Dear Tech Charts members,

Thank you for joining Tech Charts as Founding Member. I hope to identify many great chart set-ups, trading & investment themes and add value to your decision making process in the years ahead. This week's Global Equity Markets report covers several ETFs from different regions, single stocks from Developed and Emerging countries and equity indices. You will find that some of the themes are longer-term and can offer great opportunity once these chart patterns are resolved on the upside. In this report I also added a section that explains what each label on the charts and section headers stand for. I hope this will make it easier to navigate through the charts.

  Read More

HONG KONG and CHINA

China and Hong Kong listed equities had a strong performance over the past week. Hang Seng index rebounded from its 200 day average and the lower boundary of its possible 8 month-long upward trend channel. China SSE Composite index resumed higher trading above its 200 day average after clearing the horizontal resistance at 3,100 levels. Both Hang Seng index and China SSE Composite index can help emerging markets to gain strength in the coming weeks.

SSE COMPOSITE INDEX weekly scale price chart

SSE COMPOSITE INDEX weekly scale price chart

HANG SENG INDEX weekly scale price chart

HANG SENG INDEX weekly scale price chart

A new chart pattern breakout signal is triggered with a strong weekly close on the Hong Kong listed SHUN TAK HOLDING. Price chart of the stock completed a year-long text book H&S bottom. White long candlestick on the weekly scale chart not only cleared the year-long horizontal resistance but also recorded a high volume adding to the strength of the weekly scale breakout. H&S bottom chart pattern price target stands at 3.35 levels. A stop-loss is placed at 2.70 levels, slightly below the horizontal resistance (neckline). Tech Charts twitter followers can find all past breakout signals under the hashtag #TECHCHARTSALERT

SHUN TAK HOLDING weekly scale price chart

SHUN TAK HOLDING weekly scale price chart

SHUN TAK HOLDING daily scale price chart

SHUN TAK HOLDING daily scale price chart

Two stock charts are preparing for a long-term change in trend. Both names are in the Tech Charts watchlist. Breakout on these securities will trigger a chart pattern breakout signal and will be considered for possible long trades. Tech Charts twitter followers can find stocks that are in the watchlist under the hashtag #TECHCHARTSWATCHLIST China Galaxy Securities is a financial company listed in Hong Kong. The stock price is forming a year-long ascending triangle with the strong horizontal resistance standing at 8.10 levels. Breakout above 8.10 can confirm the ascending triangle as a reversal and suggest higher levels. Kingston Financial is also listed in Hong Kong. Stock price is challenging the upper boundary of a year-long symmetrical triangle. Breakout above 3.75 levels can start a new uptrend.

CGS weekly scale price chart

CGS weekly scale price chart

KINGSTON FINANCIAL weekly scale price chart

KINGSTON FINANCIAL weekly scale price chart

CHINA SSE 5O INDEX

Chinese equities might be on the verge of a strong breakout. This week’s price action pushed the SSE 50 Index to the horizontal resistance at 2,225 levels. Since the beginning of 2016, SSE 50 has been recording higher lows, a bullish signal. Another week of strong price action can clear the 8 month-long resistance and push the index towards 2,500 levels. Volatility is low both on the daily and weekly charts suggesting a trend period might develop after a decisive breakout.

CHINA SSE 50 INDEX W

CHINA SSE 50 INDEX D

There are several bullish chart set-ups in Hong Kong listed securities. I share below some of the clear chart patterns that are likely to resolve on the upside if we see a breakout on the Chinese benchmark equity index.

MGM CHINA

MGM CHINA formed a year-long H&S bottom, a bullish reversal chart pattern, with the neckline standing at 12.20 levels. Breakout above 12.20 can push the stock higher to test 17-18 area.

TONGDA GROUP

TONGDA GROUP formed a year-long ascending triangle, a bullish continuation chart pattern, with the strong horizontal resistance standing at 1.69. Breakout above 1.69 can push prices towards 2.0 levels.

PING AN

PING AN is now testing the horizontal resistance at 38.80. Stock closed slightly above the resistance. However, this week’s price action will confirm the breakout. Another strong weekly close will complete the multi-month base formation.

Note: According to Edwards and Magee, a daily close above the resistance by a 3% margin is required to confirm a breakout. I follow this approach to confirm a breakout.

CHINA SSE 50 INDEX & CHINA GDP

Yesterday markets were strong with the expectation of a better than expected Chinese GDP data for the Q1. Today markets were disappointed by the worse than expected data at 8.1% for the quarter. Expectation was around 8.3%-8.5% but 8.1% growth was clearly below expectations. Q4 2011 growth was at 8.9%. This is the lowest growth in almost 3 years and from the chart below you can see the downtrend over the past three years.

In this post I’m analyzing the China SSE 50 Index and the quarterly GDP growth for China. The two charts are self illustrative with their correlation and trending periods. Downtrends on the equity markets were accompanied by lower growth and vice versa. Major trend reversals (in this case price breaking above/below long-term moving average) on the equity index was a good indicator and confirmation of better/worse GDP growth.

Given that the SSE 50 Index is trending lower in a clear parallel trend channel since mid-2009, expecting a downward trend on GDP is reasonable. Though anticipating a reversal on GDP is more difficult. For this reason I will use SSE 50 Index as a leading indicator or a confirming indicator to expect higher growth in the world’s second biggest economy. Both 1 year-long moving average and the upper boundary of the downward trend channel are overlapping between 1,800 and 1,900, making this area a strong resistance. Before we see SSE 50 Index breaking above this resistance we should expect weak growth. We need to see confirmation in equity markets that usually anticipates the future of the economy.