VIETNAM VN INDEX and QATAR DSM 20 INDEX

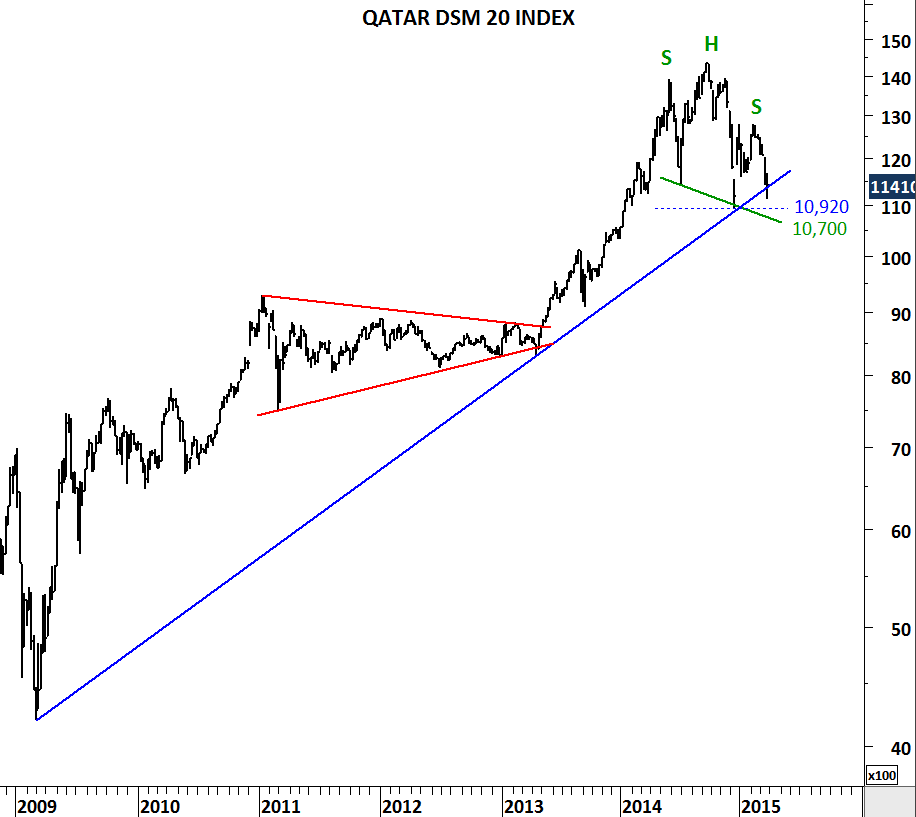
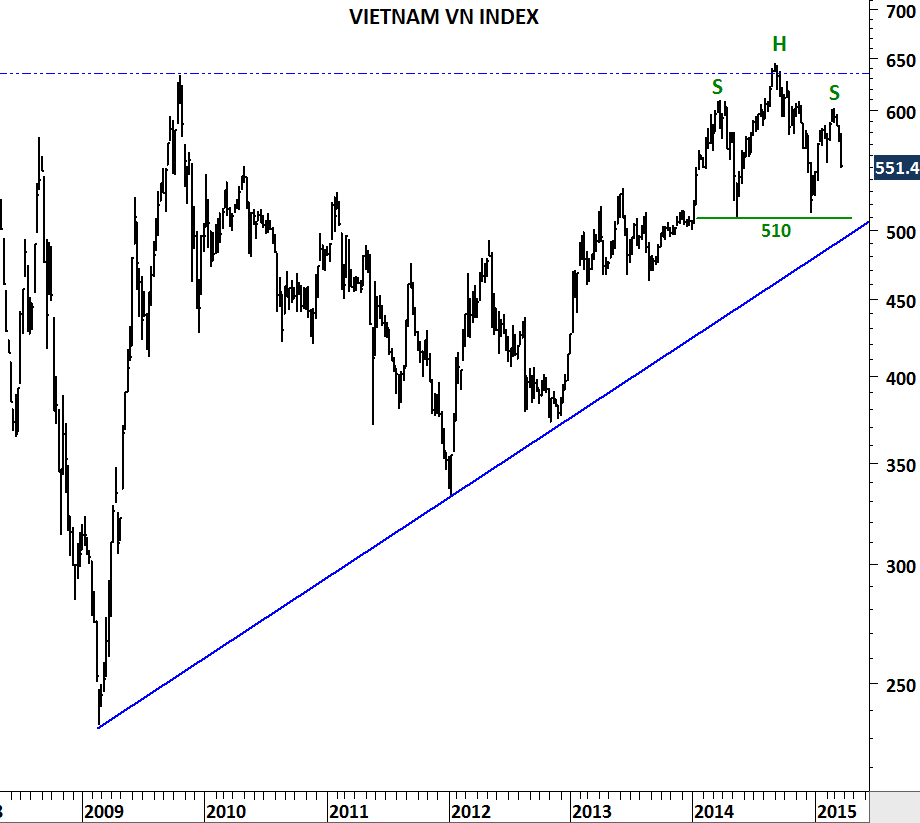
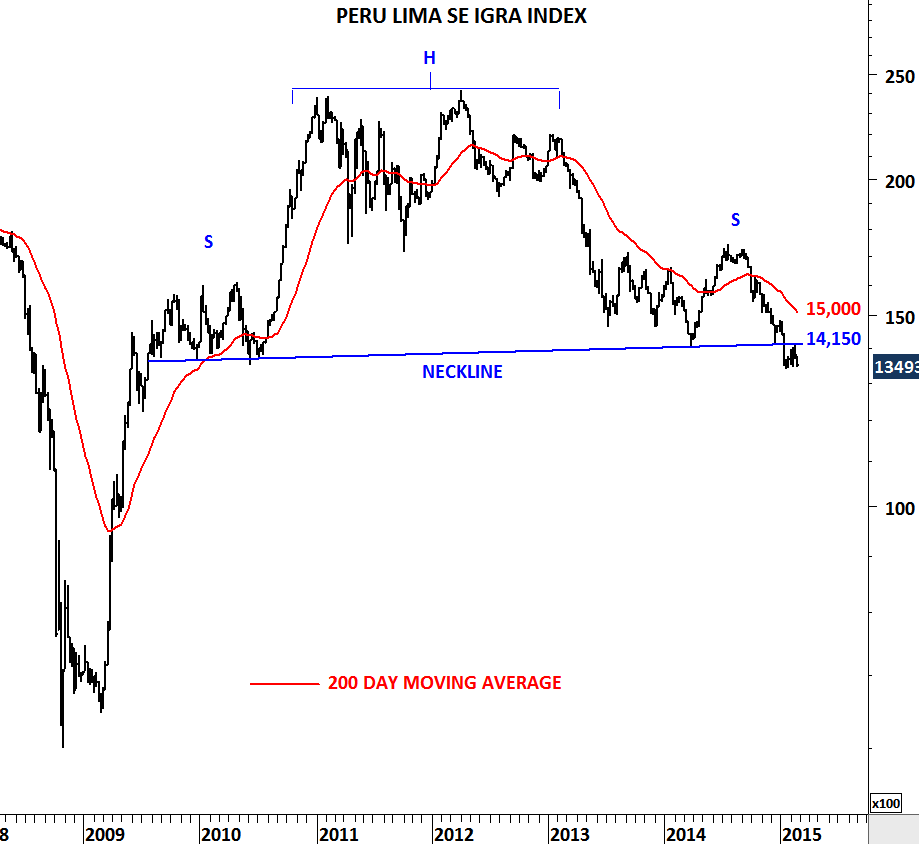
In 2014, Qatar has been upgraded to emerging market status with the United Arab Emirates. Vietnam is still in the frontier market universe. Over the past year both indices formed head and shoulder top chart patterns. Head and shoulder is a common reversal chart pattern, that usually forms after a long up/down-trend. Since the beginning of 2009, global equity markets had  strong uptrends. Some of the equity markets are now showing signs of weakness.

Qatar DSM 20 index formed a head and shoulder top with a downward sloping neckline. Downward sloping neckline is usually more negative than a horizontal neckline. Vietnam VN index has a horizontal neckline at 510 levels. Breakdown below the neckline is a confirmation of larger scale correction. For Qatar DSM 20 index breakdown below 10,700-10,920 area will signal further weakness and for Vietnam VN index, a decisive break below 510 levels will confirm the year-long head and shoulder chart pattern.

QATAR DSM 20 INDEX

VIETNAM VN INDEX

US DOLLAR/PHILIPPINE PESO

Since the beginning of 2013, emerging markets currencies performed poorly. Though one currency showed resilience over the past 2 years; Philippine Peso. During 2013 the cross-rate moved from 40.5 to 45.5 and in 2014 the performance of Philippine Peso was neutral against the U.S. dollar. Whereas during the same period most of the emerging market currencies depreciated against the dollar.

Last one year’s price action on USD/PHP is a symmetrical triangle (continuation). Chart pattern suggests possible weakness for the Peso in the coming months if the cross rate breaks above 45-45.5 area. Philippine Peso can join the weakness in emerging market currencies. Breakout above 45-45.5 area can target 48-50 range.

USDPHP

UK FTSE 100, STOXX 50, NIKKEI 225

Global equity indices are gaining upside momentum. Recent breakouts above long-term trend lines suggest multi-month uptrends. Last week’s price action pushed UK FTSE 100 index to all time high levels. Charts that are very close to long-term breakouts: MSCI ALL COUNTRIES WORLD INDEX, EURO STOXX 50 INDEX and UK FTSE 100 INDEX.

Positive price action is likely to continue in the developed market equities.

JAPAN NIKKEI 225 INDEX

Read more

PERU LIMA IGRA SE INDEX

PERU LIMA IGRA INDEX

Peru LIMA IGRA index has one of the weakest chart set-ups in the emerging market equities. Multi-year head and shoulder top has a neckline standing at 14,150 levels. Index is trading at 13,493 levels – below the multi-year support. Decisive “weekly” close below 13,360 levels (minor low in January) will confirm the downtrend towards 10,000 levels. Strong medium/long-term resistance area remains between 14,150 and 15,000. Technical outlook is negative for Peru equities.

USD/CNH (CHINESE YUAN OFFSHORE)

Here is a detailed article that explains the difference between on shore and off shore Chinese Yuan.

http://www.businessinsider.com/onshore-and-offshore-renminbi-2014-2

I am analyzing the long-term base formation on the USD/CNH (Chinese Yuan Off Shore) in this update. I think this chart is important as we start reading more about currency wars. Cup & handle is a reversal pattern. In this case it is a bullish development and suggests higher levels for USD/CNH. In other words depreciation for the Chinese Yuan. Breakout above 6.27-6.30 area will confirm the 2 year-long base formation. Until the beginning of 2015, USD/CNH had lower lows and lower highs. In the last quarter of 2014, the low formed at a higher level. This could be the beginning of a change in trend.

USDCNH

PLATINUM

PLATINUM

Commodities markets have performed poorly compared with stocks over the past 3 years. From industrial metals to agricultural commodities deflationary pressures are being felt worldwide.

Platinum prices which is almost 50% lower than 2008 historical high levels, is now testing a 15 year-long trend support. Usually prices should rebound sharply from such historical level. However, over the past four months the performance has been lackluster. Breakdown below 1,170 levels will have long-term implications and will be negative for Platinum prices. It is important to note that the next major long-term support is around 735 levels. Next few months will be extremely important for the medium/long-term trend.

CBOE VIX (VOLATILITY INDEX)

During the sharp correction in October 2014, S&P 500 index reached 1,800 levels and CBOE VIX jumped to 31 levels. VIX is often called the “fear index”. Higher levels of VIX can coincide with market corrections. Over the past 2 months CBOE VIX has been consolidating in a tight range. Consolidation can be a symmetrical triangle. Breakout from this consolidation will result in high volatility for U.S. equities. Breakout above 22.80 levels can send the VIX to 35-40 area. Breakdown below 15.52 levels will be positive for equities. I have posted the S&P 500 index futures on an inverted scale to see the price movements in sync with the VIX. Symmetrical triangle chart pattern (if it is a valid one) should resolve in the next few days/week.

CBOE VIX

S&P 500 INDEX

S&P 500 INDEX (MAR 2015) FUTURES PRICE

AUSTRIA VIENNA ATX INDEX

Austria Vienna ATX Index formed similar chart patterns in different time frames. Since 2009 the index has been consolidating in a wide range. Long-term chart pattern is a symmetrical triangle. Over the past six months, ATX index formed a short/medium-term consolidation; another symmetrical triangle. Direction of the breakout from the short-term consolidation range will be important. Breakout above 2,280 levels will push the index towards 2,500. Breakdown below 2,000-2,100 range can be very negative in the long-term.

AUSTRIA VIENNA ATX INDEX

CBOE VIX (VOLATILITY INDEX)

Volatility can move higher in the following months if we see a decisive weekly close above 22 levels. In the last two years CBOE VIX consolidated in a range between 11 and 22. Six year-long downward trend line and the upper boundary of the horizontal consolidation range meet at 22 levels. A decisive break above 22 levels can result in a sharp upward move towards 40-45 area. Such price action will be bearish for global equity markets. It is important to keep a close eye on this chart development in the next few months.

CBOE VIX

Chart is plotted on a weekly scale and closing prices are taken into consideration.

MSCI EMERGING MARKETS INDEX

Strong trends usually emerge from low volatility periods. Low volatility reading on long-term charts is more significant. MSCI Emerging Markets index is getting closer to a strong directional movement after the band width reached multi-decade low level. Index is now in a tight range between 910 and 1,100 levels. Breakout in either direction will result in a strong move. Last two year’s choppy sideways trading is a sign of weakness. Though, I would wait for a decisive close above or below the mentioned levels.

MSCI EMERGING MARKETS INDEX