KUWAIT, NIGERIA and SAUDI ARABIA
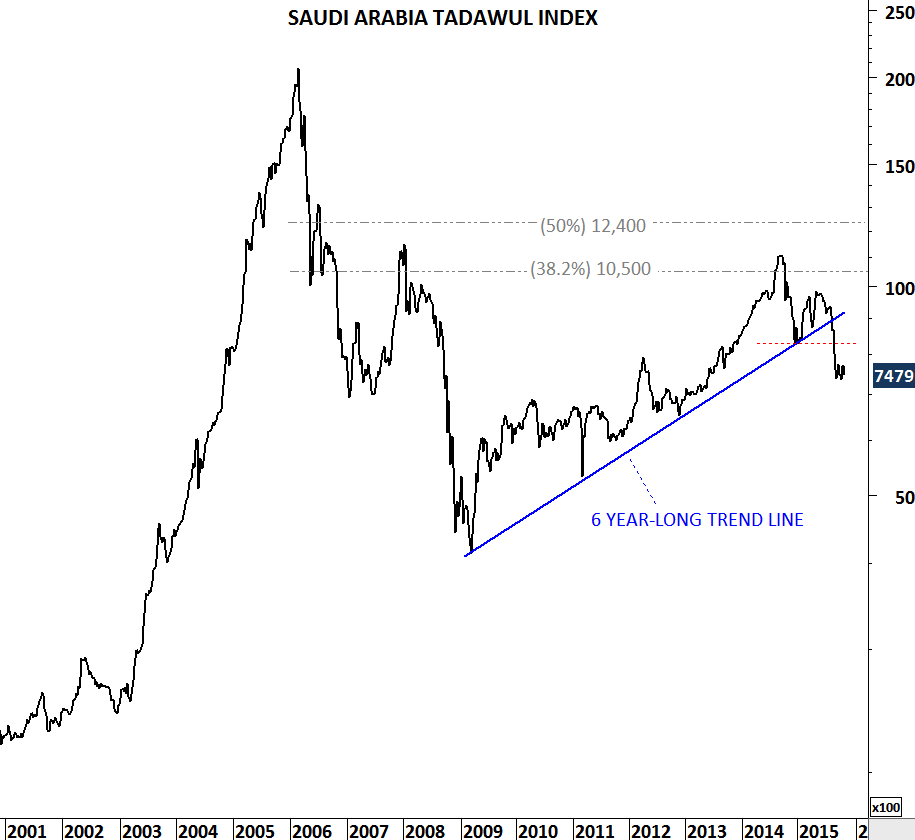
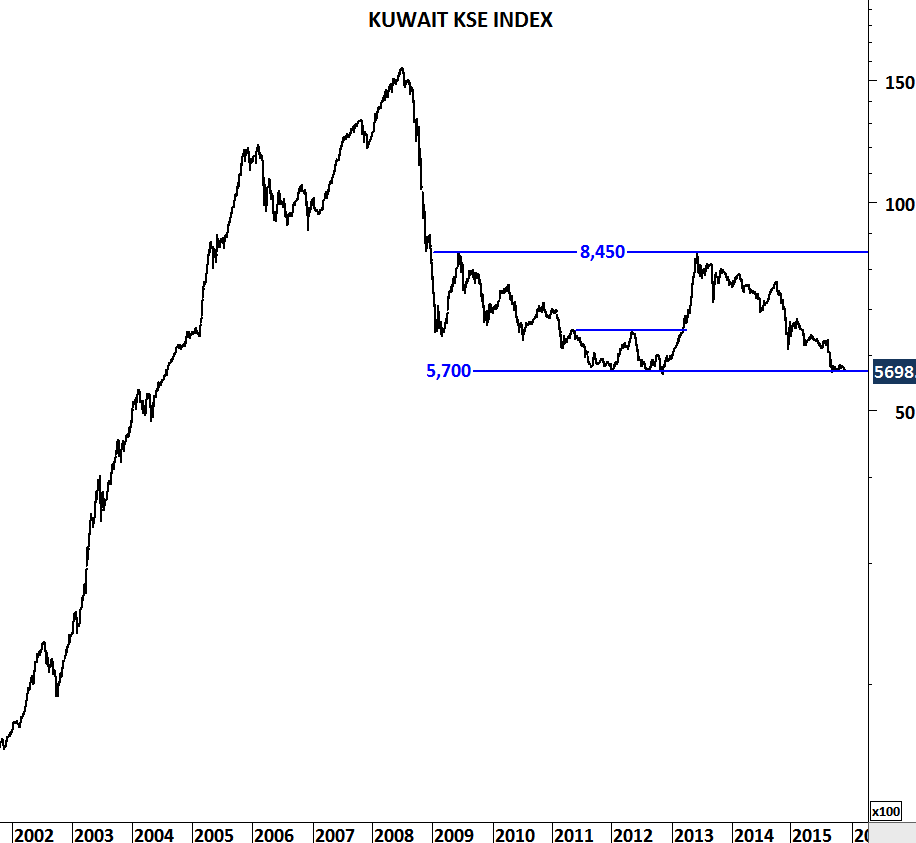
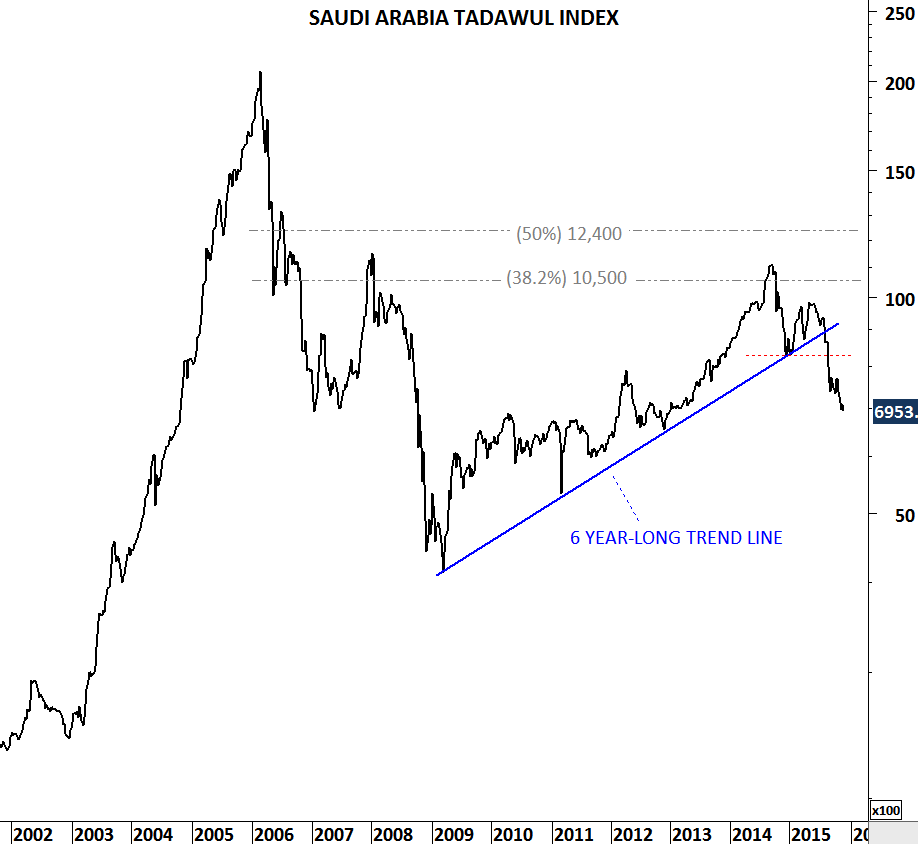
Weak energy prices are putting pressure on oil exporting economies. Kuwait and Nigeria are two of the large weights in the MSCI Frontier Markets index. Both countries indices are testing critical long-term support levels. Already weak stock market performance can continue in the following months if there are further breakdowns. Saudi Arabia, another major oil exporter broke down its 6 year-long trend support.
Kuwait KSE Index is testing strong long-term support at 5,700 levels. Breakdown below 5,700 will push the index towards 4,500-5,000 area.
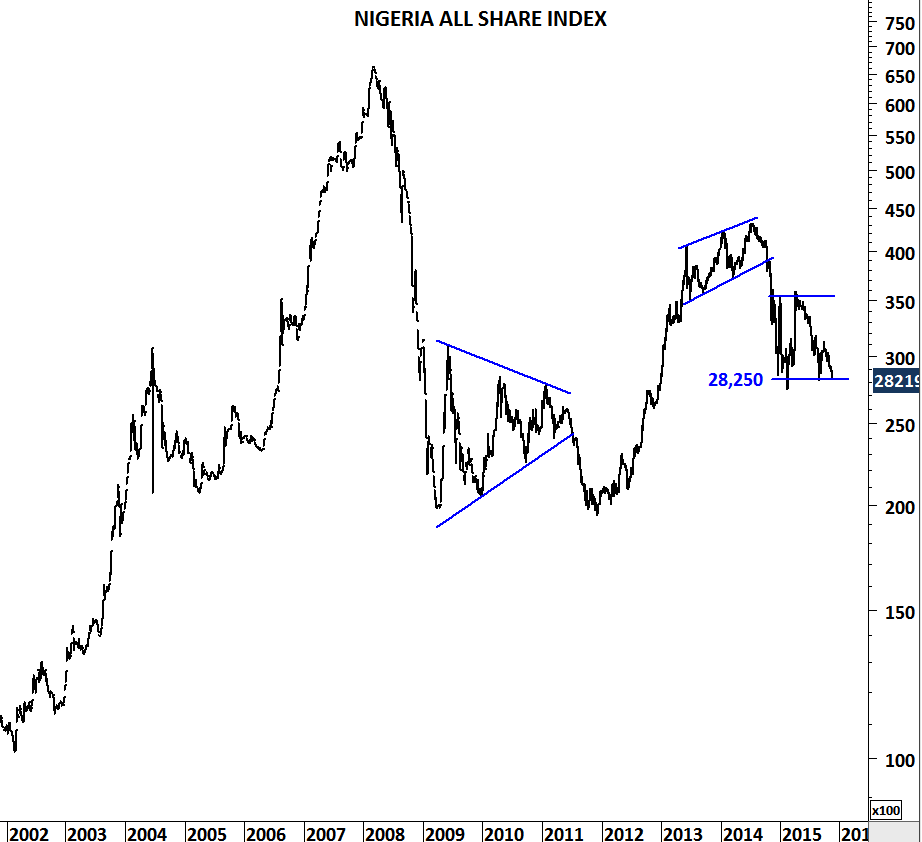
Nigeria All Share Index is now testing 28,250 levels. Breakdown below the year-long support will push the index towards 20,000-25,000 area.
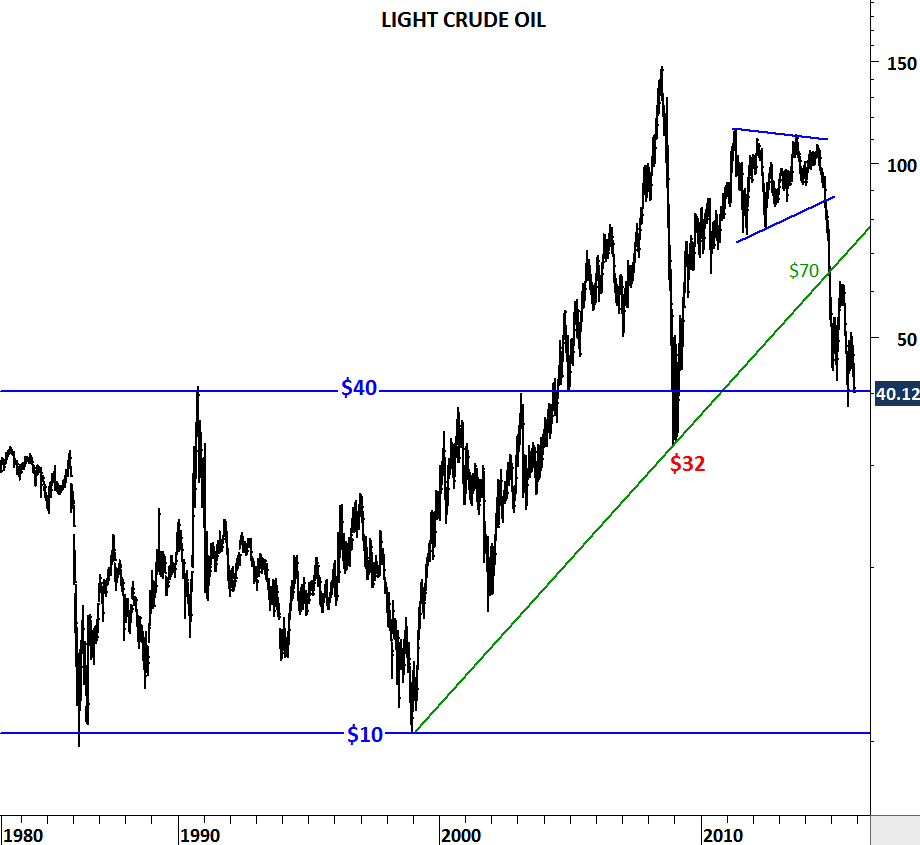
WTI Crude oil is now at a critical support. Breakdown below $40 levels will push the energy price towards the next support at $32.