
SAUDI ARABIA TADAWUL INDEX
Saudi Arabia’s Tadawul index breaks down 6 year-long uptrend. 2009-2014 uptrend retraced 38% of the downtrend formed between 2006 and 2009. A fibonacci retracement of 38% and less is considered to be a weak recovery. There is a high probability that the last 6 year’s weak uptrend was not the beginning of a long-term cyclical bull market. With the latest breakdown Saudi Arabia’s index could enter into a larger scale multi-year correction targeting 2009 low levels.
Strong resistance area will remain between 8,000 and 9,000 levels.
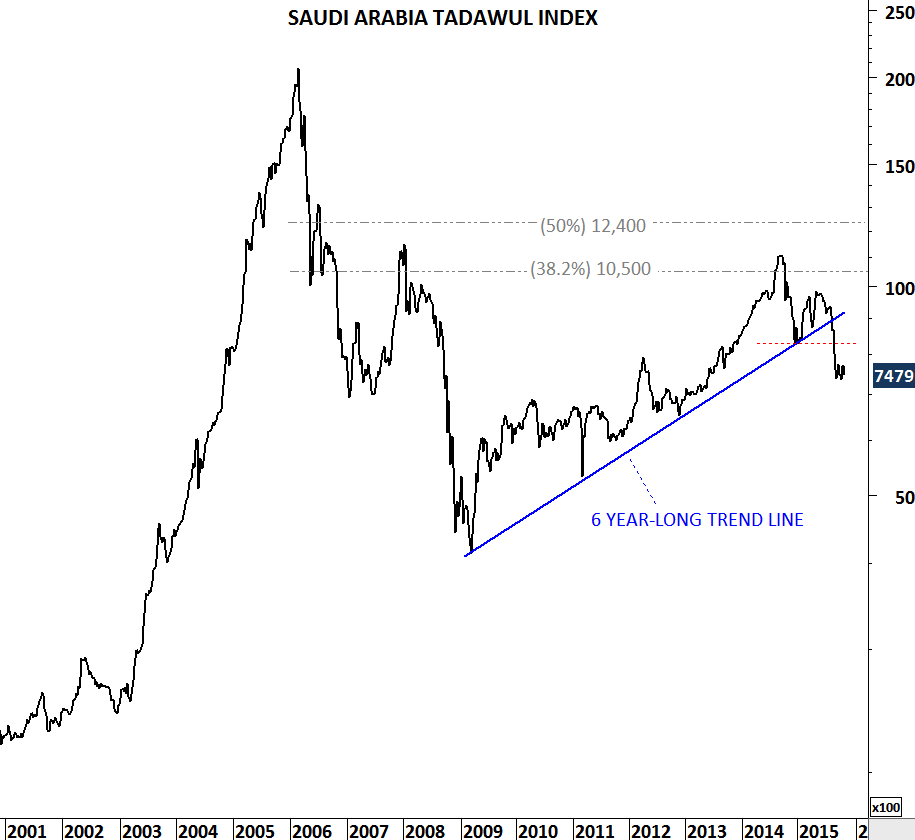 * Weekly scale price chart of Saudi Arabia Tadawul Index Data: Thomson Reuters