US DOLLAR/INDONESIAN RUPIAH

U.S. dollar remains strong against major cross rates. U.S. dollar strength is a long-term theme and it’s here to stay in the coming months. The most vulnerable group is the emerging market currencies. We have seen significant weakness in emerging market currencies over the past year. Long-term charts suggest further weakness for the emerging market currencies.

From the EM group Indonesian Rupiah is exposed to sharp depreciation. USD/IDR is breaking out of a decade-long horizontal consolidation. Breakout from long-term chart patterns are usually followed by strong trend periods. In the last quarter of 2014, USD/IDR broke above 12,400 levels – strong resistance since 2001. As long as the cross rate remains above 12,400, we will expect higher levels in the coming months.

USDIDR I

USDIDR II

CORN, WHEAT, SOYBEANS and OATS

Agricultural commodities are testing their decade-long trend line supports and are likely to rebound in the coming months. Prices are expected to rebound from such strong trend supports and in most cases put in a medium/long-term bottom. Especially when more than one trend line overlaps around the same area, it increases the significance of that support.

Higher prices in agricultural commodities could bring back the memories of 2007 where food inflation and shortages were the main concerns of the public. Most of the agricultural commodities are back to 2006 levels. Given the significance of the long-term supports, agricultural commodities could see an increase in demand in the second half of the year.

You can find more information on these agricultural commodities by clicking the links here (CORN, WHEAT, OATS, SOYBEANS, SOYBEAN OIL).

CORN

1st month continuation CORN futures contract – WEEKLY SCALE


WHEAT

1st month continuation WHEAT futures contract – WEEKLY SCALE


OATS

1st month continuation OATS futures contract – WEEKLY SCALE


SOYBEANS

1st month continuation SOYBEANS futures contract – WEEKLY SCALE


SOYBEAN OIL

1st month continuation SOYBEAN OIL futures contract – MONTHLY SCALE


GBP/ZAR

Monthly scale chart of GBP/ZAR

Monthly scale chart of GBP/ZAR

UK election results gave boost to FTSE 100 index and British pound against major currencies. There are several GBP pairs that are preparing for strong directional movements. Out of those I like GBP/ZAR the most for two reasons. These reasons are also the major component of my trade selection process. GBP/ZAR is trying to breakout from a 15 year-long consolidation. Breakout from the long-term consolidation will push the cross rate to “uncharted territory”; in other words to all-time highs. Price reaching all-time highs has the least resistance. I prefer charts that are breaking to all-time highs.

Weekly scale chart of GBP/ZAR

Weekly scale chart of GBP/ZAR

Over the past one year GBP/ZAR has been consolidating in a tight consolidation range. In technical analysis the chart pattern is called rectangle. It is a continuation chart pattern. Rectangle has horizontal resistance at 18.8 levels. I prefer horizontal breakouts from minor chart patterns that also has long-term implications. Decisive break above 18.8 on a weekly closing basis, will also clear the 15 year-long trend resistance. Such price action will be positive for GBP and suggest higher levels towards 20-21 area on GBP/ZAR.

DOW JONES COMPOSITE INDEX

DOW JONES COMP INDEX

Dow Jones Composite Index measures changes within the 65 companies that make up three Dow Jones averages: the 30 stocks that form the Dow Jones Industrial Average (DJIA), the 20 stocks that make up the Dow Jones Transportation Average (DJTA) and the 15 stocks of the Dow Jones Utility Average (DJUA). The Dow Jones 65 Composite, like the three sub-indexes, is price-weighted.

While there are broader measures of stock market performance for U.S. equities, this is another index that I follow as it offers some clearly identifiable chart patterns. Since the beginning of 2015, Dow Jones Composite Index has been forming a symmetrical triangle, usually regarded as a continuation chart pattern in a strong uptrend. Earlier in 2012 and 2013, Dow Jones Composite index formed other types of continuation chart patterns (rectangle & ascending triangle) and each were followed by breakouts and resumption of the uptrend.

Breakout from the year-long sideways consolidation pattern (symmetrical triangle) can result in another period of strength in U.S. equities. Strong support for the index remains between 6,100 and 6,300. Breakout above 6,500-6,600 area will complete the consolidation.

ZINC

Symmetrical triangle is a reliable chart pattern. It usually forms as continuation pattern but after long down/up trend it can also reverse the prolonged trend. Converging trend lines indicate the balance of power between the buyers and sellers. Best way to trade symmetrical triangles is to wait for a decisive breakout from the tight consolidation range.

Industrial metals have been weak over the past five years. In December 2014 (earlier analysis), TIN prices formed a perfect symmetrical triangle and broke down major support resulting in a strong downtrend.

TIN

Since the beginning of 2010, ZINC price has been consolidating in a sideways trading range. Another perfect symmetrical triangle might be in progress. Breakout above 2,410 or below 2,000 levels can result in a strong trend period. ZINC chart provides long-term opportunity.

ZINC

INDIA BSE SENSEX INDEX

Uptrend in INDIA equities is running out of steam. Chart pattern suggests correction in the coming months if the index breaks down the 200-day exponential moving average at 27,300 levels. India BSE SENSEX index might be forming a head and shoulder top chart pattern with the neckline overlapping with the long-term average. Breakdown below a strong technical level like this could be the first warning signal of a deeper correction.

INDIA BSE SENSEX INDEX

Weekly price scale

INDIA BSE SENSEX INDEX II

Daily price scale

Similarly USD/INR formed an inverse head and shoulder chart pattern suggesting weak Rupee if the cross rate breaks above 63.70 levels. I’m still bullish on India in the long-term (you can find earlier analysis here at the time of long-term breakout). BSE SENSEX cleared long-term horizontal resistance at 21,200 levels in 2014. I’ll view the possible weakness as a pullback to the long-term support level.

USDINR

Some stocks that are showing weakness in the Index. Strong long-term trend lines are being challenged. Breakdown on these names can push the SENSEX lower.

BAJAJ AUTO

TATA MOTORS

ICICI BANK

WIPRO

ROMANIA BUCHAREST BETI

ROMANIA BUCHAREST SE INDEX

Strength in European equities is helping the frontier equity markets in Eastern Europe. Relatively smaller markets such as Romania’s BETI index had strong performance over the past few years and the uptrend is likely to resume. In the beginning of 2014, BETI cleared 6,150 levels. Now the index is trying to breakout from a medium-term consolidation range by pushing above 7,340 levels.

BRD GROUPE SOCIETE GENERALE

BRD GROUPE SOCIETE GENERALE (ROBRD.BX) ( is a financial sector company that trades on the Bucharest Stock Exchange. According to Reuters the company is the 4th largest in the BETI index with $1.66 billion market cap. Stock is now breaking out of a 2 year-long base formation with a strong weekly price bar. Chart pattern price target is around 12.5 levels. Flat-range breakouts are usually powerful and are followed by strong trend periods.

For those who has direct access to Eastern Europe, Tech Charts community will be happy to hear your recommendations regarding efficient ways to access these markets.


U.S. DOLLAR/TURKISH LIRA

There are two themes that I would like to discuss on this chart.

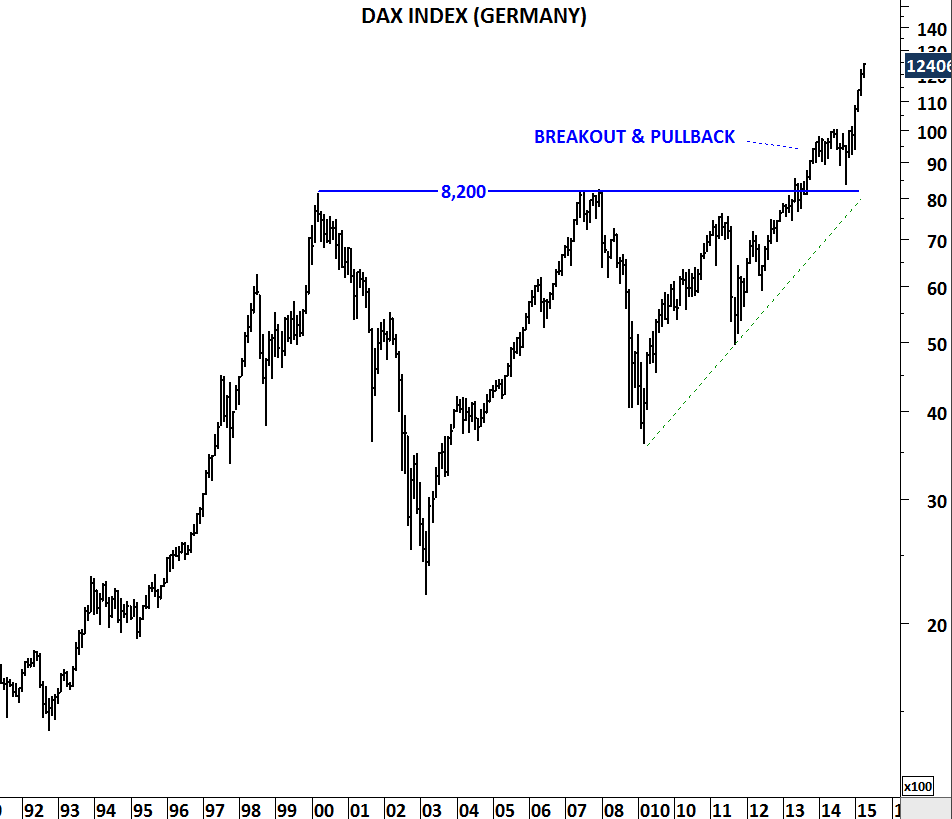
1) Breakout to all-time high levels which I like to call uncharted territory.

2) Significance of long-term chart patterns.

I’ve been following and writing about this pair for almost 2 years. I’ve been also betting on U.S. dollar strength against most of the emerging market currencies. (All updates on USD/TRY for the past 2 years)

USDTRY

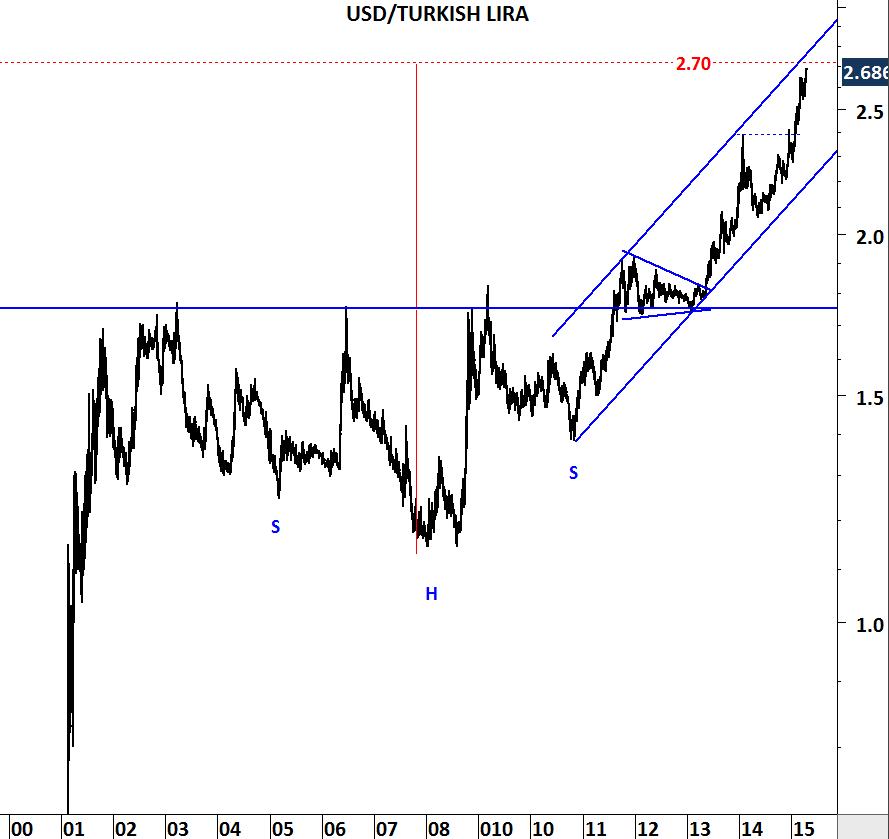
When price clears strong horizontal resistance which has been intact for almost a decade it usually signals a major shift in supply/demand dynamics. In the beginning of 2012, USD/TRY broke above 1.75 levels. That was the major shift that pushed the cross rate above decade-long resistance. However, depreciation of the Lira didn’t start until another medium-term chart pattern (symmetrical triangle) was completed in the first quarter of 2013. Only after a decisive break above 2 levels USD/TRY started moving higher towards its long-term chart pattern target at 2.7 levels.

Long-term chart pattern was a head and shoulder continuation (here is a perfect discussion on head and shoulder continuation) (@PeterLBrandt)  that took almost a decade to form. Breakout from the head and shoulder continuation also pushed the USD/TRY to all-time high levels. When these two important chart developments took place at the same time, it became clear that a major shift was underway.

Price targets derived from chart patterns are only reference points in our analysis. Price can exceed these levels. However, it is important to note that around 2.7 levels there are two strong resistances. 1) Upper boundary of the trend channel 2) Head and shoulder price target. Let’s keep a close eye on 2.7 resistance.

BIST 100 (TURKEY) and INDUSTRIAL SECTOR

Industrial sector outperformance is usually negative for Turkey’s BIST 100 index. Last  time I updated this chart was in January 2014. Since the last update It’s been more than a year and BIST 100 index trended higher from 60,000 levels to 91,000 levels. Strong upward trend might be reversing once again towards a corrective period in Turkish equities.

BIST 100 INDEX

XUINDXU100

Industrial Sector continues to outperform the BIST 100 index. 

Relative performance ratio between Industrial sector and BIST 100 index is breaking out of a long-term consolidation. Historically industrial sector’s outperformance didn’t bode well for the BIST 100 performance. Strong uptrends were usually led by financial sector outperformance.

Latest change can have significant medium/long-term implications. We can expect further correction/sideways trading in equities and continuation of industrial sector outperformance in the coming months.

UK FTSE 100 and STOXX 600

A chart that breaks out to all time high levels has the least resistance. It is called the uncharted territory. Prices are expected to resume their trend after a decisive breakout to all-time high levels. This is what happened with some of the indices over the past few years. I attached below some of the strong breakouts to all-time high levels that have taken place. S&P 500 Index, Germany DAX Index and India BSE SENSEX index are some of them.

S&P 500 INDEX

BSE SENSEX INDEX

GERMANY DAX INDEX

More and more equity indices are now breaking out to all-time high levels or at least preparing for strong breakouts. UK FTSE 100 index is one of them. Index closed the week above strong resistance level at 6,950. Few more weeks of strength will confirm the decade-long breakout.

UK FTSE 100 INDEX

Europe continues to gain strength thanks to ECB. Euro Stoxx 600 index is preparing to clear multi-year resistance at 400 levels. I’m not sure if any of these latest breakouts could end up being bull trap. The best available information (latest price information) suggests strength and increase in upside momentum in global equity indices.

EURO STOXX 600 INDEX

MSCI ALL COUNTRIES WORLD INDEX is now challenging multi-year resistance. Decisive monthly scale close above 430 will confirm the breakout.

MSCI ALL COUNTRIES WORLD INDEX