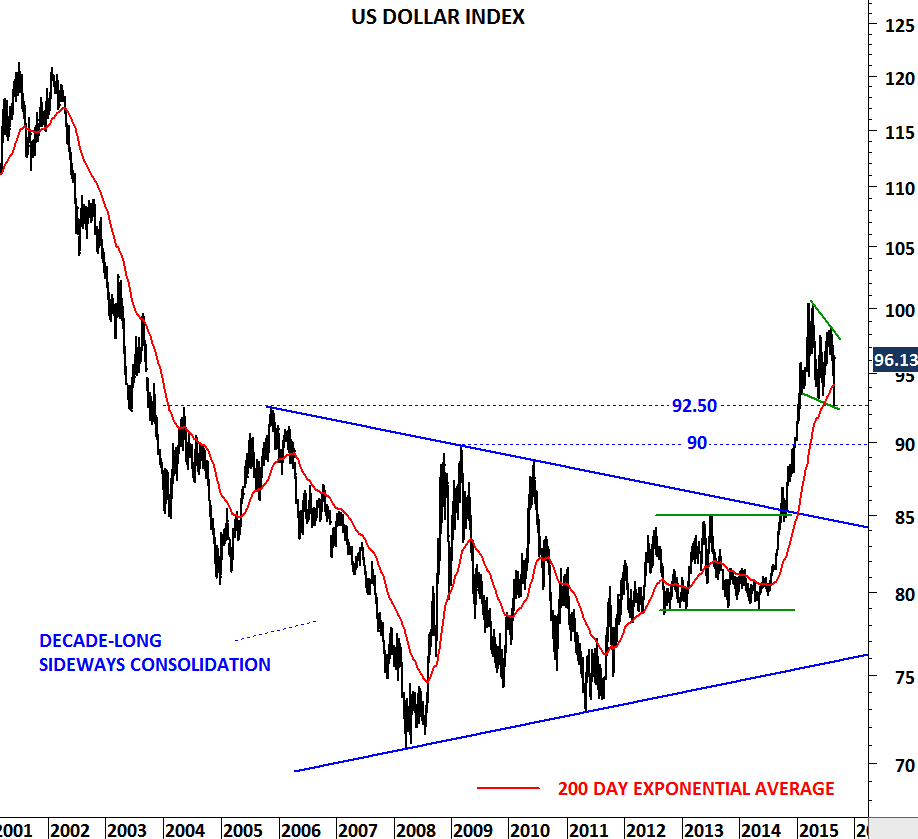
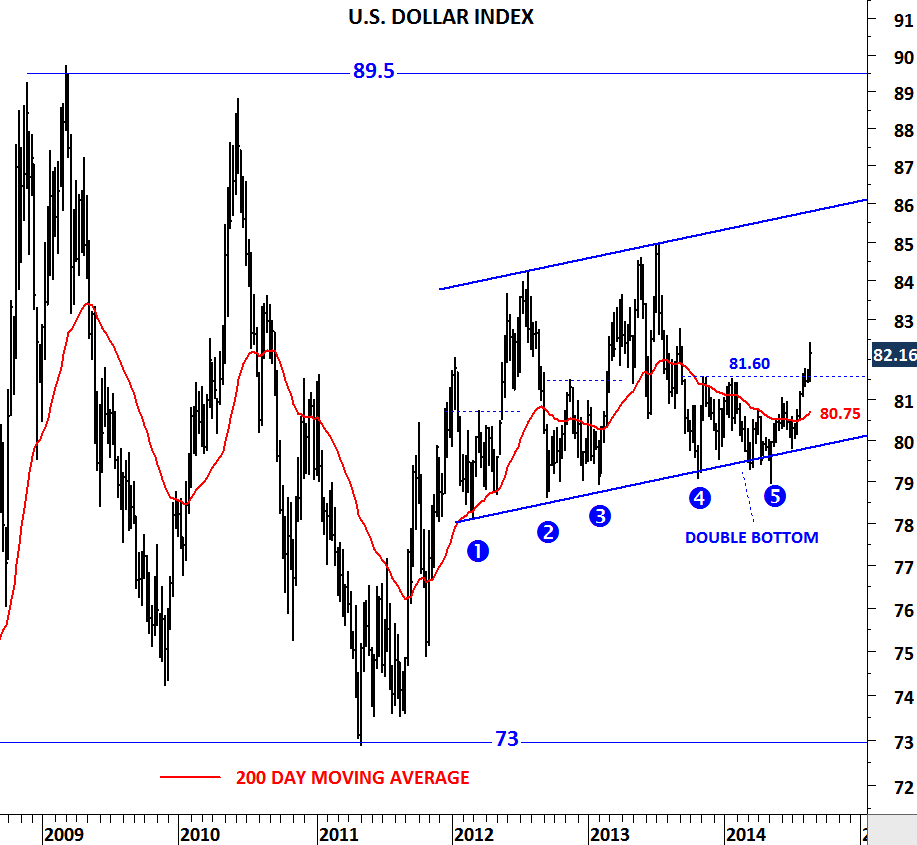
U.S. DOLLAR INDEX

Over the past week, FED’s dovish comments resulted in U.S. dollar weakness. However U.S. dollar index started weakening in the beginning of December 2015 irrespective of FED action. Wide price fluctuation between 92 and 100 levels is likely to be a sideways consolidation.

After its strong rally from 80 levels, U.S. dollar index is taking a breather. At this stage, it is early to call for a change in trend or claim that the U.S. dollar bull market is over. U.S. dollar index should find support around 92 levels. Only after a decisive breakdown below 92 levels we can expect large-scale correction for the U.S. dollar. Until that happens I view the medium/long-term outlook on the U.S. dollar as bullish.

US DOLLAR INDEX

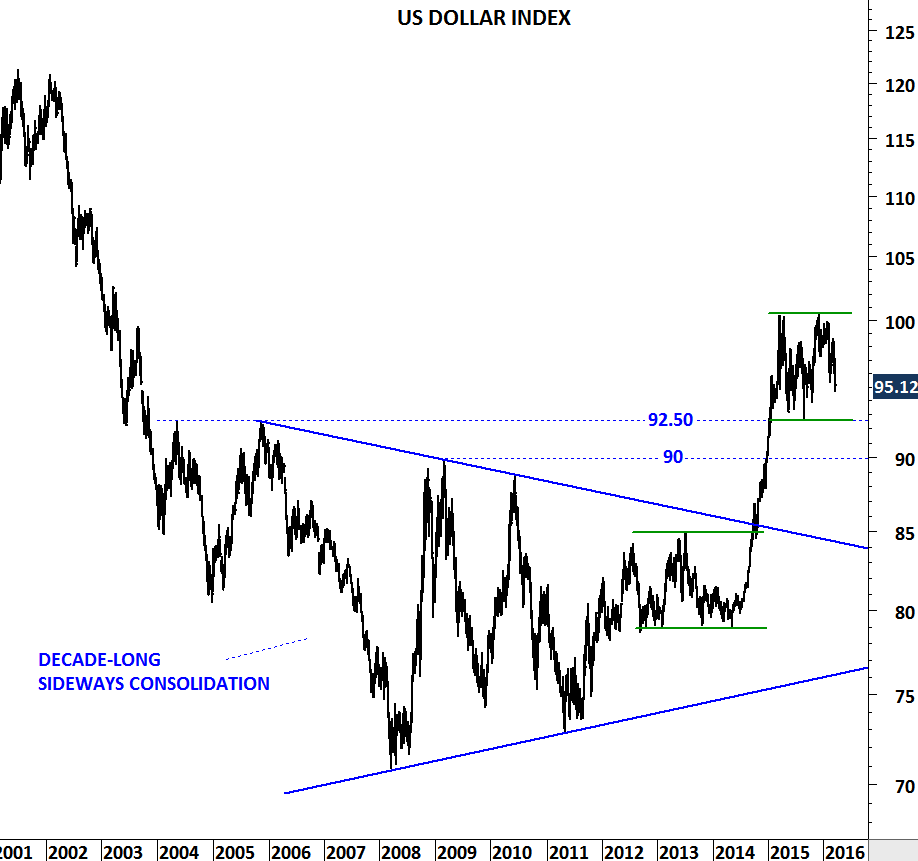
Weekly price chart of U.S. DOLLAR INDEX

US DOLLAR INDEX II

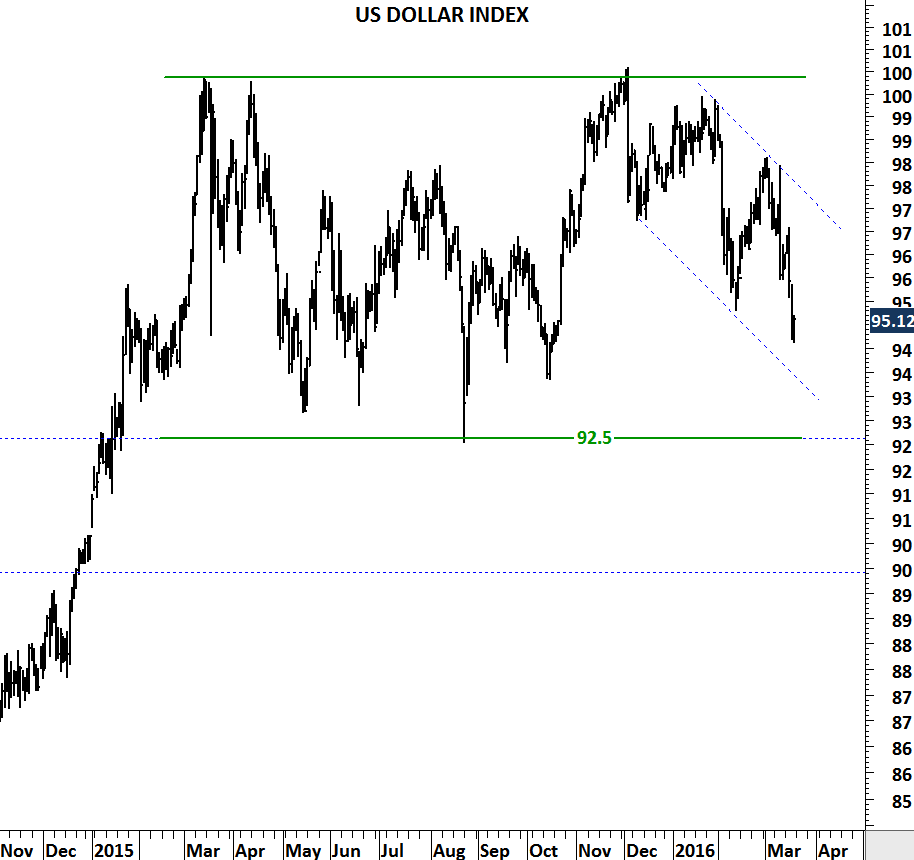
Daily price chart of U.S. DOLLAR INDEX


USD/CAD

Weak energy and metal prices continue to put pressure on the Canadian economy and its currency. Since the beginning of 2011, Canadian dollar has been losing ground against the U.S. dollar (for earlier analysis on USD/CAD). 1.3040 was an important resistance – levels that were seen during the 2008 financial meltdown.

In the last quarter of 2015, USD/CAD breached the strong resistance at 1.3040 and possibly completed a longer-term base formation. With the last couple of week’s sharp depreciation we can conclude that there is further weakness due for 2016. Unless the cross rate falls below 1.3040 levels in the following months,  the new trading range will be between 1.3040 and 1.62.

USDCAD

U.S. DOLLAR INDEX

U.S. dollar strength is here to stay. Greenback had a strong recovery last week. Strong dollar will continue to put pressure on commodities, commodity currencies and also emerging markets. In other words, weak emerging markets, commodities and strong U.S. Dollar trend is likely to continue in the following months.

After its breakout from a decade-long consolidation in the last quarter of 2014, U.S. Dollar index rallied from 85 to 100 levels. Since March 2015, price has been pulling back to the strong support at 92 levels. Last week, the dollar index tested the strong support and rebounded sharply. Latest consolidation is more like a counter trend move in the context of a short/medium-term correction. Uptrend in the U.S. Dollar remains intact and once the choppy sideways consolidation is over we can expect the continuation of the uptrend.

US DOLLAR INDEX

MAJOR U.S. DOLLAR CROSS RATES

EURUSD

USDSGD

U.S DOLLAR VS. SINGAPORE DOLLAR

USDSEK

U.S. DOLLAR VS. SWEDISH KRONA

USDNOK

U.S. DOLLAR VS. NORWEGIAN KRONE

USDCAD

U.S. DOLLAR VS. CANADIAN DOLLAR

USDJPY

U.S. DOLLAR VS. JAPANESE YEN

GBPUSD

BRITISH POUND VS. U.S. DOLLAR

NZDUSD

NEW ZEALAND DOLLAR VS. U.S. DOLLAR

AUDUSD

AUSTRALIAN DOLLAR VS. U.S. DOLLAR

USD/CAD

Commodity exporting countries currencies are weak against the U.S. dollar. Especially energy and metal exporters are showing significant weakness. One of those is the Canadian dollar. USD/CAD cross rate is now testing a strong resistance at 1.3040 levels. Breakout above 1.3040 levels can result in a runaway price movement to historical high levels. Though RSI, a momentum indicator, is not confirming the latest rally (more info on negative divergence on RSI). While in the short/medium-term the uptrend looks over extended, long-term traders/investors should keep a close eye on the critical resistance at 1.3040. Breakout above 1.3040 level can complete a massive multi-year base formation with a long-term price target of 1.60.

USDCAD

GBP/ZAR

Monthly scale chart of GBP/ZAR

Monthly scale chart of GBP/ZAR

UK election results gave boost to FTSE 100 index and British pound against major currencies. There are several GBP pairs that are preparing for strong directional movements. Out of those I like GBP/ZAR the most for two reasons. These reasons are also the major component of my trade selection process. GBP/ZAR is trying to breakout from a 15 year-long consolidation. Breakout from the long-term consolidation will push the cross rate to “uncharted territory”; in other words to all-time highs. Price reaching all-time highs has the least resistance. I prefer charts that are breaking to all-time highs.

Weekly scale chart of GBP/ZAR

Weekly scale chart of GBP/ZAR

Over the past one year GBP/ZAR has been consolidating in a tight consolidation range. In technical analysis the chart pattern is called rectangle. It is a continuation chart pattern. Rectangle has horizontal resistance at 18.8 levels. I prefer horizontal breakouts from minor chart patterns that also has long-term implications. Decisive break above 18.8 on a weekly closing basis, will also clear the 15 year-long trend resistance. Such price action will be positive for GBP and suggest higher levels towards 20-21 area on GBP/ZAR.

AUD/USD

In a downtrend the lower boundary of a trend channel represents the “negative” extreme and the upper boundary the “positive” extreme. Price is expected to rebound from the positive and negative extremes. A downtrend is likely to reverse when the upper boundary is broken on the upside. Likewise an uptrend is likely to reverse when the lower boundary is broken on the downside.

CHANGE IN TREND DIRECTION

But what happens when the price doesn’t rebound from the lower or the upper boundary of the trend channel? Breaking down a negative extreme is usually a sign of an accelerated move in the direction of the breakdown.

ACCELERATION IN CURRENT TREND

This is the case with AUD/USD. Since 2011, Australian Dollar vs. U.S. Dollar has been in a downtrend. Cross rate rebounded from the lower boundary twice in 2013. With the latest sell-off AUD/USD breached the lower boundary, failing to rebound. Unless the cross rate recovers above 0.85 levels in the following weeks, latest breakdown will be the beginning of an accelerated move on the downside. In the short/medium-term and Australian dollar is weak against the U.S. dollar.

AUDUSD

JPY/SGD

Long-term opportunities don’t often come along. So when they do it’s worth paying attention to these developments. In the beginning of 2014, AUD/NZD cross-rate was finding support at a multi-decade horizontal trend line. Base formation took more than 5 months to develop. I sent out two updates one in (April 30,2014) and one in (June 4, 2014) drawing attention to a major low. Similar technical chart development is now presenting itself on the JPY/SGD. Cross-rate is reaching a multi-decade support area between 1.15-1.17. This could be a major low for the JPY/SGD. Though, it is important to note that base formation could take several months.

JPYSGD

AUDNZD

U.S. DOLLAR INDEX

Dollar is gaining strength against major currencies. Recent breakout on the U.S. dollar index confirms this. Other than Euro and Japanese yen weakness we are also seeing depreciation in emerging market currencies. Combined weakening effect of the developed and emerging market currencies resulted in a sharp price movement on the U.S. dollar index. Latest breakout above 81.60 completed a “double bottom” chart pattern with a price target of 84-85 area for the coming weeks. Price should remain above 81.60 levels for the dollar strength to resume in the medium-term. 81.60 becomes the new support level.

US DOLLAR INDEX

Some exciting chart developments are taking place in the emerging market currencies. Peruvian Nuevo Sol; local currency of Peru is losing strength against the U.S. dollar. Latest chart development – ascending triangle on the weekly scale – is bullish for the dollar and suggests further depreciation of the Peruvian Nuevo Sol. Breakout above 2.82 levels will confirm the bearish case for PEN.

USDPEN

Another currency pair that is at the edge of a breakout is the Russian Ruble. Since the beginning of 2009 USD/RUB tested 36.50 for the third time. Breakout above 36.50 will be negative for the Russian currency. It is important to note that 36.50 is the historical high for the USD/RUB.

USDRUB

AUD/NZD

I analyzed this pair in April 2014. Cross rate showed significant chart pattern development at a historical support. AUD/NZD is trying to rebound from 3 decade-long support level. 1.05 was tested for five times over the past thirty years. Each test was recorded as medium/long-term low. We are there again… Not only the long-term chart is signaling a possible rebound but also the daily chart is suggesting higher AUD/NZD with a double bottom chart pattern.

  1. On the long-term monthly scale chart MACD is trying to reverse from a historical low-level. Buy signal on MACD will be bullish for Australian dollar.
  2. On the daily chart AUD/NZD breached the horizontal resistance at 1.095. Last challenge is the 200-day moving average at 1.103 levels.

I think the overall technical outlook is turning in favor of Australian dollar versus New Zealand  dollar.

Monthly scale chart

AUDNZD

Daily scale chart

AUDNZD II

GBP/SGD

Long-term trends can be interrupted by short/medium-term consolidations; in other words “breath-taking” periods. In technical analysis these type of short/medium-term consolidations are classified as flag, pennant, triangle or rectangle chart pattern. Each chart pattern has its own characteristics.

Since the beginning of 2013, British pound has been outperforming Singapore dollar. Cross rate formed a clear uptrend. After reaching 2.13 levels in the beginning of 2014, GBP/SGD started moving sideways to form a common consolidation pattern known as symmetrical triangle. Volatility on daily and weekly scale suggests another trend period is likely to unfold following the latest consolidation. Breakout above 2.12 levels will be bullish for British pound and GBP/SGD cross-rate will target 2.15-2.18 area. As long as the cross rate remains above 2.09 levels the uptrend will remain intact.

GBPSGD