
GBP/ZAR
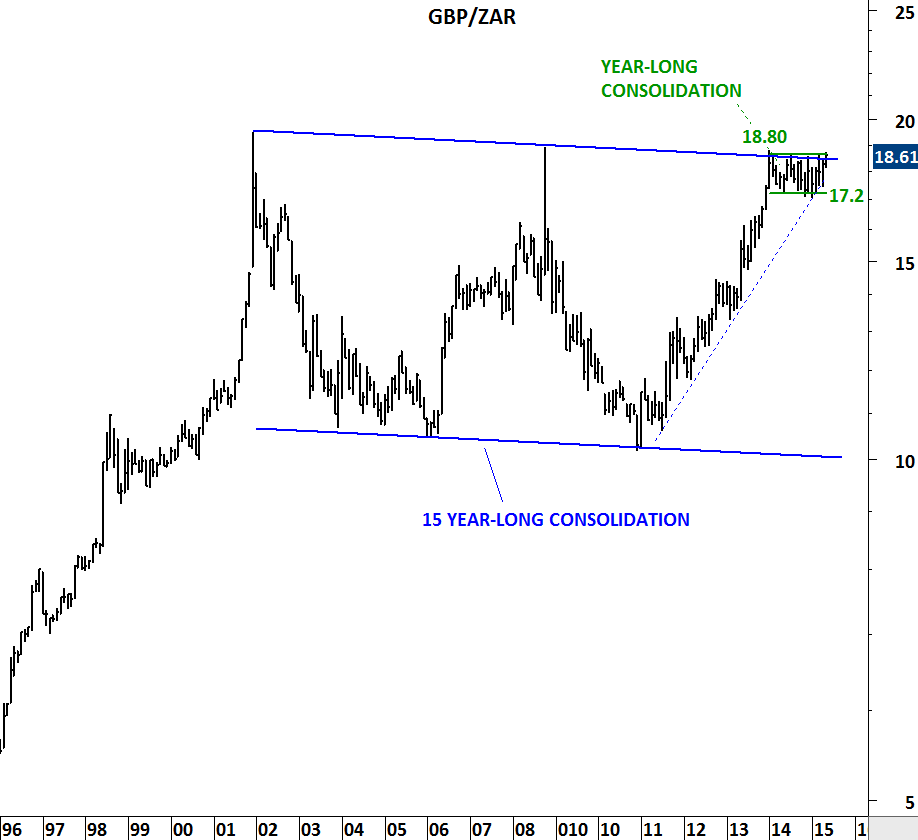
Monthly scale chart of GBP/ZAR
UK election results gave boost to FTSE 100 index and British pound against major currencies. There are several GBP pairs that are preparing for strong directional movements. Out of those I like GBP/ZAR the most for two reasons. These reasons are also the major component of my trade selection process. GBP/ZAR is trying to breakout from a 15 year-long consolidation. Breakout from the long-term consolidation will push the cross rate to “uncharted territory”; in other words to all-time highs. Price reaching all-time highs has the least resistance. I prefer charts that are breaking to all-time highs.
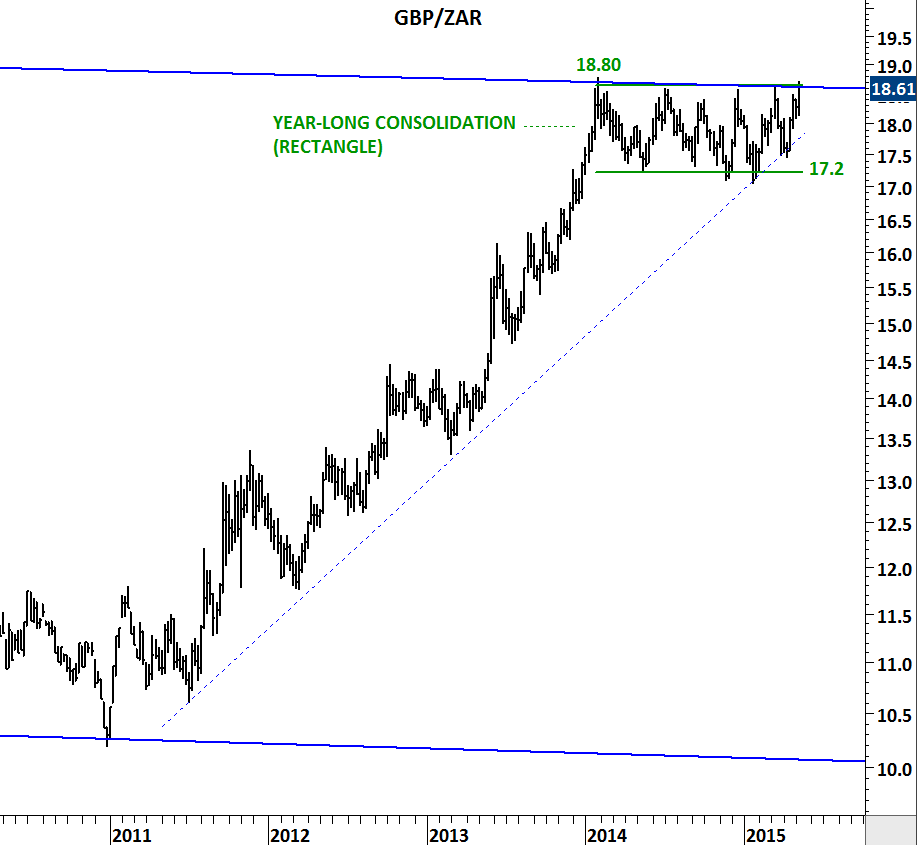
Weekly scale chart of GBP/ZAR
Over the past one year GBP/ZAR has been consolidating in a tight consolidation range. In technical analysis the chart pattern is called rectangle. It is a continuation chart pattern. Rectangle has horizontal resistance at 18.8 levels. I prefer horizontal breakouts from minor chart patterns that also has long-term implications. Decisive break above 18.8 on a weekly closing basis, will also clear the 15 year-long trend resistance. Such price action will be positive for GBP and suggest higher levels towards 20-21 area on GBP/ZAR.