Posts

TRY, ZAR and MXN

This could be a critical day for most of the emerging market currencies against the U.S. dollar. USD/TRY, EUR/TRY, USD/ZAR and USD/MXN are few cross rates worth mentioning in this update.

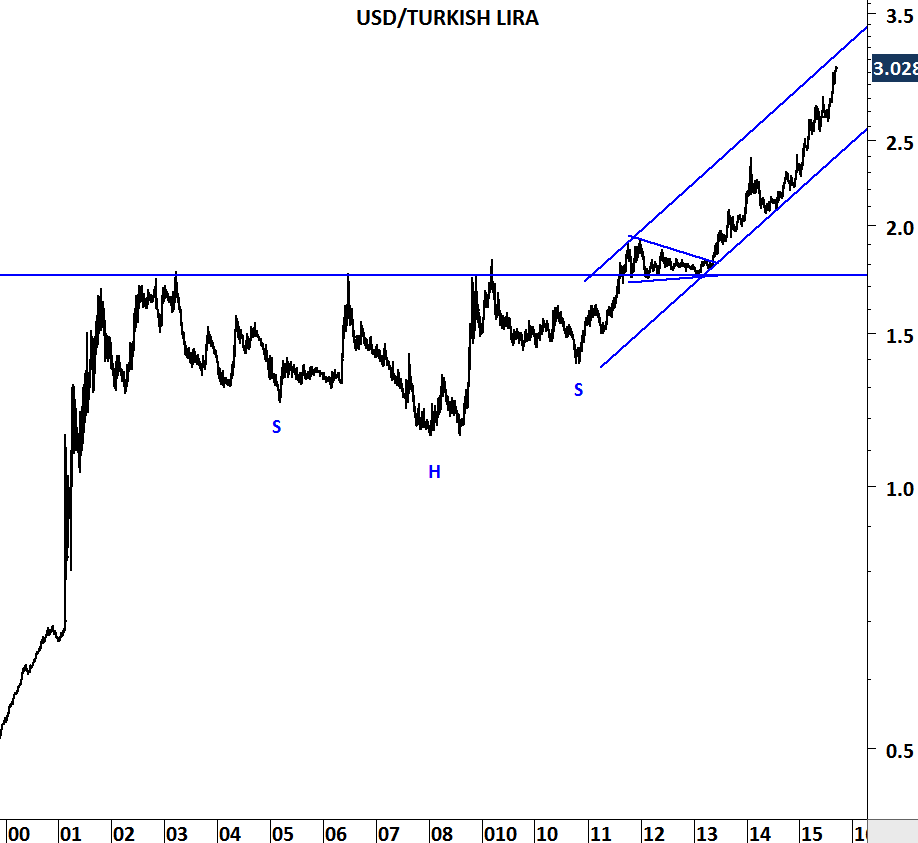
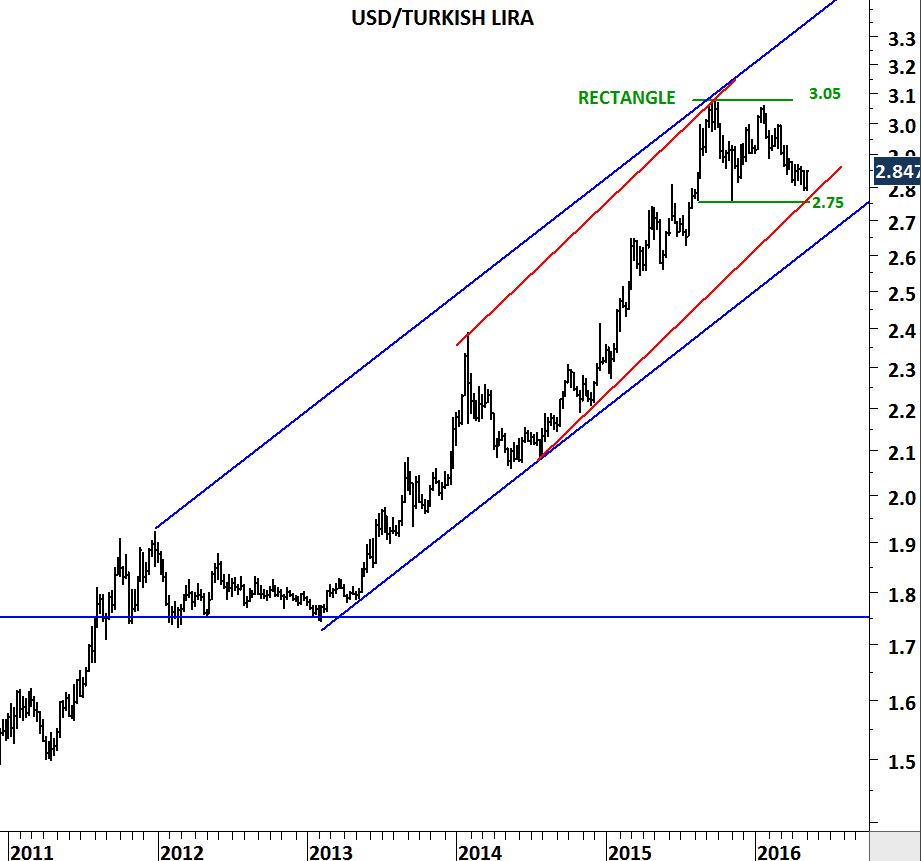
USD/TRY is possibly completing a rectangle chart pattern. The lower boundary of the year-long consolidation formed support between 2.75 and 2.80. A strong weekly close around 2.85 and above will likely reverse the last couple of months strong TRY trend and result in an upward move towards 3.05 levels.

USDTRY

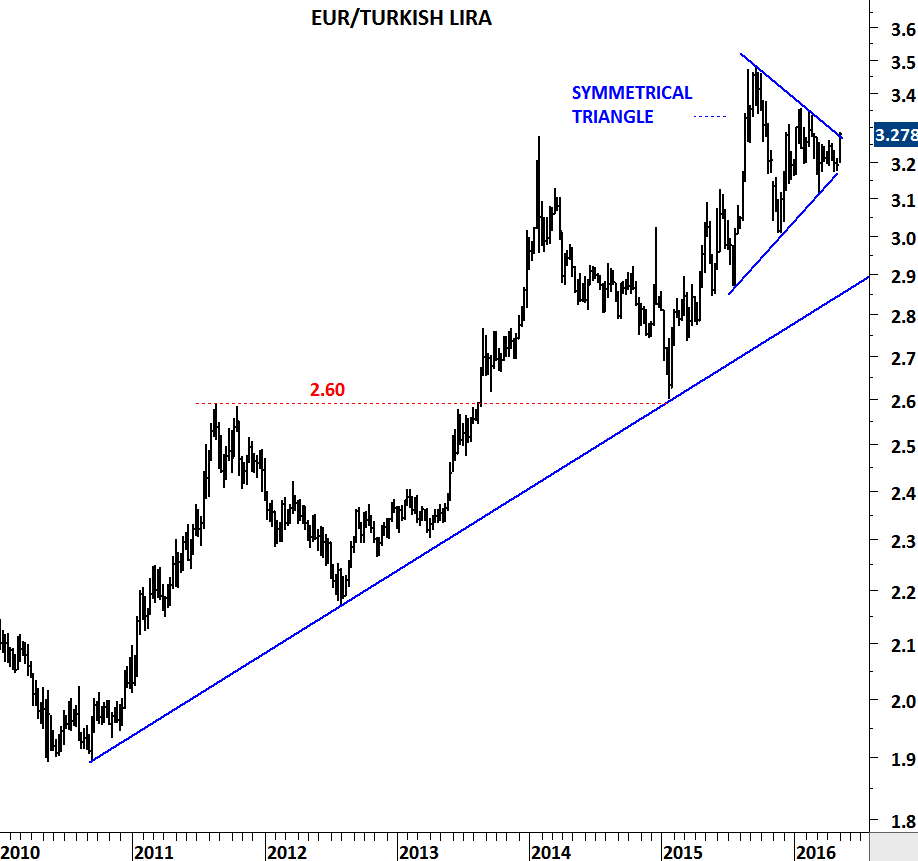
EUR/TRY is possibly completing a symmetrical triangle. Low volatility on weekly scale suggests a strong trend period for the coming months. Again, a decisive breakout on weekly scale is required to confirm the completion of 7 month-long sideways consolidation. A weekly close above 3.30 levels will breach the resistance with enough margin.

EURTRY

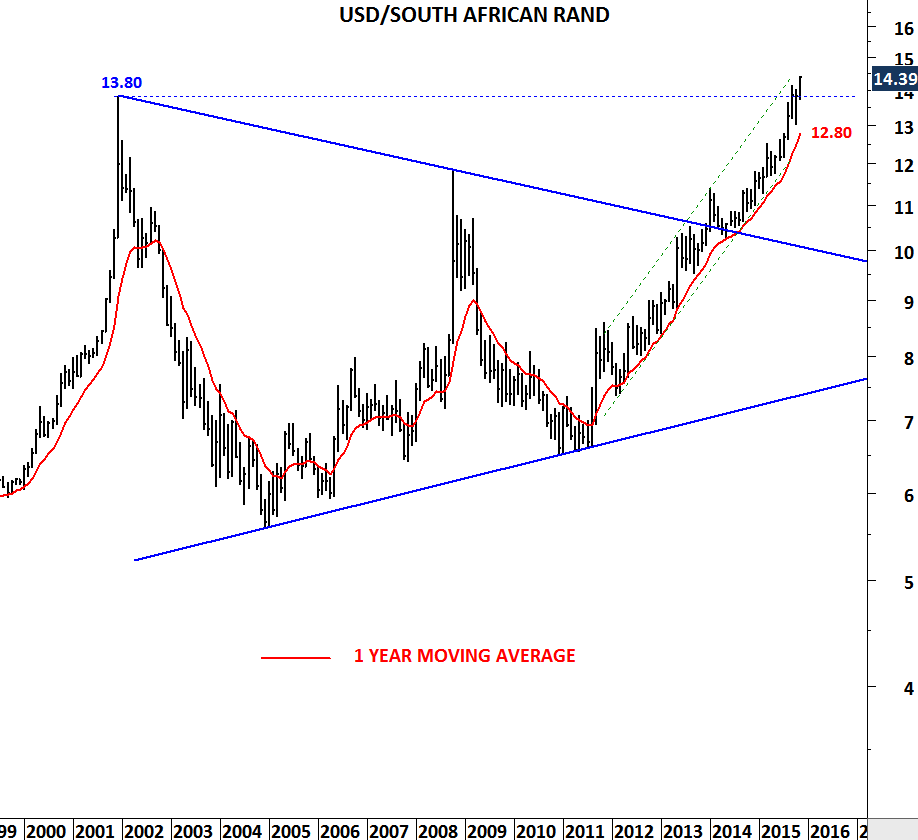
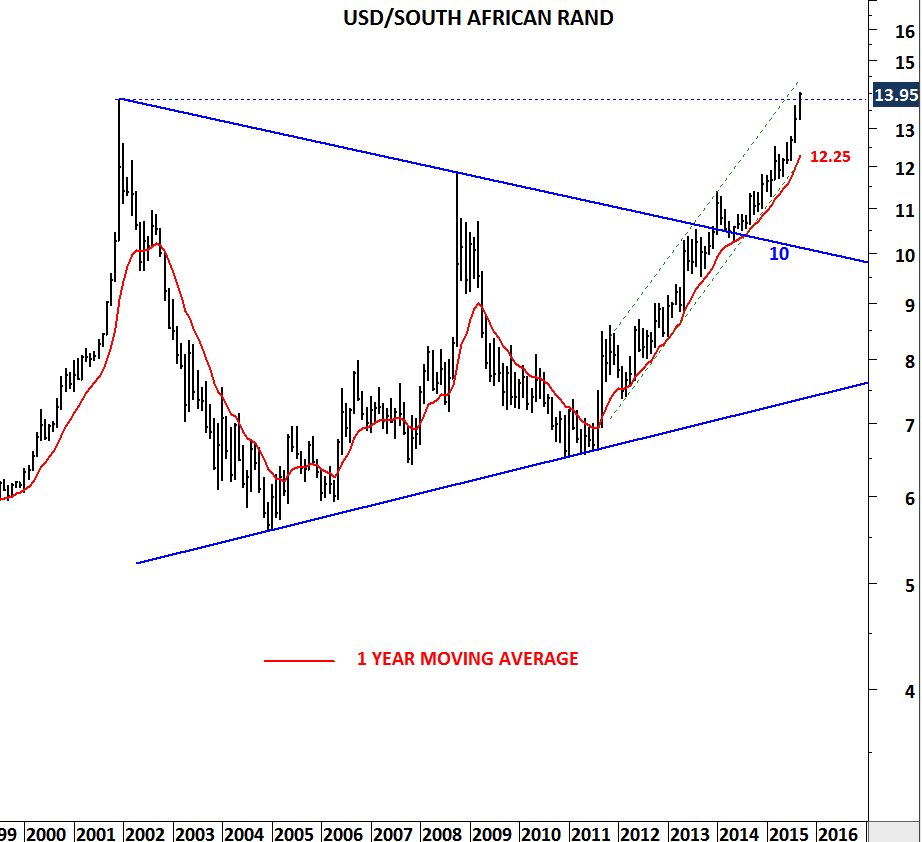
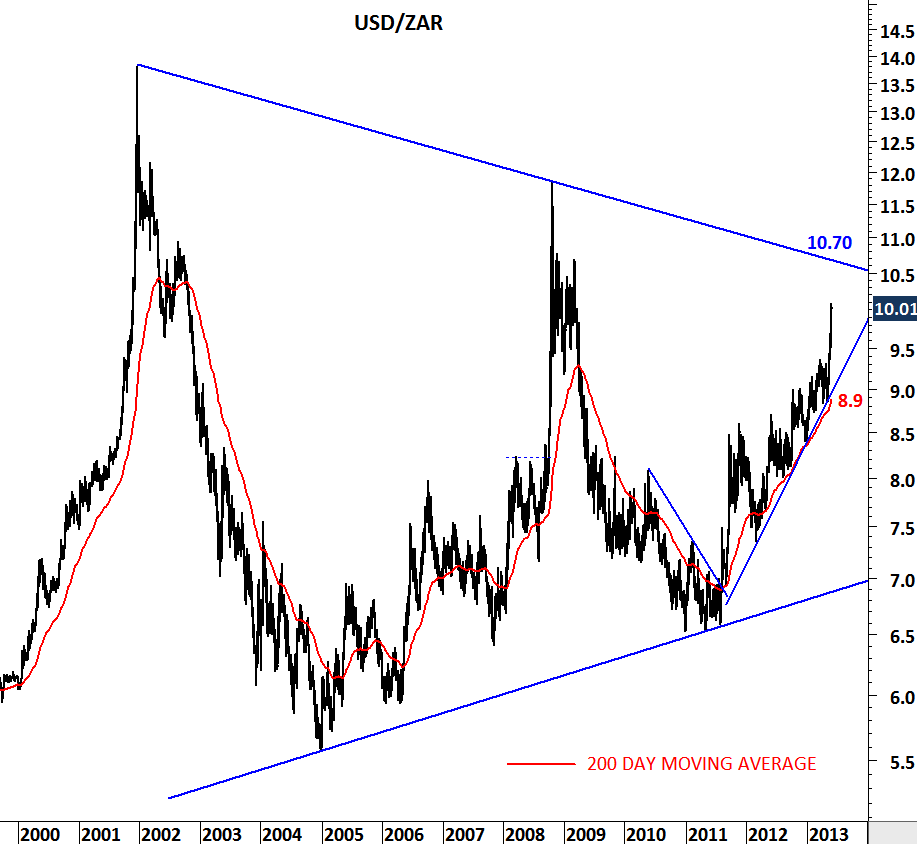
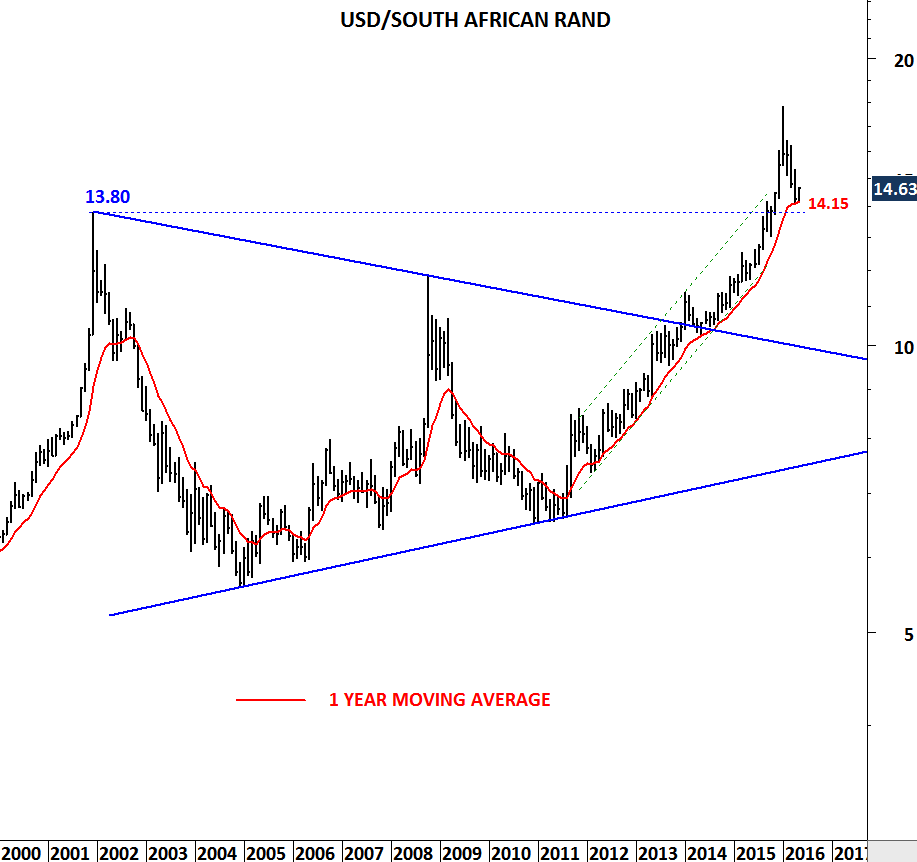
Monthly scale price chart of USD/ZAR shows the importance of 13.80-14.15 area. 13.80 was the historical high that was broken on the upside. 14.15 is the 1 year-long moving average that acted as strong support since the uptrend on USD/ZAR began in 2011. Unless we see a decisive break below 13.80-14.15 area, USD should continue to gain strength against the Rand.

USDZAR

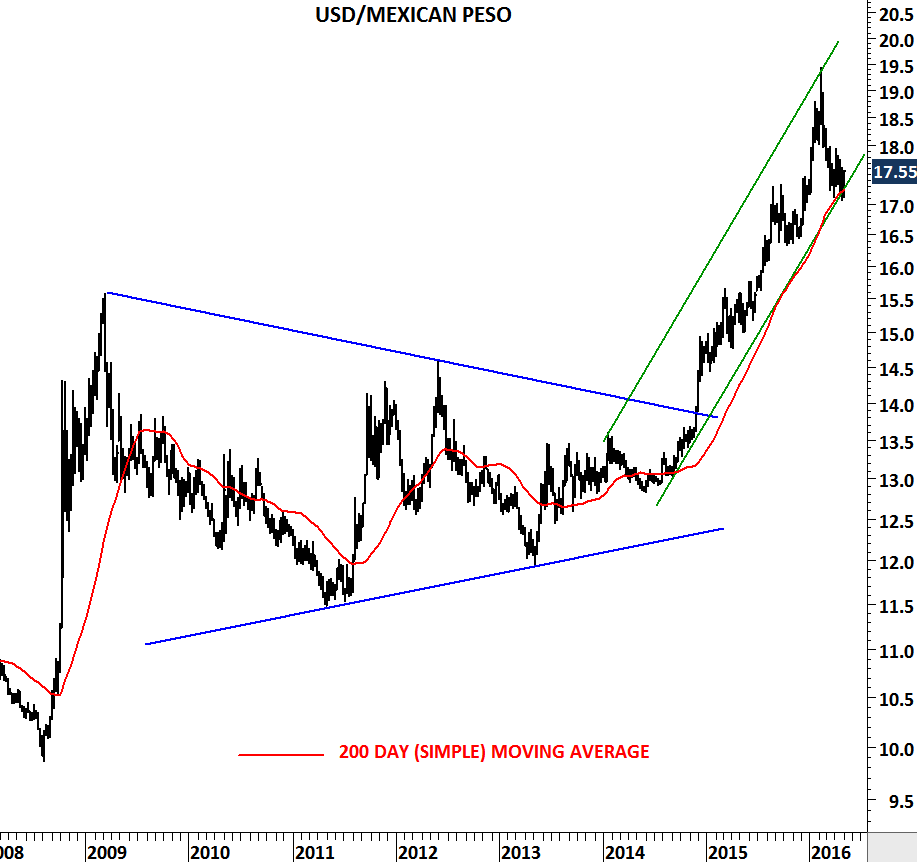
USD/MXN is another emerging market currency that found support at the 200 day moving average. 17 level was not only the long-term average but also the lower boundary of the possible 2 year-long trend channel. If USD/MXN is reversing from these levels, cross rate should rebound towards 19.5 levels in the following weeks.

USDMXN


TURKEY, SOUTH AFRICA and BRAZIL

It started with weakness in emerging market currencies (archive for emerging market currencies) then it spread to equity markets and now emerging market yields are under pressure. From commodity exporting economies to energy importers, almost all emerging markets experienced high volatility. Charts are telling us that the high volatility is here to stay and possibly spread to other investment areas. This update shows the technical damage on the 3 major emerging market economies; Brazil, South Africa and Turkey. By looking at these charts one would wonder how much more shocks can these markets absorb. It looks like the bond markets can experience some heat in the following months.

BRAZIL

MSCI BRAZIL

Sharp sell-off in Brazilian equities breaks down 2008 low levels. MSCI Brazil underperforms the MSCI Emerging Markets index.

MSCI BRAZIL vs MSCI EM

U.S. Dollar vs. Brazilian Real is now close to 4 levels. Since the breakout above 2.62 levels, depreciation in Brazilian Real has taken a parabolic shape. Breakout above 4 levels will push the cross rate to uncharted territory.

 USDBRL

10 year government bond yields completed 7 year-long base formation, suggesting a price target of 18 levels.

BRAZIL 10 YR YIELDS

BRAZIL GDP GROWTH RATE

Source: www.tradingeconomics.com

SOUTH AFRICA

MSCI SOUTH AFRICA

MSCI South Africa is now testing strong support at 445 levels. Breakdown below this level can push the index towards 350 levels.

MSCI SOUTH AFRICA vs MSCI EM

MSCI South Africa has outperformed the MSCI Emerging Markets index. This is positive on a relative basis.

USDZAR

U.S. Dollar vs. South African Rand is now challenging all-time high levels. Depreciation against the U.S. dollar resumes…

SOUTH AFRICA 10 YR GOVT BOND YIELDS

South Africa 10 year government bond yields are completing a massive 5 year-long base formation. Breakout above 8.9 levels can result in a similar move that we have seen on the Brazilian government bond yields.

SOUTH AFRICA GDP GROWTH RATE

Source: www.tradingeconomics.com

TURKEY

MSCI TURKEY

MSCI Turkey breaks down decade-long trend line support. Also the index breached the 5 year-long support at 400 levels.

MSCI TURKEY vs MSCI EM

If we take the relative performance of MSCI Turkey vs. MSCI Emerging Markets we can conclude that the index have been flat since 2004!

USDTRY

After completing its decade-long consolidation which took the form of a continuation head and shoulder U.S. Dollar/Turkish Lira broke out above 1.8 levels and since then the sharp depreciation pushed the Lira to historical high levels. Added to the emerging market weakness, political uncertainty and security issues put further pressure on Turkish economy and its financial markets.

TURKEY 2 YR GOVT BOND YIELDS

Turkish short-term yields are completing a massive 6 year-long base formation. Breakout above 11.8 levels can push the yields to 19 levels in the following months.

TURKEY GDP GROWTH RATE

Source: www.tradingeconomics.com

GBP/ZAR

Monthly scale chart of GBP/ZAR

Monthly scale chart of GBP/ZAR

UK election results gave boost to FTSE 100 index and British pound against major currencies. There are several GBP pairs that are preparing for strong directional movements. Out of those I like GBP/ZAR the most for two reasons. These reasons are also the major component of my trade selection process. GBP/ZAR is trying to breakout from a 15 year-long consolidation. Breakout from the long-term consolidation will push the cross rate to “uncharted territory”; in other words to all-time highs. Price reaching all-time highs has the least resistance. I prefer charts that are breaking to all-time highs.

Weekly scale chart of GBP/ZAR

Weekly scale chart of GBP/ZAR

Over the past one year GBP/ZAR has been consolidating in a tight consolidation range. In technical analysis the chart pattern is called rectangle. It is a continuation chart pattern. Rectangle has horizontal resistance at 18.8 levels. I prefer horizontal breakouts from minor chart patterns that also has long-term implications. Decisive break above 18.8 on a weekly closing basis, will also clear the 15 year-long trend resistance. Such price action will be positive for GBP and suggest higher levels towards 20-21 area on GBP/ZAR.

USD/ZAR

Positive sentiment for the South African rand might be over as the cross rate reaches strong support area formed by the long-term trend line and moving averages. Both 3 year-long trend line and the 200-day moving average are forming support at 10.35 levels. RSI (Relative Strength Index) is also testing 50 levels; which is considered to be the lower boundary for a bull market. Over the past 3 years cross rate managed to rebound from the 200-day average and the RSI rebounded from 50 levels simultaneously. Expect a similar rebound from the strong support area and weakness in South African rand against the U.S. dollar.

USDZAR

USD/ZAR & USD/IDR

ZAR

IDR

Emerging market currencies are going through challenging times as they lose ground against the U.S. dollar. After two decades of massive depreciation against the U.S. dollar (1980-2000), most of the EM currencies stabilized and started moving sideways in a wide range. Latest sell-off pushed the cross rates to test their upper boundaries. South African Rand reached the upper boundary of its contracting range (possibly a symmetrical triangle) and Indonesian Rupiah the upper boundary of its flat consolidation range. The question now is whether the decade long consolidations will resume or will be followed by strong breakouts. These long-term charts should be on our watch-list in the following months.

USD/ZAR

USDZAR

U.S. dollar continues to gain strength against major emerging market currencies. In this update I’m analyzing the USD/ZAR (South African Rand). USD has been strong against the Rand since mid-2011. We are now seeing the uptrend accelerating towards the long-term resistance at 10.70 levels. Earlier tops in 2001 and in 2008 was marked with an upward spike. 10.70 is the likely short-term target.