DOW JONES TRANSPORT and UTILITIES
I’m not a big fan of diagonal support/resistances. I like horizontal and clearly defined support/resistance levels on price charts. Especially horizontal support and resistance levels on the weekly and monthly scale charts. However, current price action and the outlook on the U.S. indices is worth mentioning. Most of the major Dow Jones indices are rebounding from trend channel supports.
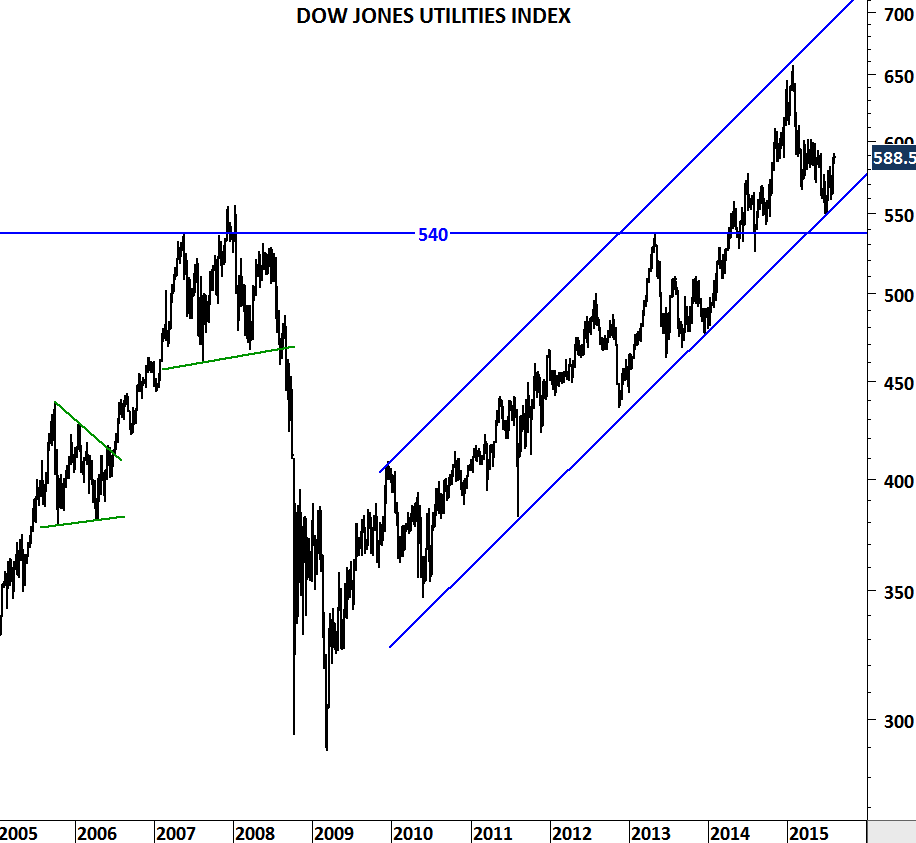
Trend channel support is more reliable for the Dow Jones Utilities index as the lower boundary of the trend channel was tested several times over the past 5 years.
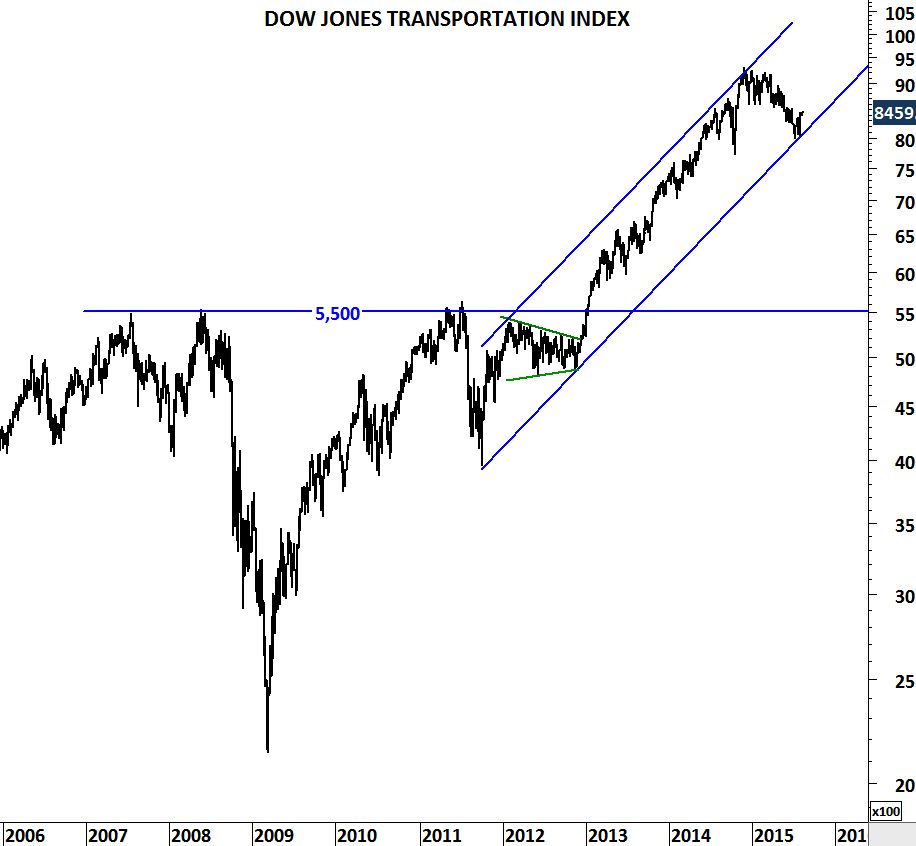
Dow Jones Transportation index is trying to rebound from trend channel support.
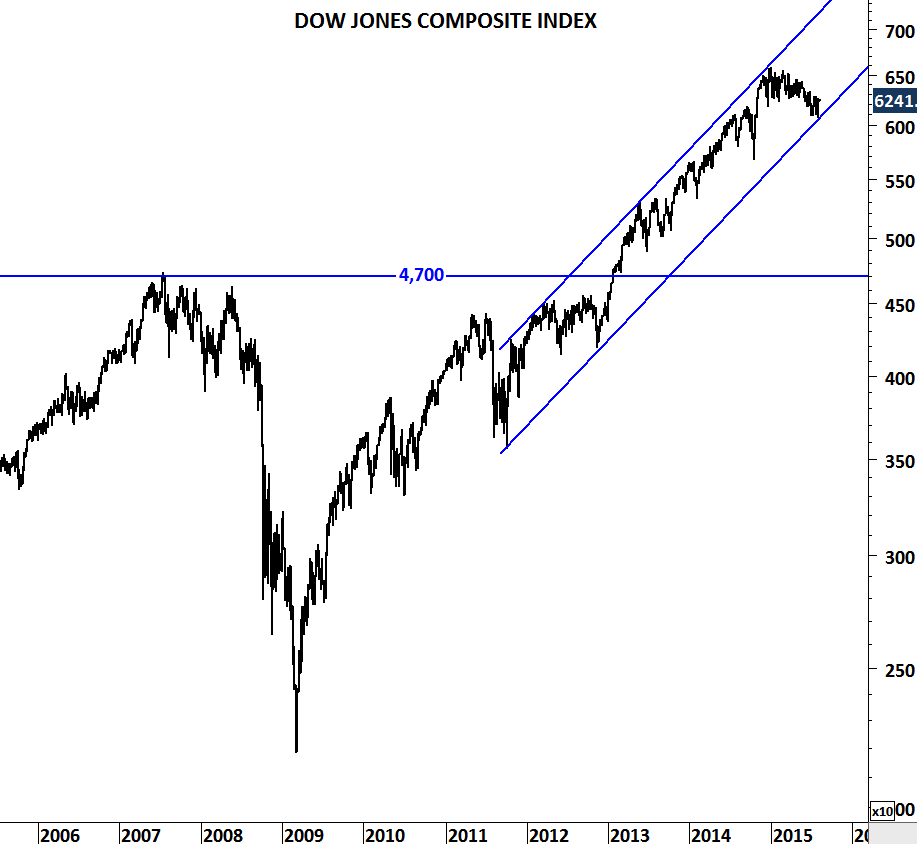
Dow Jones Composite index which is a combination of Industrials, Transportation and Utilities is also finding support at the lower boundary of its trend channel.