UK FTSE 100 INDEX
Scotland will remain part of United Kingdom following historic referendum vote. What is next for the financial markets? Over the past few weeks we have seen increased volatility in the currency markets. GBP/USD cross rate fell from 1.68 levels to 1.60. It is now rebounding back to 1.645 levels. For the equity markets we can’t say the same. It’s been relatively quiet. UK FTSE 100 index remained below the historical high levels at 6,880. This is a 15 year-long resistance and I believe breakout to all-time high levels will be very positive. Below I shared two charts on the UK FTSE 100 index. A monthly chart that covers the last 25 years and a daily chart that shows the last 2 years consolidation. Over the past 2 years there has been 6 to 7 attempts to clear the resistance at 6,880 levels. None of them were successful. Both the long-term and the short-term chart suggests a breakout above 6,880 should be powerful and push UK FTSE 100 index higher in the coming months.
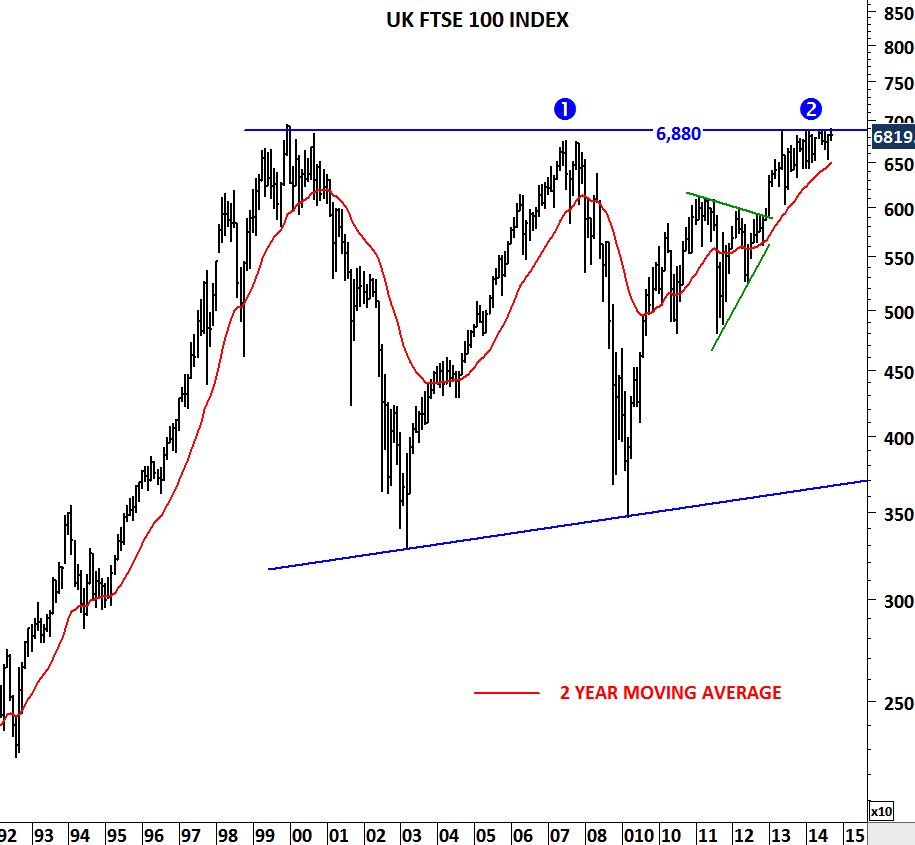
Monthly scale chart of UK FTSE 100 index
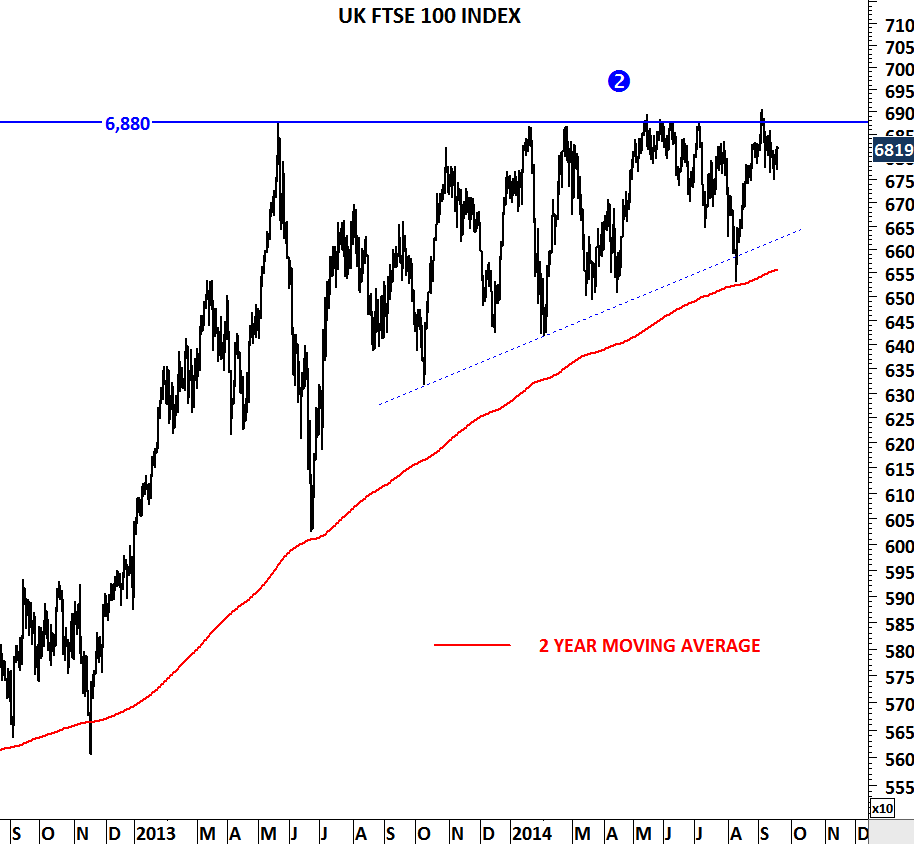
Daily scale chart of UK FTSE 100 index