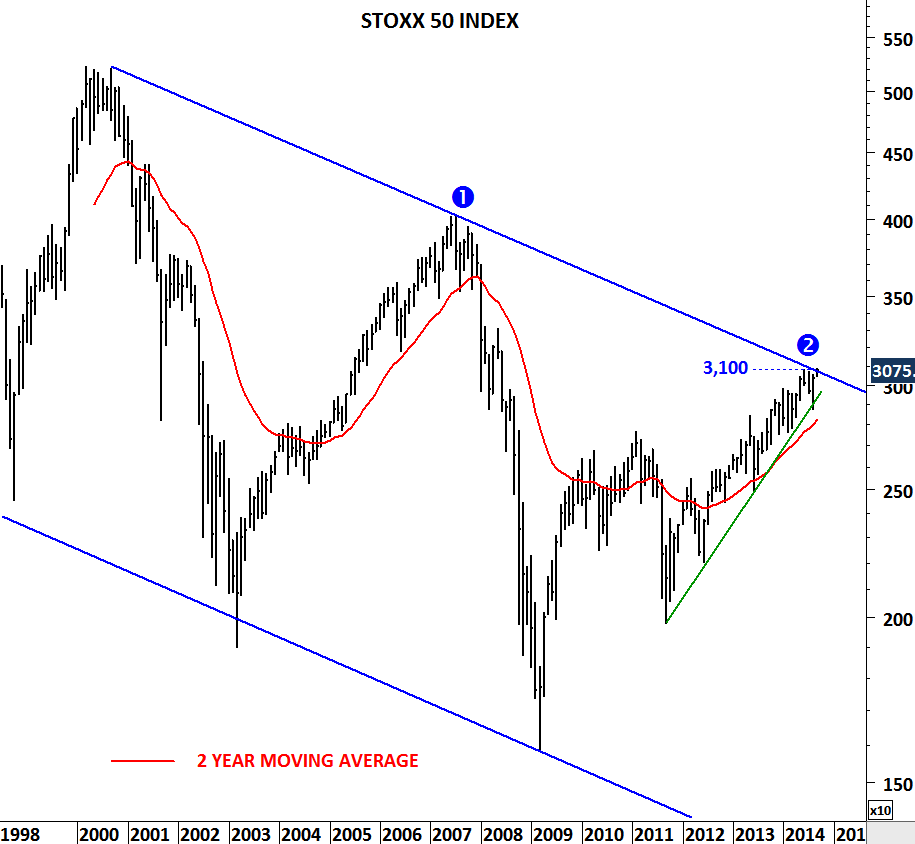
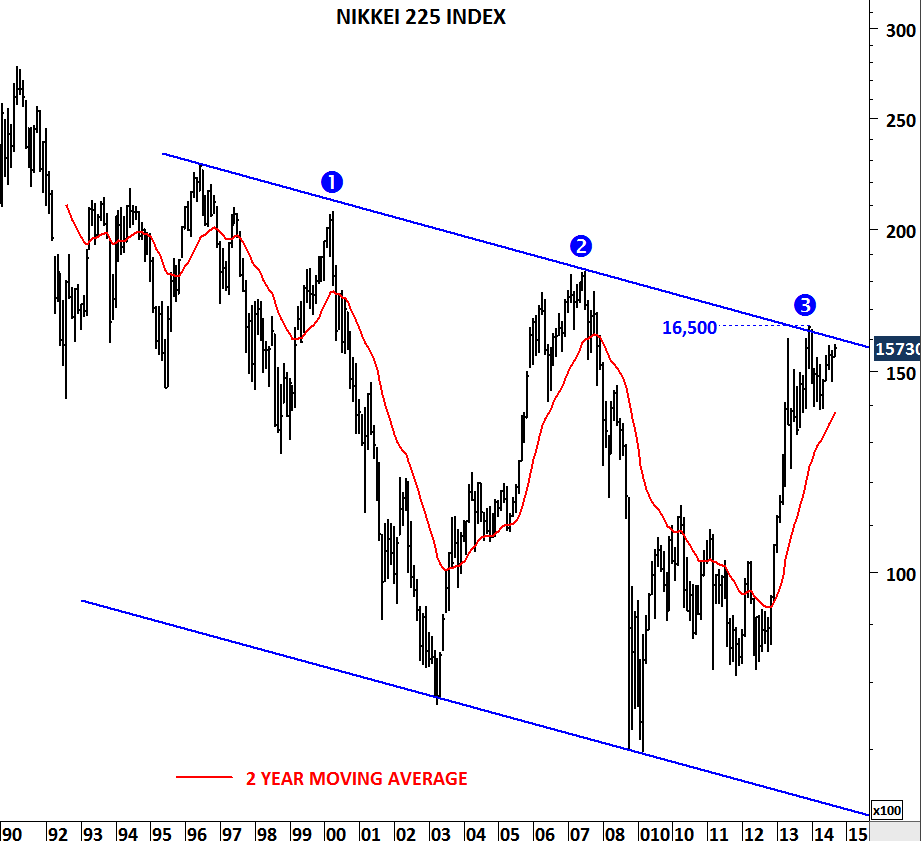
DAX, RUSSELL 2000, NIKKEI, STOXX 50
Global equity markets are experiencing significant weakness. I shared several updates over the past few weeks and updated the latest charts on twitter. It is important to share these updates with Tech Charts followers on different platforms. I’m adding latest tweets below.
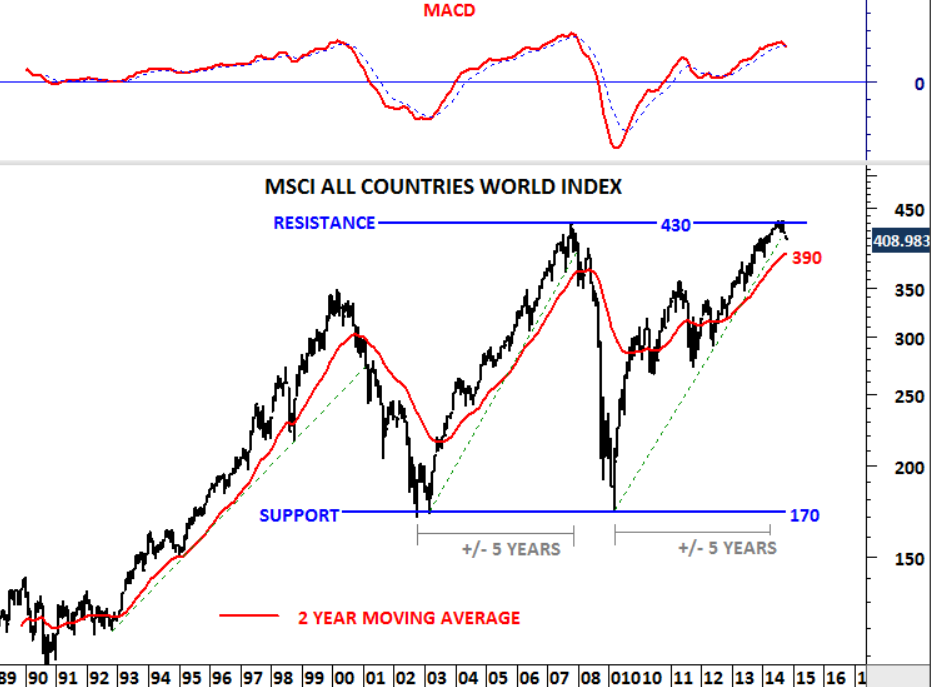
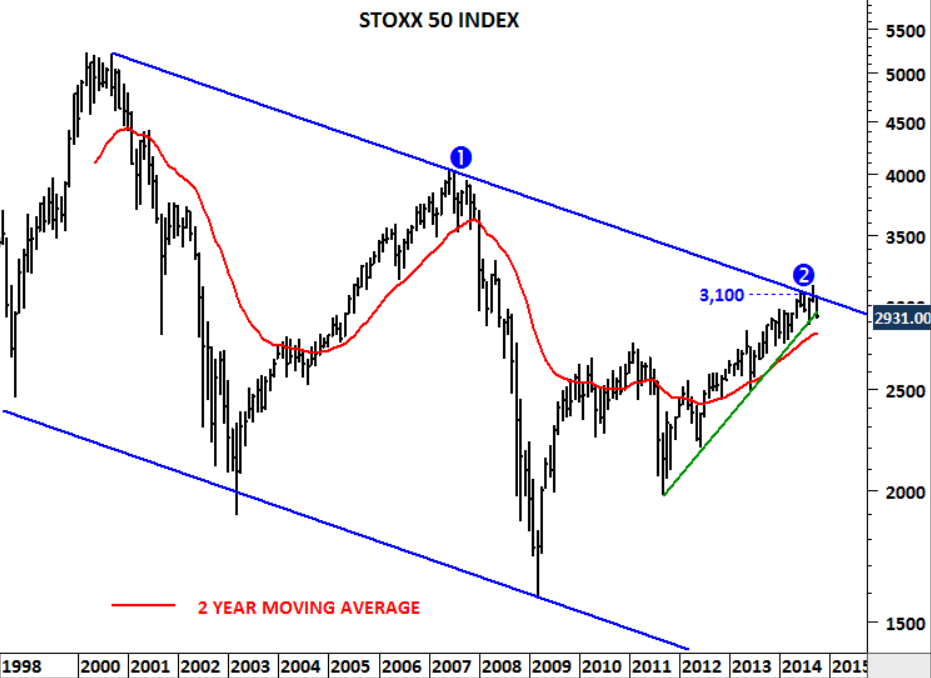
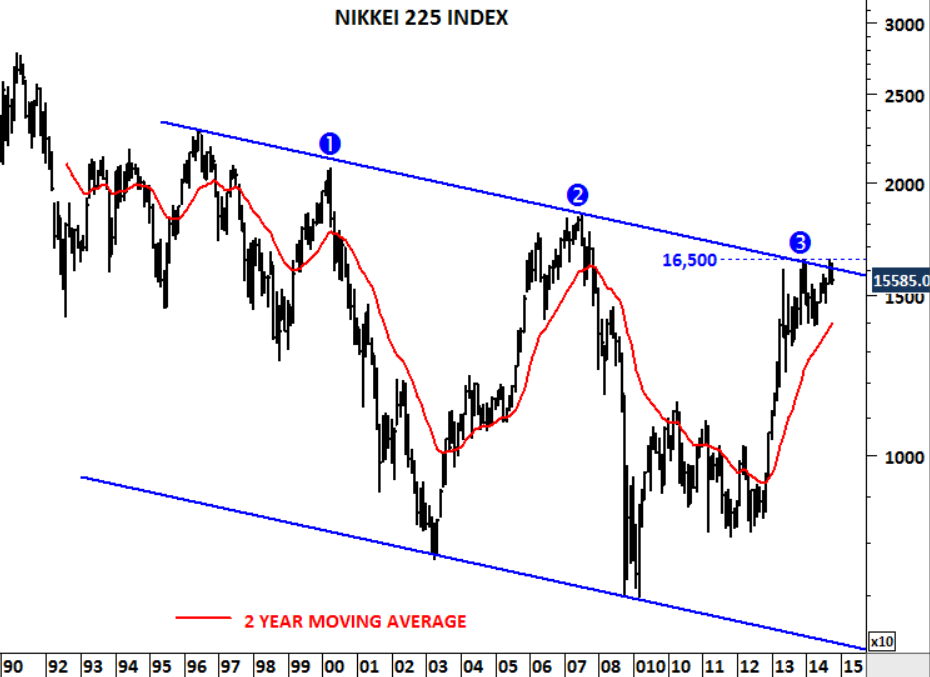
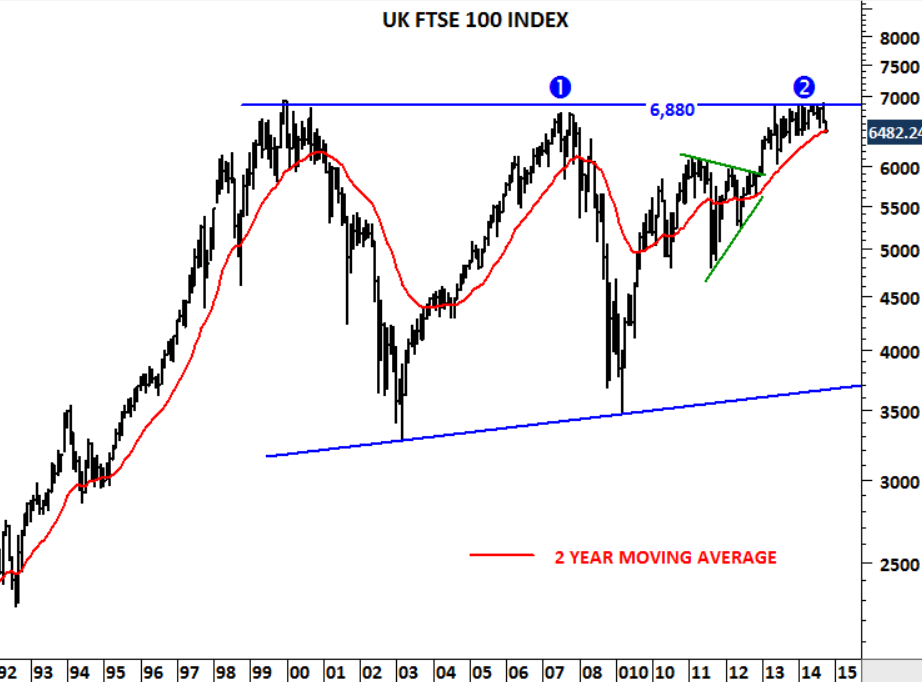
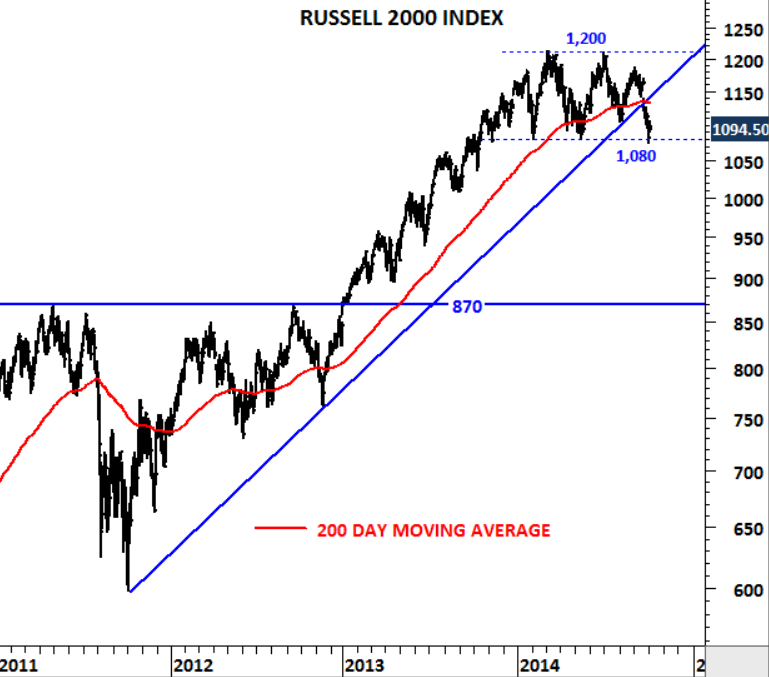
After my routine weekly global equity markets review I saw several major breakdowns suggesting this correction is still at its early stages
— Aksel Kibar, CMT (@TechCharts) October 11, 2014
It's been a pretty bad week for the financial markets. Last week I sent out this update –> http://t.co/OcukBEi9qV
— Aksel Kibar, CMT (@TechCharts) October 11, 2014
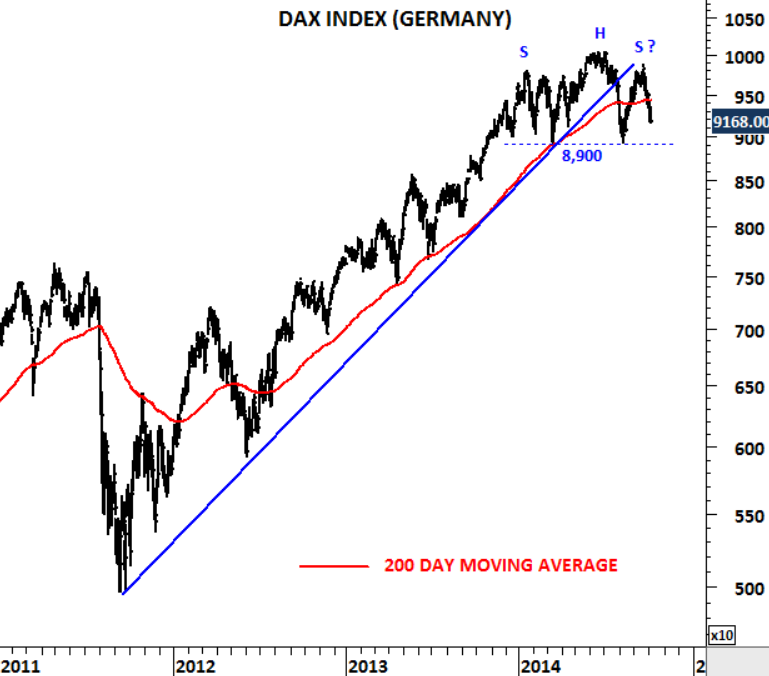
@TechCharts and here are the updated charts on #GERMANY #DAX and #RUSSELL2000 $RUT pic.twitter.com/hHoAK8LeOx
— Aksel Kibar, CMT (@TechCharts) October 11, 2014
@TechCharts I think it is time for defense. Updated charts on global equity benchmarks. pic.twitter.com/Cv2W67NLrl
— Aksel Kibar, CMT (@TechCharts) October 11, 2014
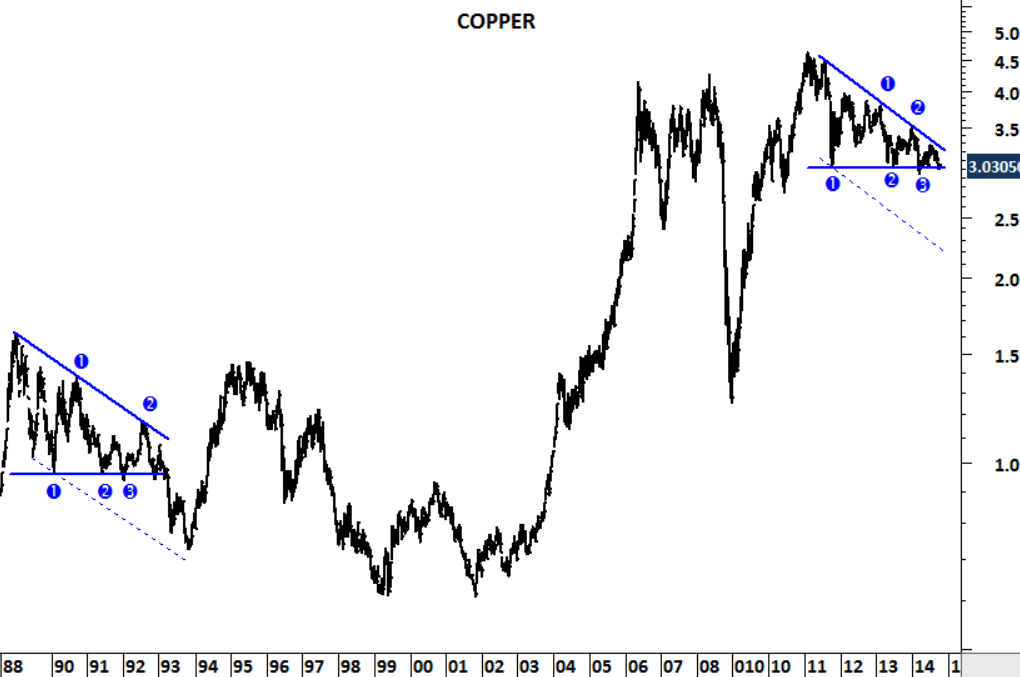
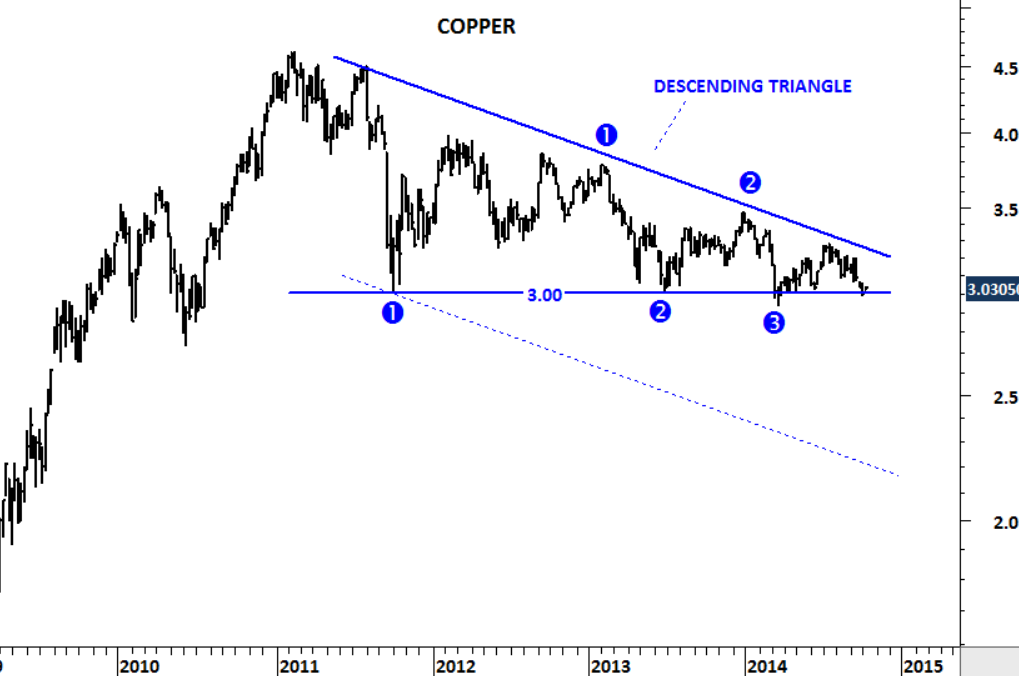
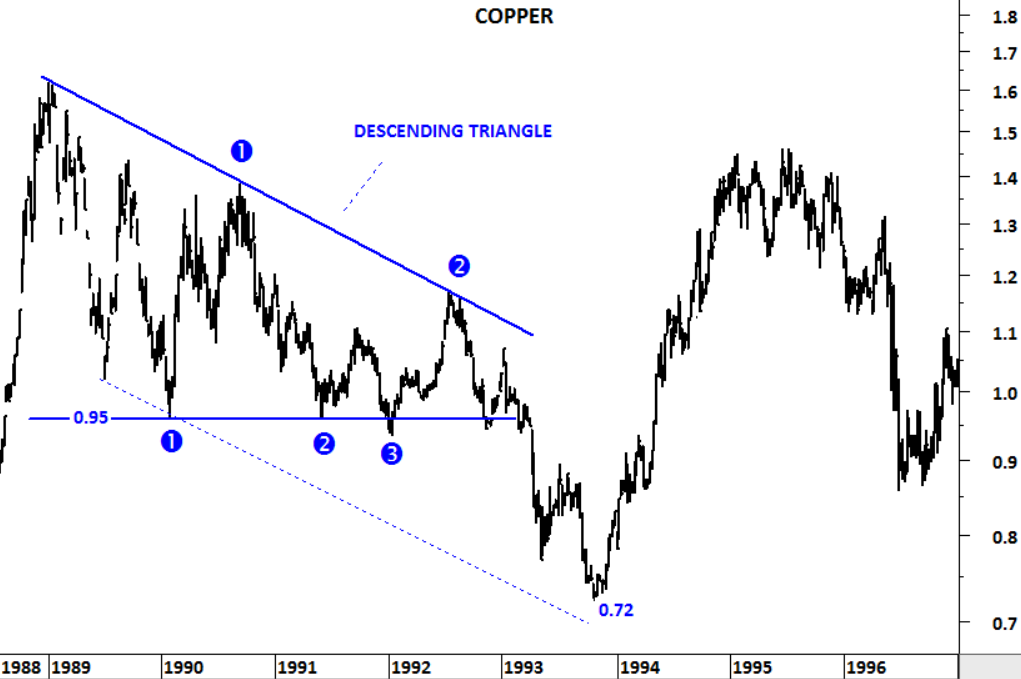
#COPPER breakdown can add fuel to the fire. Watch out this developing bearish chart pattern. $HG_F pic.twitter.com/MiQ0pf3x5z
— Aksel Kibar, CMT (@TechCharts) October 11, 2014