COPPER
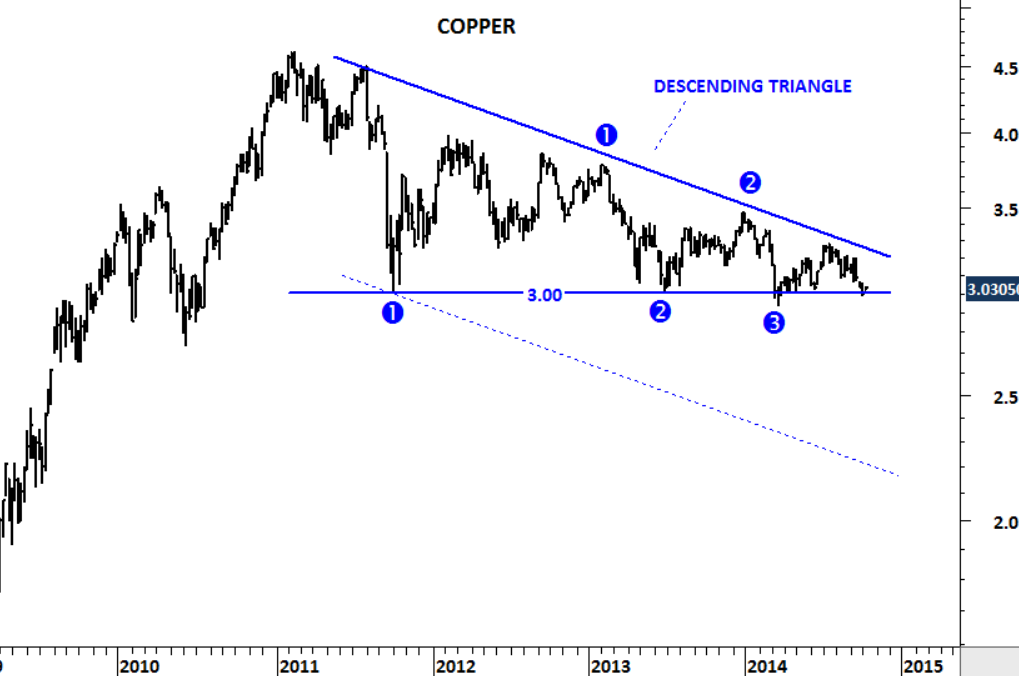
Industrial metals continue to remain weak. Charts warn of a slowdown in global growth. Copper, usually regarded as Dr. Copper due to its leading indicator role for economic growth, is warning us of a possible breakdown and a correction.
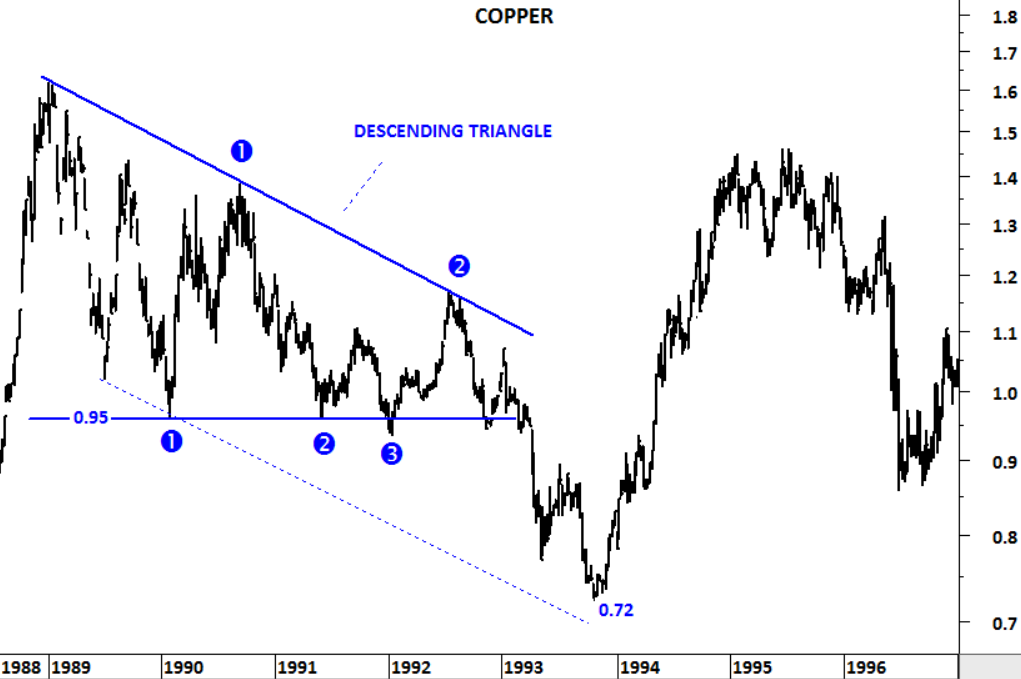
Chart patterns are result of human interaction. Forces of greed and fear meet in the market place and form identifiable patterns on price charts. Descending triangle is one of the common bearish chart pattern. Horizontal support line shows the level where buyers step in. Downward sloping trend line shows the supply (resistance).
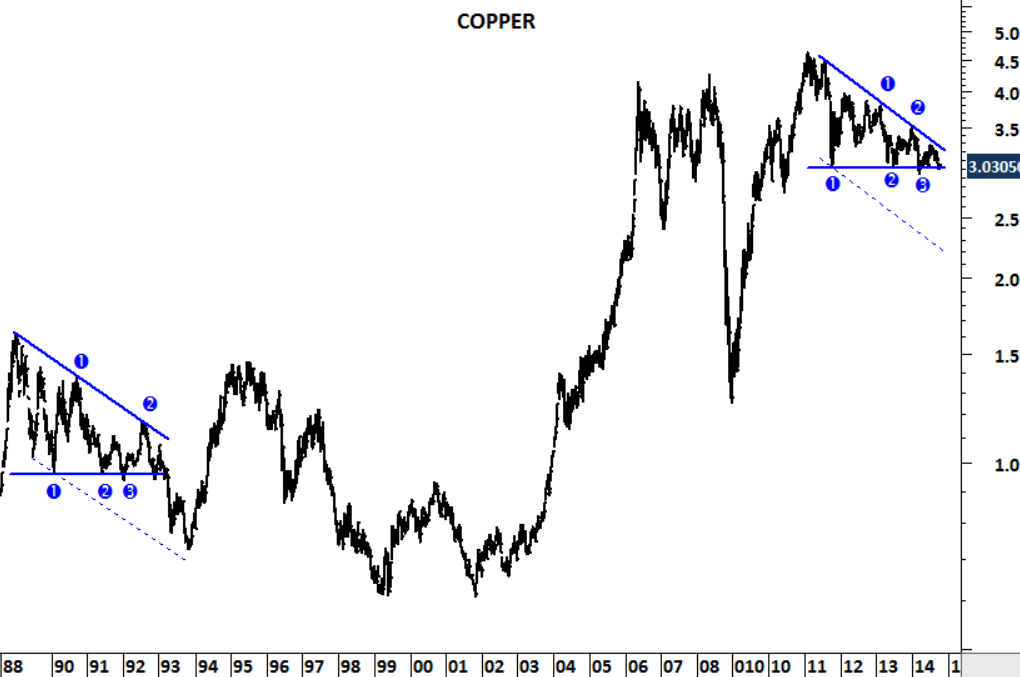
Copper price formed a descending triangle over the past 3 years. Strong support remains at 3 levels. Breakdown below 3 levels can result in a sharp decline towards 2-2.5 range. Latest consolidation should resolve in one direction in the following weeks/month.
Copper had a similar descending triangle during 1989-1993 period. 4 year-year long chart pattern resolved on the downside with the breakdown of 0.95 support level in 1993. In less than six months prices have dropped to 0.72 levels.