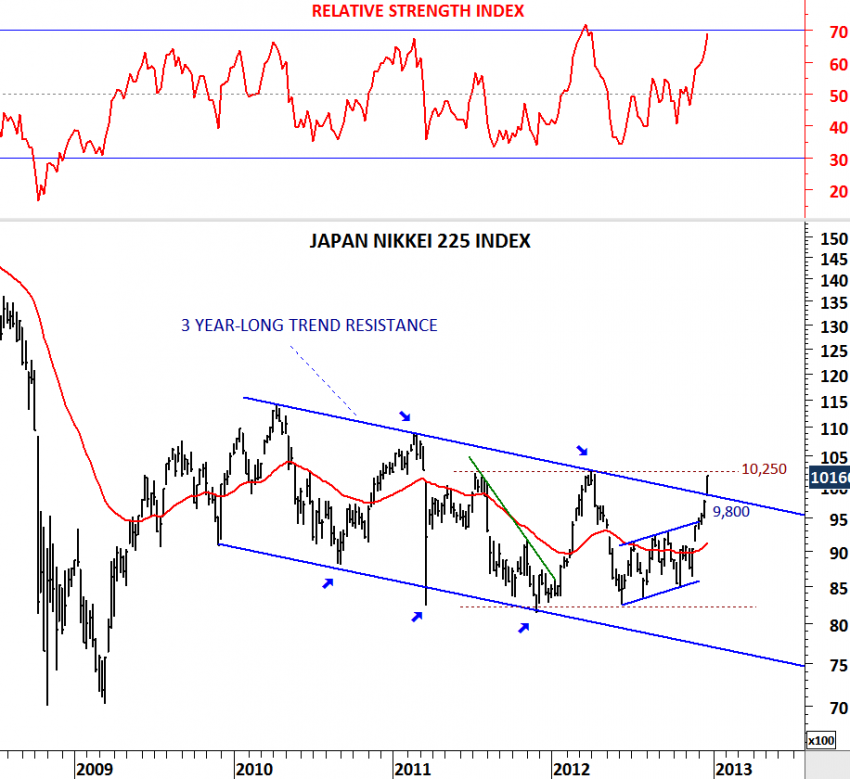
Japanese equities are rising and the Japanese Yen is weakening. These two are not very common comments when we take the Nikkei 225 and USD/JPY medium/long-term price trends into consideration. Nikkei 225 Index has been trending lower in a wide trend channel over the past 3 years. Wide swings have bounced off the boundaries of the downward trend channel several times. With the latest rally from 9,000 levels Japan’s Nikkei 225 Index breached above the 3 year-long trend resistance at 9,850 levels. This is a powerful move and could be the beginning of a larger-scale upward trend. Index will challenge the horizontal resistance at 10,250 levels in the following days. For the latest breakout to be valid and result in further strength towards 11,000-12,000 area, Nikkei 225 Index should not fall below 9,800 levels. In other words index should maintain its move outside of the trend channel.
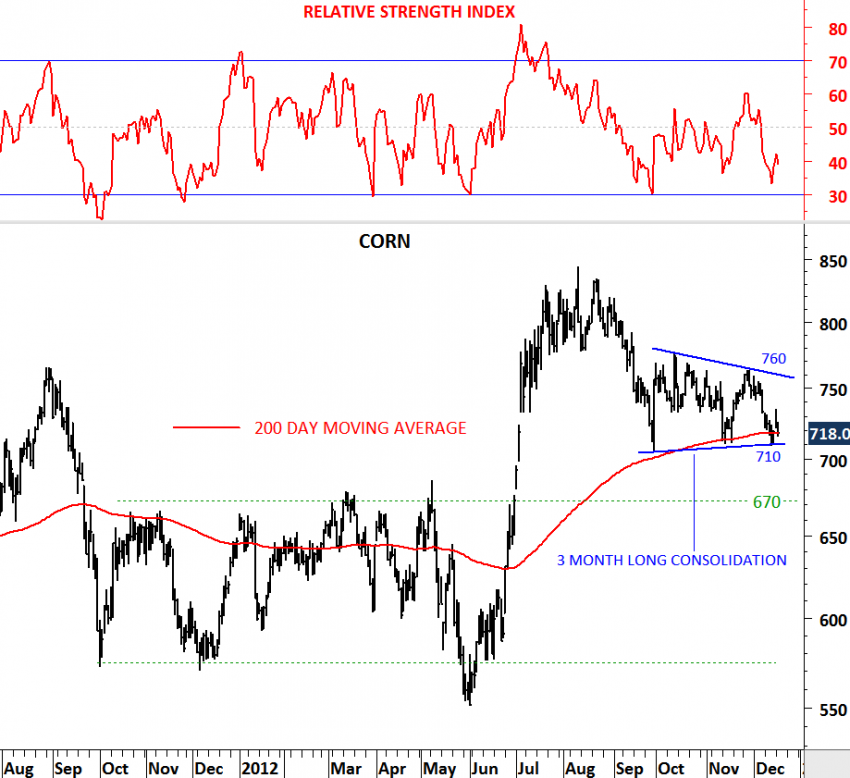
While equities have performed well, commodities have shown relative weakness. From the commodities, agricultural have significantly lagged the rest. The chart below analyzes Corn price over the past 3 months. Sideways consolidation is taking place above the 200-day moving average, which acted as a support for the past 3 months. Boundaries of the possible symmetrical triangle formation are 710 and 760. Failure to hold above 710 levels will push corn price towards 670 levels. It is now the 3rd time that the price is testing the 200-day moving average and a rebound from these levels could target 750 once again. Watch for a direction move in the following weeks.
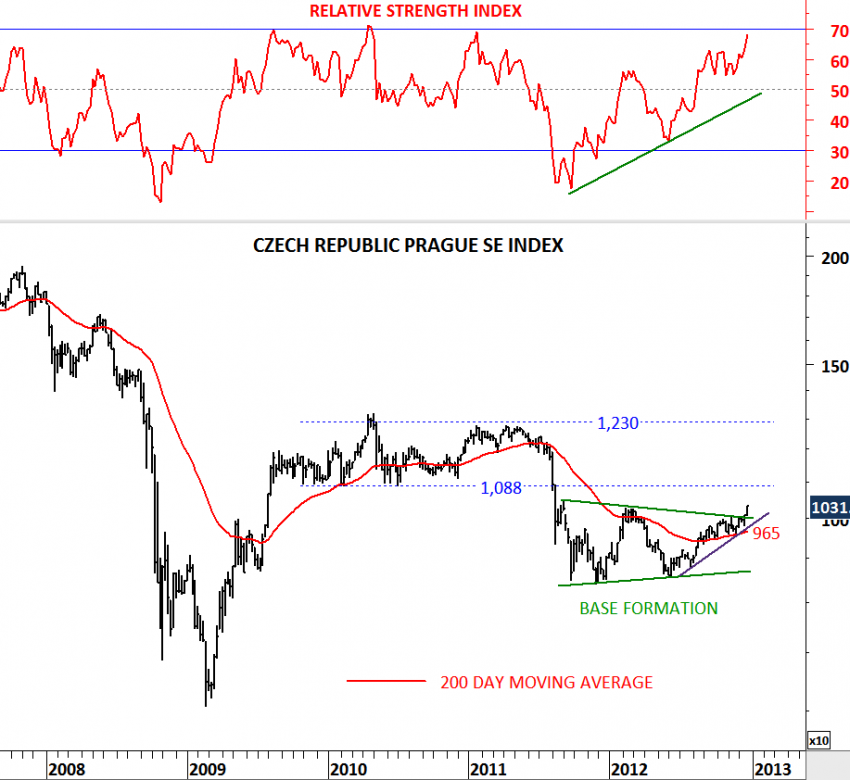
Few days back I gave POLAND WIG20 Index as an example of a 2 year-long flat range breakout. We are seeing global strength in equities and indices are breaking out of long-term consolidation patterns. Today I’m looking at Czech Republic Prague SE Index. Symmetrical triangles are usually formed as continuation patterns. However, it is always better to wait for a breakout as they may turn into a base formation. In Prague SE Index’s case 1.5 year-long sideways consolidation range is breaking out on the upside and should be called as a base formation. The upper boundary of the consolidation range was at 1,010 levels, which was breached on the upside after today’s strong move. First target for the index will be 1,088. Technical outlook turns bullish on the Prague SE Index.
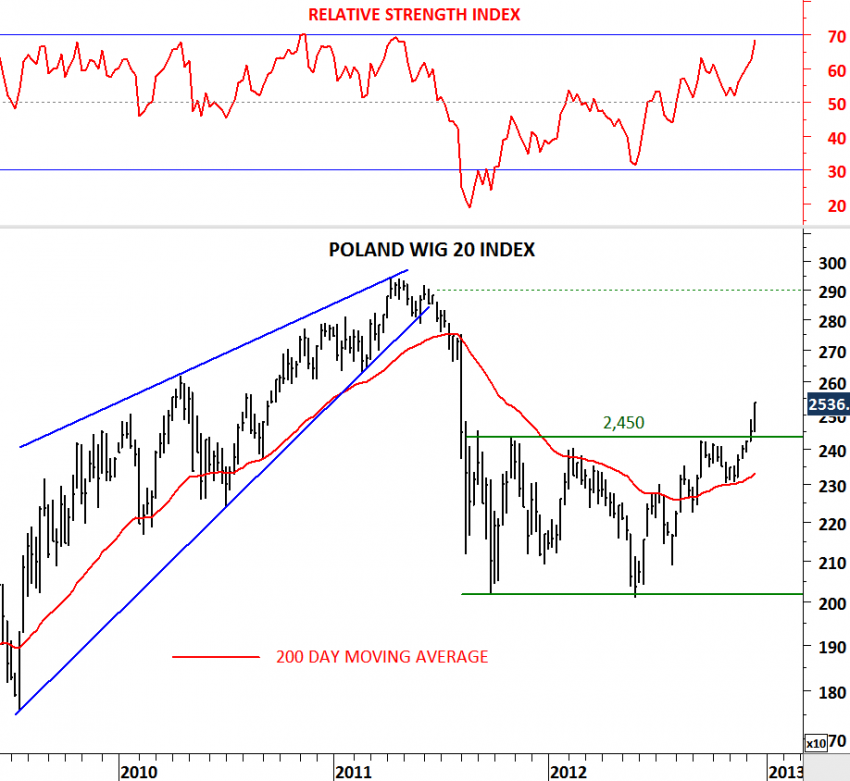
Another perfect example for a flat range breakout can be seen on the WIG 20 Index. Poland’s WIG 20 Index cleared the 2 year-long resistance at 2,450 levels. With last week’s decisive breakout above the strong resistance WIG 20 now targets 2,800-2,900 area. Technical chart pattern can be either analyzed as a rectangle or a double bottom. In both cases, price target is calculated by taking the width of the consolidation range and adding it to the level of the breakout.
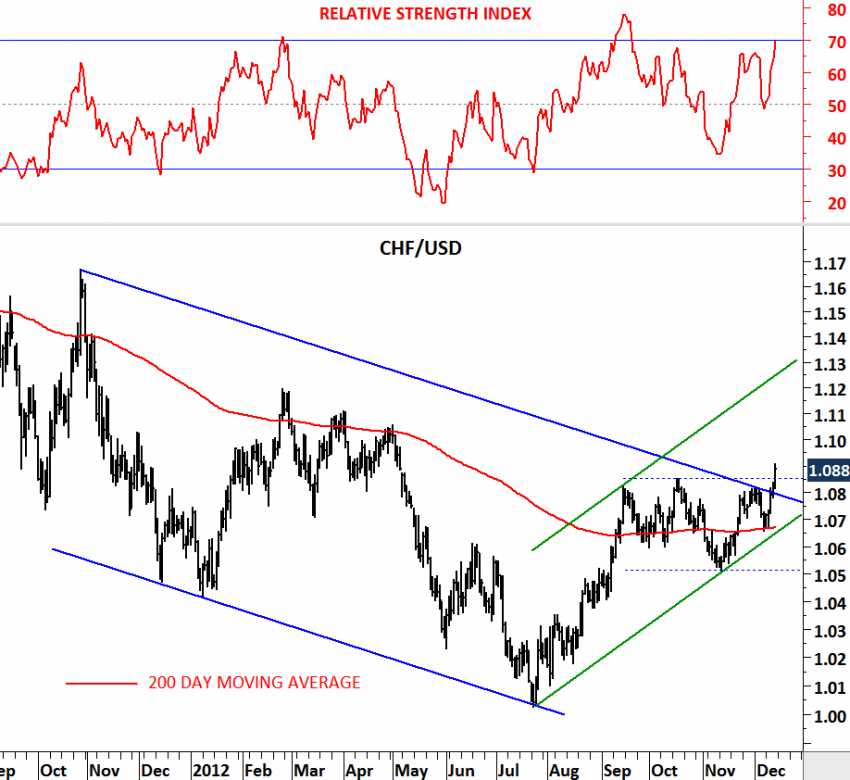
Lengthy consolidation periods are usually followed by strong breakouts. From those breakouts, flat ranges are more reliable. Though one should always be prepared for a false breakout. Friday’s price action on the CHF/USD was strong and the cross rate has clearly breached above the horizontal resistance at 1.085 levels. Since mid-September CHF/USD has been consolidating between 1.05 and 1.085. With stop-loss at 1.08 levels we should watch this cross rate with a positive bias.
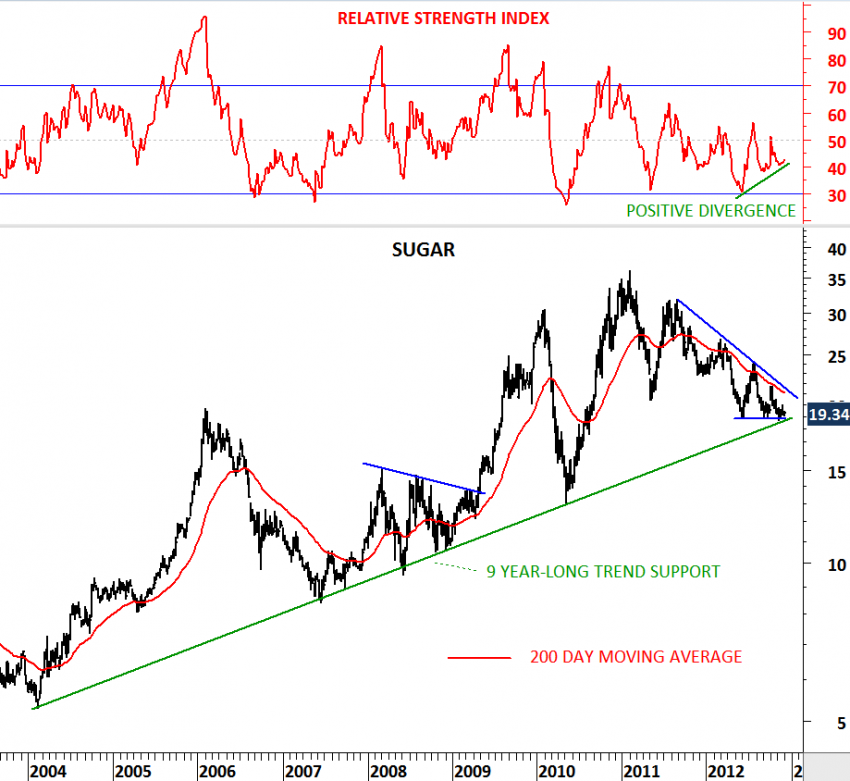
After reversing from 35 levels in the beginning of 2011, Sugar price spent the past two years in a correction by pulling back to its long-term trend line. 9 year-long trend support met the price at 19 levels. As price reached the long-term support, downward momentum weakened and relative strength index generated positive divergences on the weekly scale chart. From a long-term perspective sugar prices might be close to forming a major bottom. While it is still early to call for a reversal and a rebound from the long-term support, we should keep a close eye on this commodity for a strong technical action in the following weeks. Breakdown below 19 levels will be negative in the medium/long-term. For the long-term uptrend to resume, sugar price needs to put a bottom at these levels.

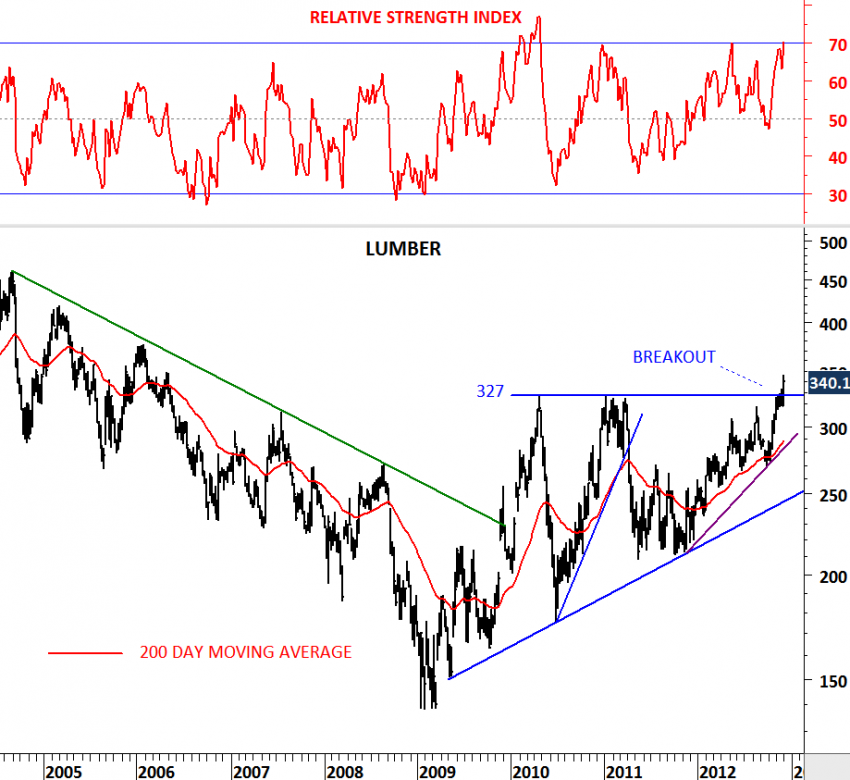
In November I’ve updated the Lumber chart and drew attention to the strong horizontal resistance at 327 levels. This was a 3 year-long resistance and I expected to see a pause after the strong rally. While the price took a breather for few weeks, we haven’t seen much of a pullback from the strong resistance. On the contrary with this week’s strength, Lumber breached above the strong resistance area. Breakout above 327 is extremely bullish for this commodity. 327 levels was tested for the 3rd time over the past 3 years and now the price is above this level. We should watch lumber with a positive bias in the following weeks. We are likely to see higher prices.


Previous week is revised upwards by 6,000 and this week’s data on initial jobless claims skyrocketed. We have been following this chart for some time and the loss of momentum on the downside was signaling a possible reversal on the initial jobless claims. I’ve mentioned the importance of the 52-week average as a strong resistance. With this week’s shocking 78,000 surge on jobless claims, we are now clearly above the year-long average. While we should give this week’s number the benefit of the doubt due to effect of the hurricane, bringing the jobless claims below the 375K level once again will not be easy. 2009-2012 downtrend might be over.
It’s been an exciting period watching global economies constantly trying to devalue their currencies with the aim of increasing demand for their goods and services. Financial media is covering this under “currency wars”. Weak currencies are good for economies because countries will be able to export more… Though let’s not forget that there is a fine balance between a weak currency helping the trade balance and a weak currency triggering a currency crisis.

Turkish lira enjoyed a stable decade when compared with 1990s. Decade-long sideways consolidation between 1.15 and 1.75 levels helped the economy and reversed the so-called dollarization of the economy. High inflation led to single digit inflation and U.S. dollar deposit accounts that were held at banks were switched to Turkish Lira deposits. However, with an overvalued currency Turkey started experiencing widening trade deficit. In the beginning of 2011, USD/TL was standing at 1.50 levels. Over the past two years USD/TL moved higher and breached above the decade-long consolidation range. Upper boundary of the consolidation range was at 1.76. This level acted as strong resistance for more than a decade. After the breakout above strong resistance in the last quarter of 2011, 1.76 became strong support (resistance becomes support and vice versa). With the support of central banks over the past two years, Turkish Lira remained weak against the U.S. dollar and consolidated between 1.76 and 1.90.

Given that the volatility reached a 6 month low — a technical condition that usually suggests a strong trend in the near term, breakout above the last one year’s consolidation range can actually do more harm to the economy than supporting the trade balance. Turkish lira can experience a fast devaluation if we see a breakout above 1.83 levels in the short-term.

From a technical analysis point of view, these type of consolidations are usually followed by a surge in volatility and a strong directional movement. In the following weeks/months we need to watch USD/TL with the possibility of a breakout. Strong support is at 1.76 and resistance is at 1.83.