CORN
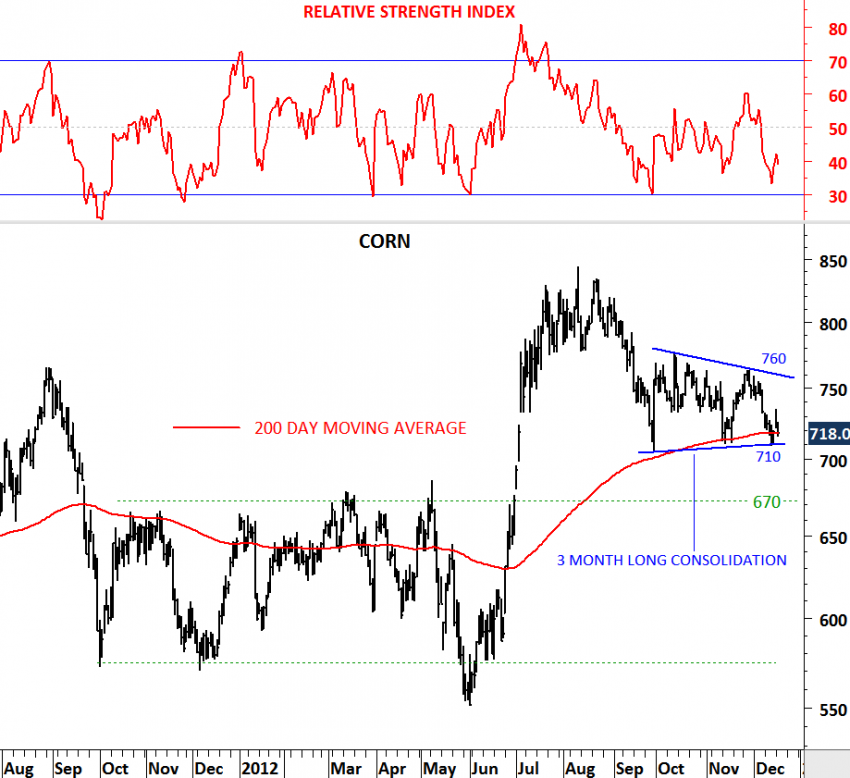
While equities have performed well, commodities have shown relative weakness. From the commodities, agricultural have significantly lagged the rest. The chart below analyzes Corn price over the past 3 months. Sideways consolidation is taking place above the 200-day moving average, which acted as a support for the past 3 months. Boundaries of the possible symmetrical triangle formation are 710 and 760. Failure to hold above 710 levels will push corn price towards 670 levels. It is now the 3rd time that the price is testing the 200-day moving average and a rebound from these levels could target 750 once again. Watch for a direction move in the following weeks.

