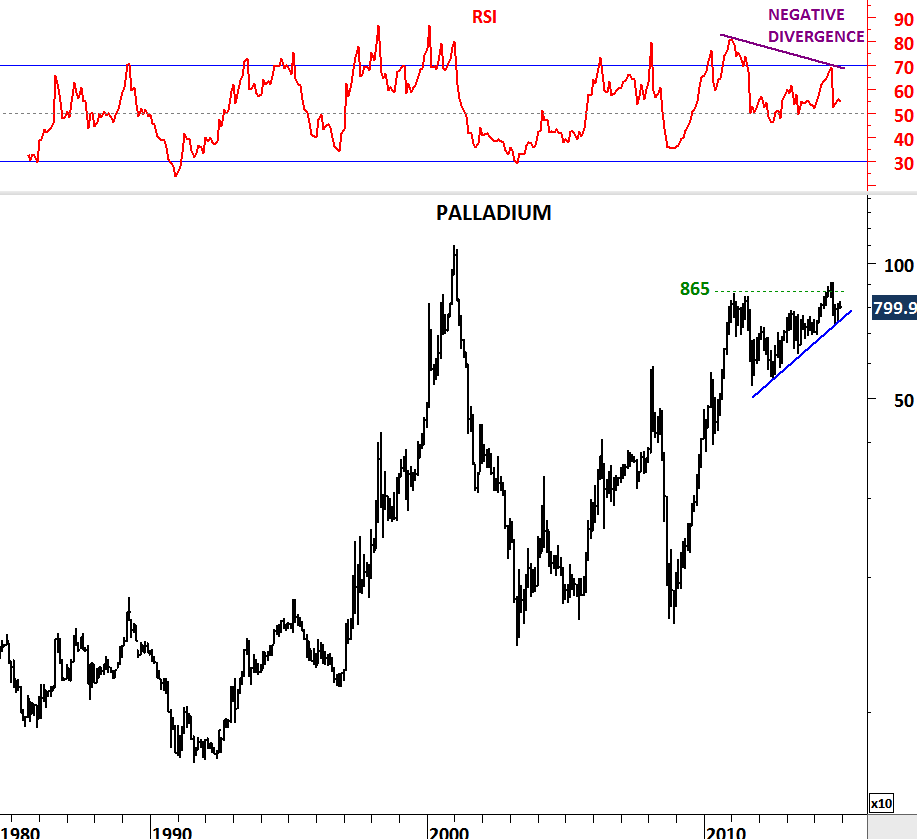
OATS

OATS

Long-term symmetrical triangles are powerful chart patterns to trade. They have defined boundaries and breakouts from these type of consolidation patterns are usually followed by strong trend periods. Consolidation ranges are considered to be low volatility periods where price fluctuates around the moving averages. Low volatility periods are followed by high volatility periods and vice versa. As a result long-term consolidation patterns unfold into a large-scale up/down trend periods.

SOY MEAL

In March 2012 we have identified a 4 year-long symmetrical triangle on Soy Meal. Breakout from this chart pattern resulted in a multi-month uptrend. Similar technical set-up is present on Oats price chart after 4 year-long sideways consolidation. Breakout above 400 levels could result in a strong uptrend. Soy Meal reached its price target at 550 levels. After a confirmed breakout I will update this chart with the possible price targets. For now we should put Oats on our watch list for a possible strong breakout.

COTTON

COTTON

Long base formation on Cotton price might be close to completion with soft agricultural commodity breaching the 5 month-long horizontal resistance at 77.60 levels. The chart analyzes ICE Cotton May 13 futures price. Chart pattern can be defined as an ascending triangle or cup with handle formation with a round base that is spread over a 6 month period. Recent strength comes after low a volatility period thus increasing the likelihood of an upward trend. If cotton price remains above 77.60 over the next few days, we should expect acceleration on the upside towards 83 levels.

CHINA GDP & CHINA SSE 50 INDEX

In April 2012 I analyzed the downtrend on the Chinese GDP and the SSE 50 Index (April 13, 2012 – SSE50 Index & China GDP). Chinese equities were trending lower since the mid-2009 and the GDP growth since the beginning of 2010. Equity markets acted as a perfect leading indicator. I’ve concluded that until we see a change in trend on the equity market performance, which was a clear downward trend at that time, we should expect lower GDP growth for the Chinese economy. At the time of the analysis quarterly GDP figure stood at 8.1 % and the SSE 50 Index was around 1,700 levels. In the 2nd and 3rd quarter of 2012, equity indices resumed their downtrend and the GDP dipped to 7.4%.

SSE 50 INDEX II

CHINA GDP II

4th quarter GDP for the Chinese economy is expected on the 17th of January. Overall growth is anticipated to rise by 7.8% annually in the fourth quarter. This will be an improvement from the third quarter, when the economy expanded by 7.4%, and would be the first uptick in growth since the beginning of 2010. By looking at stock market performance over the past few months we can say that equities are signaling a turnaround in the economy and the growth rates and possibly putting a medium term bottom at these levels. Breakout above the 2 year-long downtrend on the SSE 50 Index is bullish for the chinese equities and should be backed by strong economic data.

CHINA SSE 50 INDEX

SSE 50 INDEX

After more than 3 year-long downtrend, Chinese equity index SSE 50 is now showing signs of strength. In the last part of 2012, Chinese equities rallied sharply from three-year low levels. Sharp reversal on the SSE 50 Index first breached the long-term moving average at 1,670 levels and then broke above the downward trend line at 1,750 levels. We are likely to see a change in trend in the medium/long-term and this could result in a outperformance for the Chinese equities over the coming months. Latest breakouts are significant and  will have bullish implications for Shanghai indices.

JAPAN NIKKEI 225

NIKKEI 225

Japanese equities are rising and the Japanese Yen is weakening. These two are not very common comments when we take the Nikkei 225 and USD/JPY medium/long-term price trends into consideration. Nikkei 225 Index has been trending lower in a wide trend channel over the past 3 years. Wide swings have bounced off the boundaries of the downward trend channel several times. With the latest rally from 9,000 levels Japan’s Nikkei 225 Index breached above the 3 year-long trend resistance at 9,850 levels. This is a powerful move and could be the beginning of a larger-scale upward trend. Index will challenge the horizontal resistance at 10,250 levels in the following days. For the latest breakout to be valid and result in further strength towards 11,000-12,000 area, Nikkei 225 Index should not fall below 9,800 levels. In other words index should maintain its move outside of the trend channel.

CORN

CORN

While equities have performed well, commodities have shown relative weakness. From the commodities, agricultural have significantly lagged the rest. The chart below analyzes Corn price over the past 3 months. Sideways consolidation is taking place above the 200-day moving average, which acted as a support for the past 3 months. Boundaries of the possible symmetrical triangle formation are 710 and 760. Failure to hold above 710 levels will push corn price towards 670 levels. It is now the 3rd time that the price is testing the 200-day moving average and a rebound from these levels could target 750 once again. Watch for a direction move in the following weeks.

CZECH REPUBLIC PRAGUE SE INDEX

PRAGUE SE INDEX

Few days back I gave POLAND WIG20 Index as an example of a 2 year-long flat range breakout. We are seeing global strength in equities and indices are breaking out of long-term consolidation patterns. Today I’m looking at Czech Republic Prague SE Index. Symmetrical triangles are usually formed as continuation patterns. However, it is always better to wait for a breakout as they may turn into a base formation. In Prague SE Index’s case 1.5 year-long sideways consolidation range is breaking out on the upside and should be called as a base formation. The upper boundary of the consolidation range was at 1,010 levels, which was breached on the upside after today’s strong move. First target for the index will be 1,088. Technical outlook turns bullish on the Prague SE Index.

POLAND WIG 20 INDEX

POLAND WIG20 INDEX

Another perfect example for a flat range breakout can be seen on the WIG 20 Index. Poland’s WIG 20 Index cleared the 2 year-long resistance at 2,450 levels. With last week’s decisive breakout above the strong resistance WIG 20 now targets 2,800-2,900 area. Technical chart pattern can be either analyzed as a rectangle or a double bottom. In both cases, price target is calculated by taking the width of the consolidation range and adding it to the level of the breakout.

CHF/USD

CHFUSD

Lengthy consolidation periods are usually followed by strong breakouts. From those breakouts, flat ranges are more reliable. Though one should always be prepared for a false breakout. Friday’s price action on the CHF/USD was strong and the cross rate has clearly breached above the horizontal resistance at 1.085 levels. Since mid-September CHF/USD has been consolidating between 1.05 and 1.085. With stop-loss at 1.08 levels we should watch this cross rate with a positive bias.