
US DOLLAR/INDONESIAN RUPIAH
It’s been the year of the U.S. dollar. USD gained strength against most of the developed and emerging market currencies. Central Banks in emerging markets had to adjust interest rates to control currency depreciation. There is one emerging market cross rate that is worth paying attention to. Worst might not be over for the Indonesian rupiah as the USD/IDR cross rate challenges decade-long horizontal resistance. Breakouts from such long-term consolidations usually signal major shift in sentiment and also stress for the economic conditions. USD/IDR is testing critical levels and a breakout above 12,400 levels can result in a sharp depreciation of the currency.
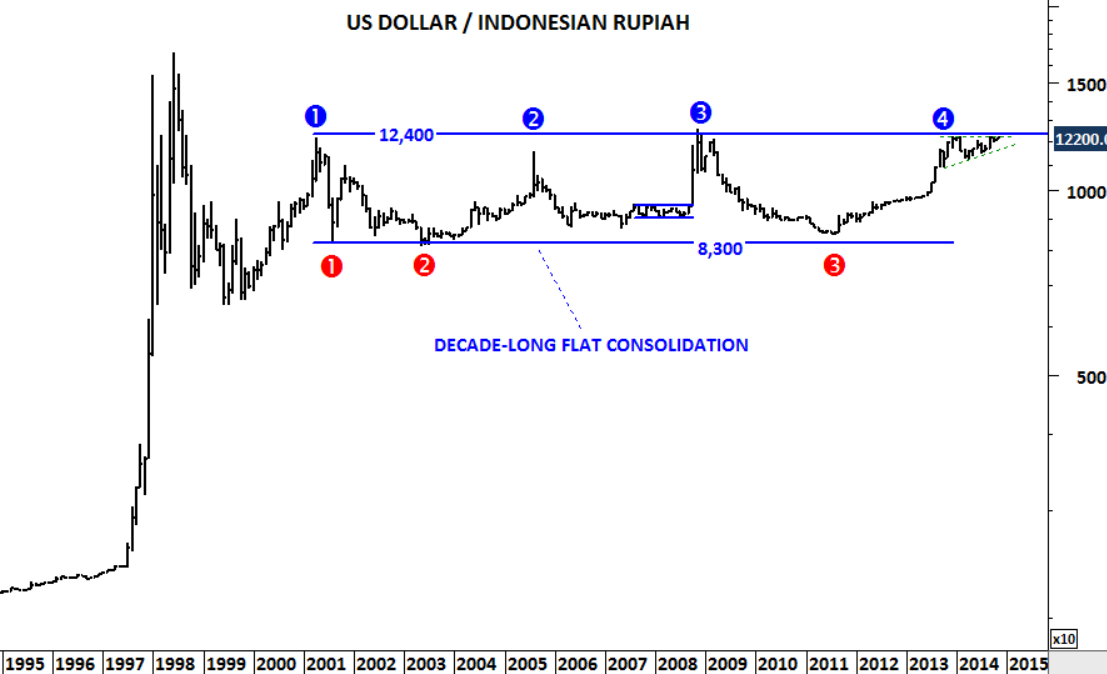
Monthly scale price chart of the US Dollar / Indonesian Rupiah
Weekly scale chart shows the ascending triangle chart pattern – usually regarded as a bullish development in technical analysis. Both the boundaries of the ascending triangle and the decade-long flat consolidation range are overlapping at 12,400 levels – a technical condition that increases the validity of the resistance level.
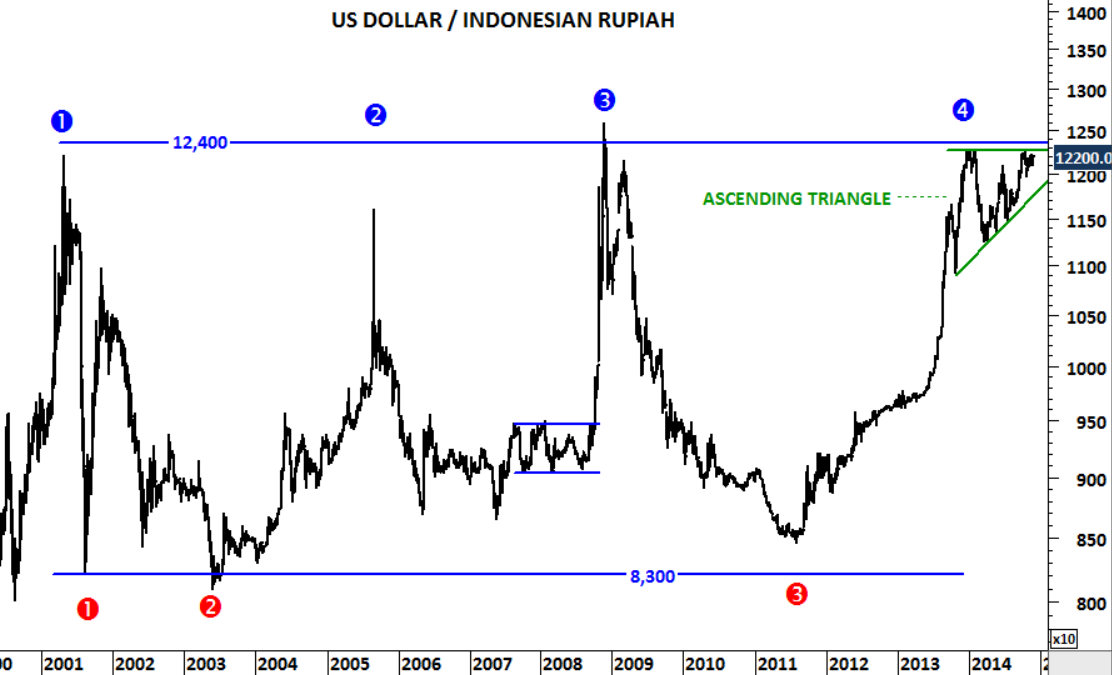
Weekly scale price chart of the U.S. Dollar / Indonesian Rupiah