Posts

US DOLLAR/INDONESIAN RUPIAH

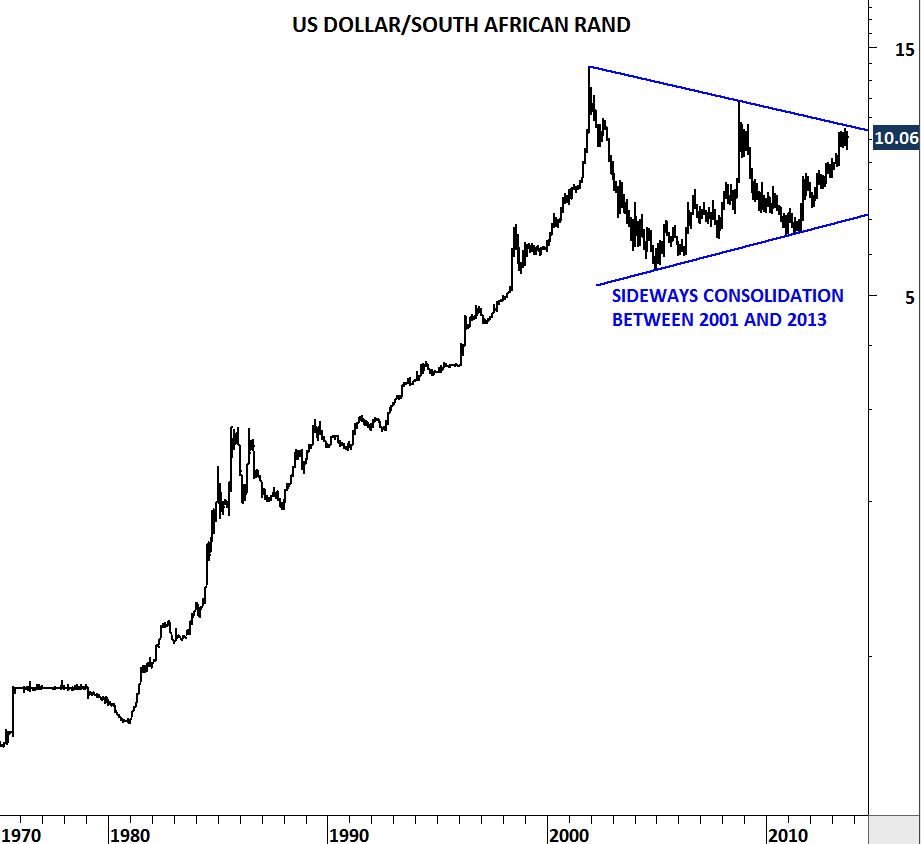
U.S. dollar remains strong against major cross rates. U.S. dollar strength is a long-term theme and it’s here to stay in the coming months. The most vulnerable group is the emerging market currencies. We have seen significant weakness in emerging market currencies over the past year. Long-term charts suggest further weakness for the emerging market currencies.

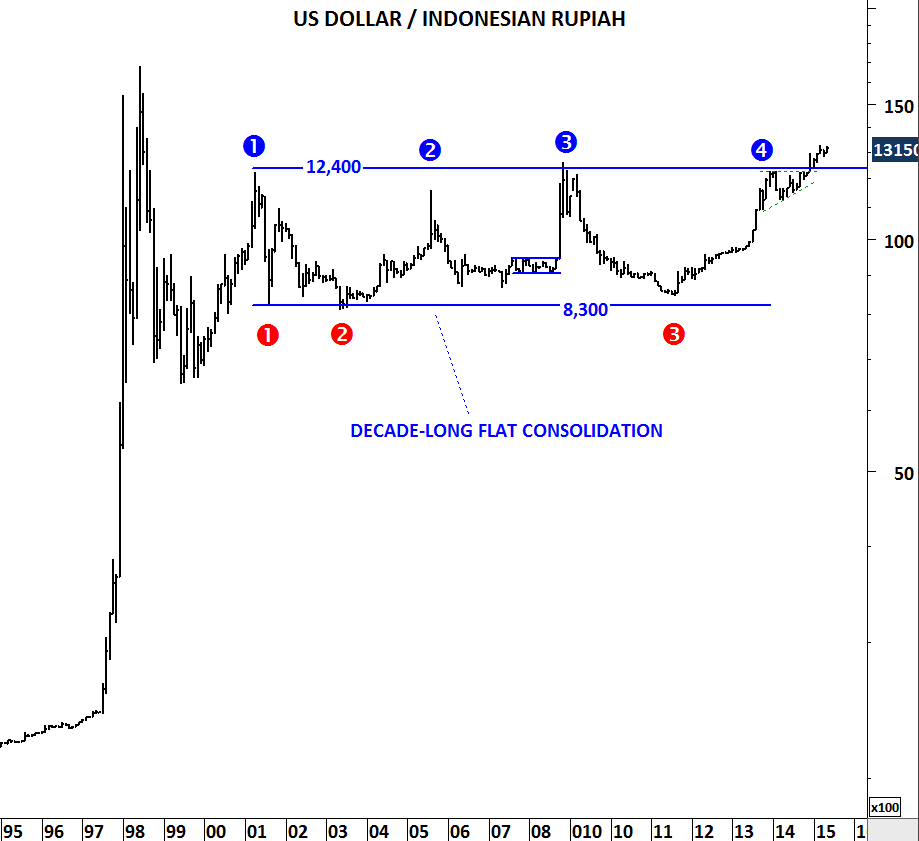
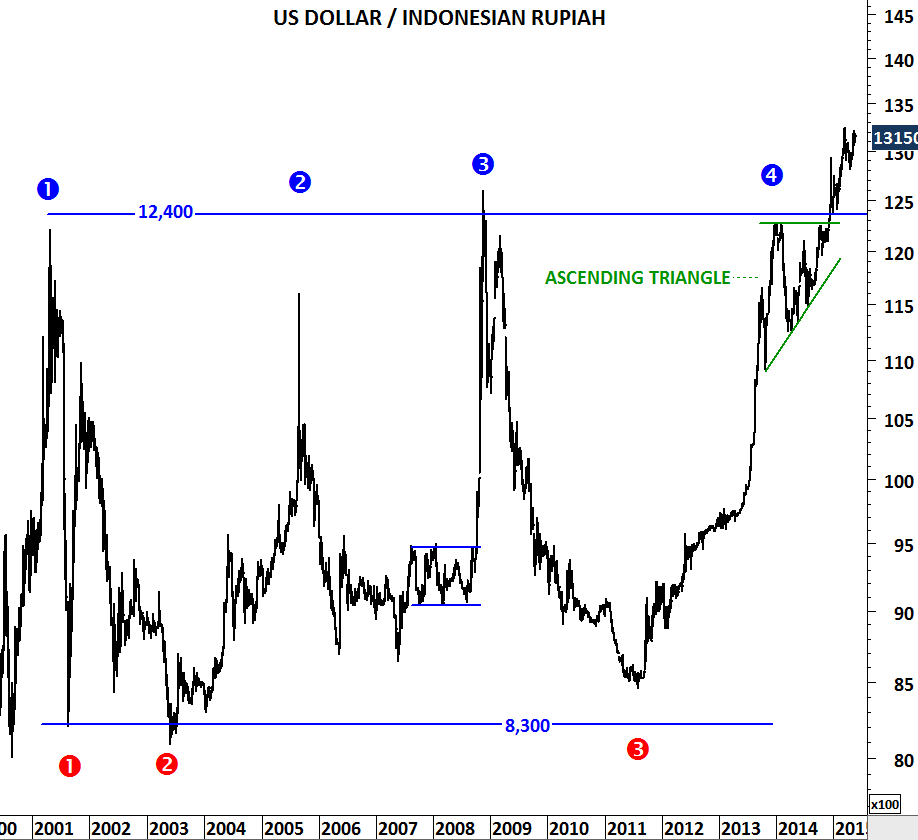
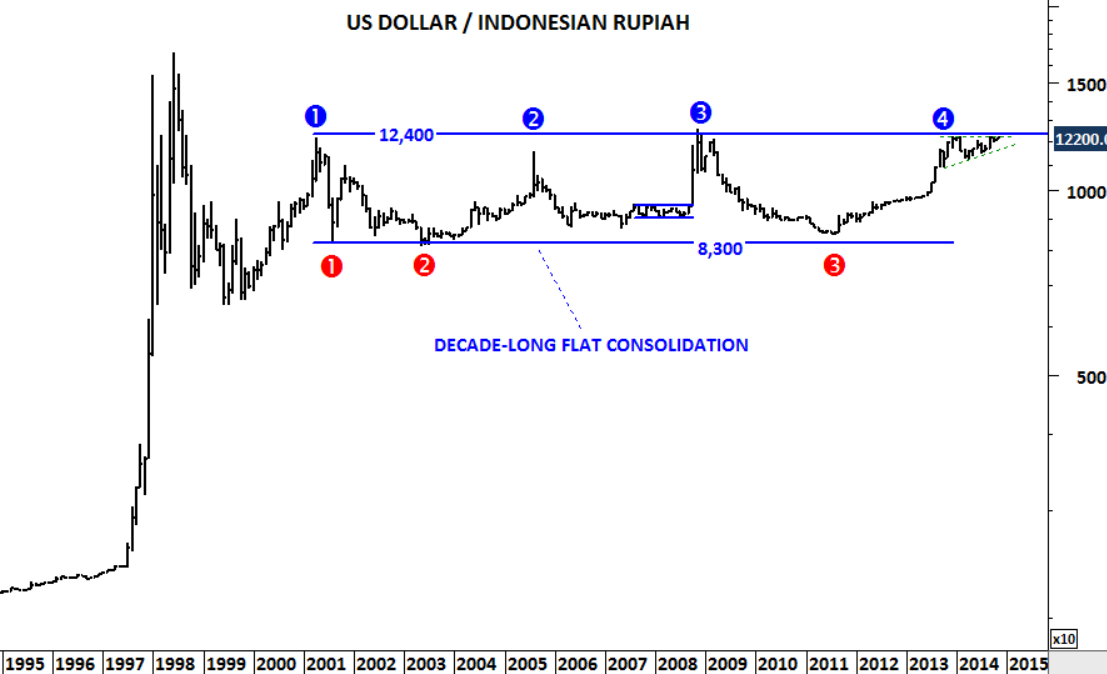
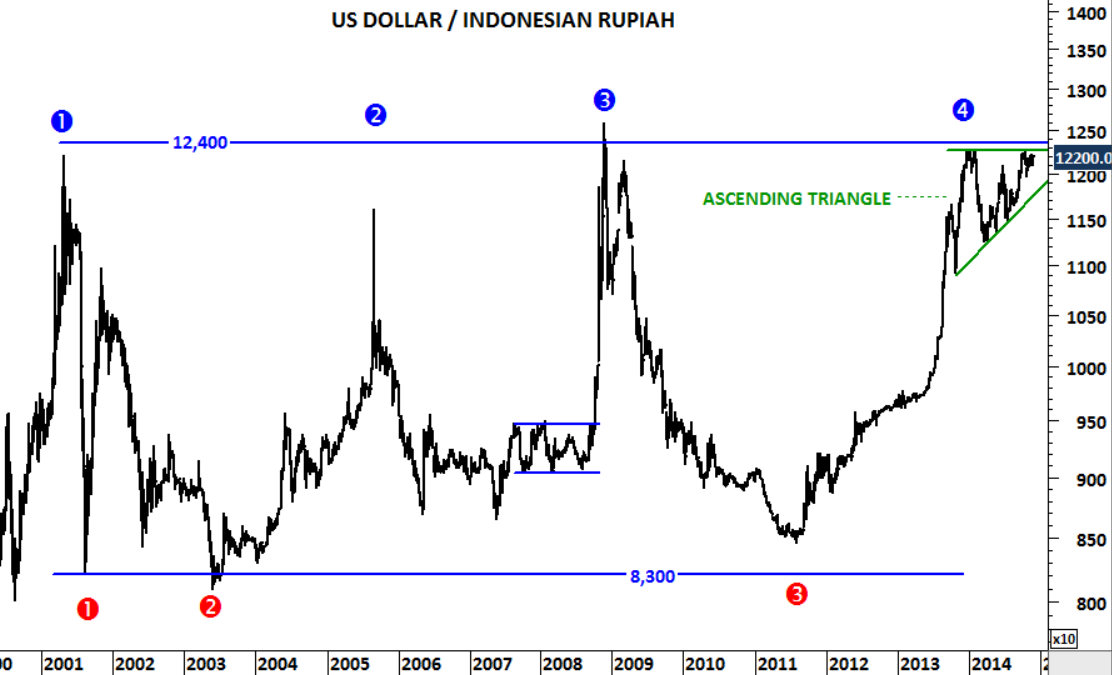
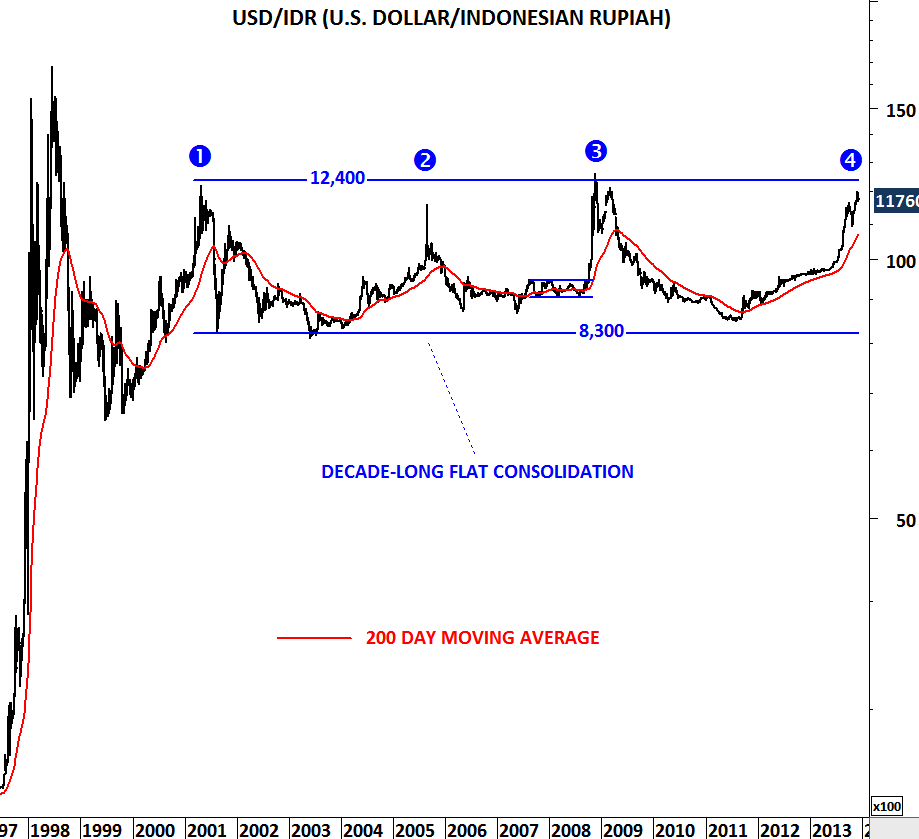
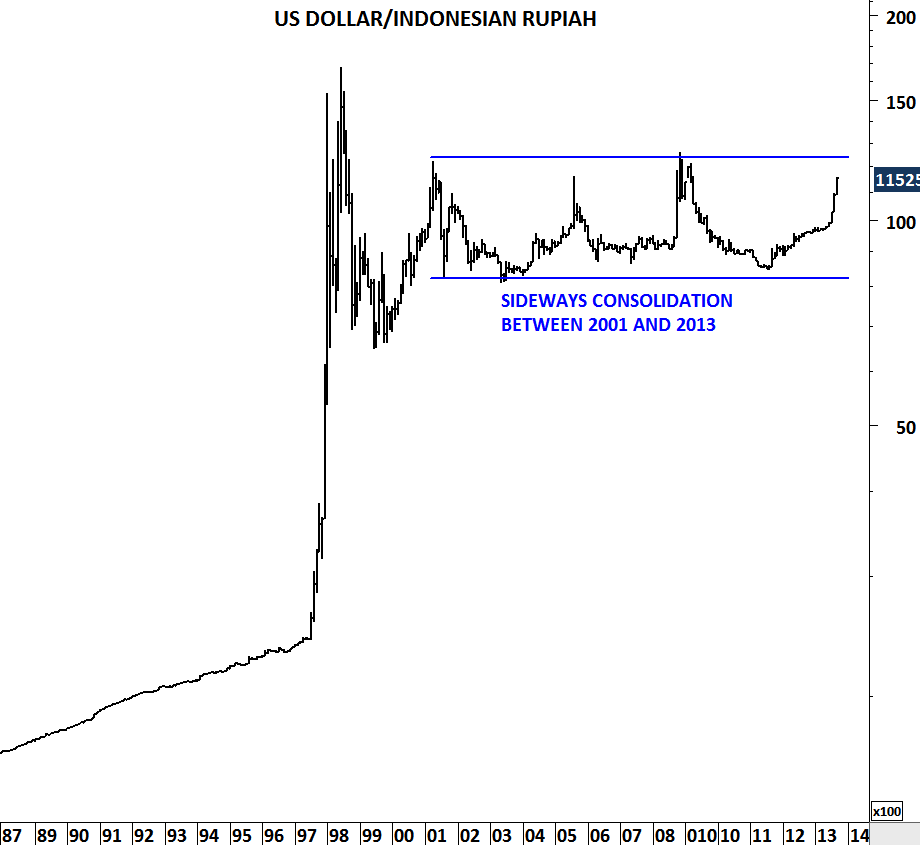
From the EM group Indonesian Rupiah is exposed to sharp depreciation. USD/IDR is breaking out of a decade-long horizontal consolidation. Breakout from long-term chart patterns are usually followed by strong trend periods. In the last quarter of 2014, USD/IDR broke above 12,400 levels – strong resistance since 2001. As long as the cross rate remains above 12,400, we will expect higher levels in the coming months.

USDIDR I

USDIDR II

US DOLLAR/INDONESIAN RUPIAH

It’s been the year of the U.S. dollar. USD gained strength against most of the developed and emerging market currencies. Central Banks in emerging markets had to adjust interest rates to control currency depreciation. There is one emerging market cross rate that is worth paying attention to. Worst might not be over for the Indonesian rupiah as the USD/IDR cross rate challenges decade-long horizontal resistance. Breakouts from such long-term consolidations usually signal major shift in sentiment and also stress for the economic conditions. USD/IDR is testing critical levels and a breakout above 12,400 levels can result in a sharp depreciation of the currency.

USDIDR

Monthly scale price chart of the US Dollar / Indonesian Rupiah

Weekly scale chart shows the ascending triangle chart pattern – usually regarded as a bullish development in technical analysis. Both the boundaries of the ascending triangle and the decade-long flat consolidation range are overlapping at 12,400 levels – a technical condition that increases the validity of the resistance level.

USDIDR II

Weekly scale price chart of the U.S. Dollar / Indonesian Rupiah

US DOLLAR/INDONESIAN RUPIAH

 USDIDR

Indonesian rupiah had its share from the weakness in emerging market currencies. Over the past two years Rupiah weakened against the U.S. dollar similar to earlier price depreciation that took the cross rate from the lower boundary of its long-term consolidation to test the upper boundary. Fluctuations were between 8,300 and 12,400 levels. It is now the 4th time that the USD/IDR is testing its decade-long trend resistance. Price chart suggests Rupiah strength against the U.S. dollar, should the history repeats itself. Until we see a decisive breakout above 12,400 levels, we should expect reversion to the mean – a breath-taking period after the sharp depreciation in IDR.

USD/ZAR & USD/IDR

ZAR

IDR

Emerging market currencies are going through challenging times as they lose ground against the U.S. dollar. After two decades of massive depreciation against the U.S. dollar (1980-2000), most of the EM currencies stabilized and started moving sideways in a wide range. Latest sell-off pushed the cross rates to test their upper boundaries. South African Rand reached the upper boundary of its contracting range (possibly a symmetrical triangle) and Indonesian Rupiah the upper boundary of its flat consolidation range. The question now is whether the decade long consolidations will resume or will be followed by strong breakouts. These long-term charts should be on our watch-list in the following months.