U.S. JOBLESS CLAIMS
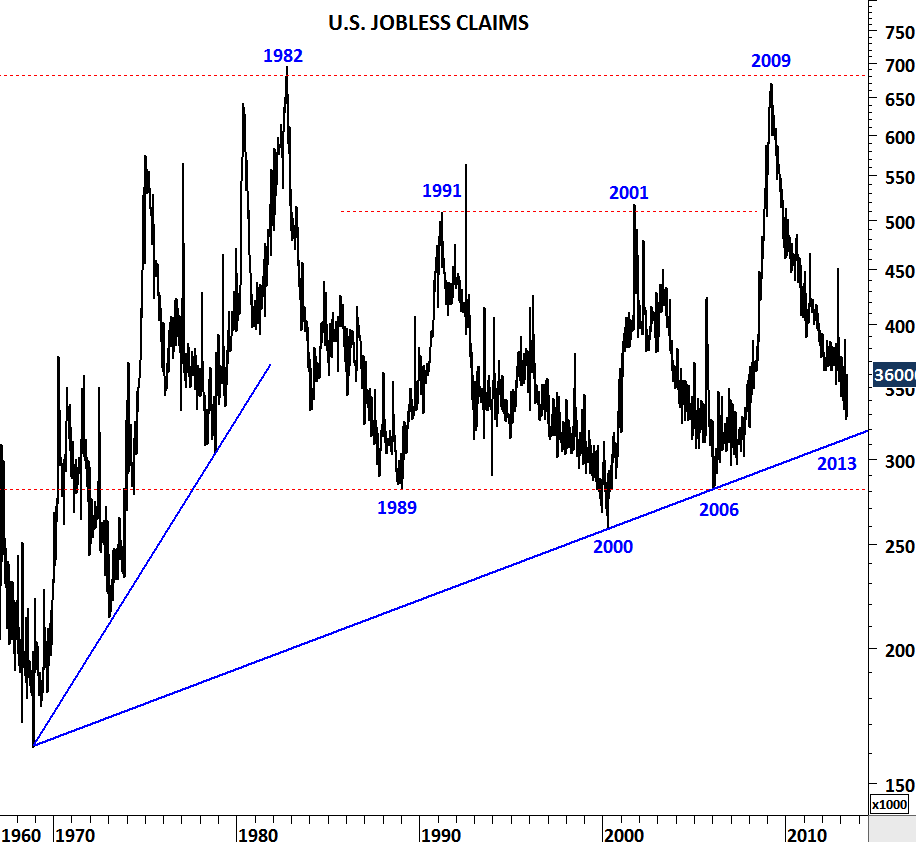
U.S. jobless claims spiked higher in the May 11 week, up 32,000 reaching 360,000. Earlier analysis showed a long-term chart of the weekly jobless claims, reaching strong support levels. Over the past 4 years jobless claims moved from one extreme to another.
EUR/USD
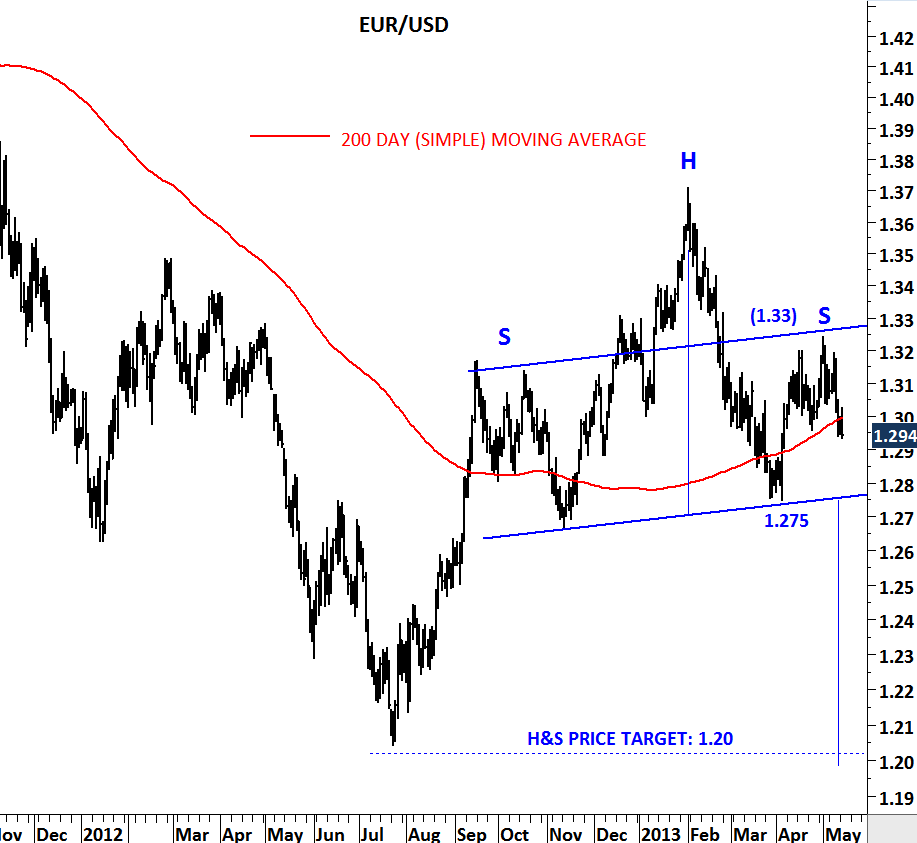
Many people must have seen the latest H&S chart pattern on the EUR/USD. If you haven’t seen it above is the price chart of the EUR/USD with its 200 day simple moving average. H&S patterns do fail. Reversal above the right shoulder (1.33 level) would result in a failed H&S pattern. If there is no failure then there will be a confirmation of the H&S pattern by a breakout above or below the neckline; in this case 1.2750. It is clear that there is weakness in the euro. Or in other words strength in U.S. dollar against major currencies. Weakness in EUR can continue in the following days. Breakdown below 1.2750 will confirm the head and shoulder chart pattern and will set a price target of 1.20 levels. If EUR/USD reverses from these levels and breaches 1.33 on the upside, then the target in the following weeks becomes 1.37.
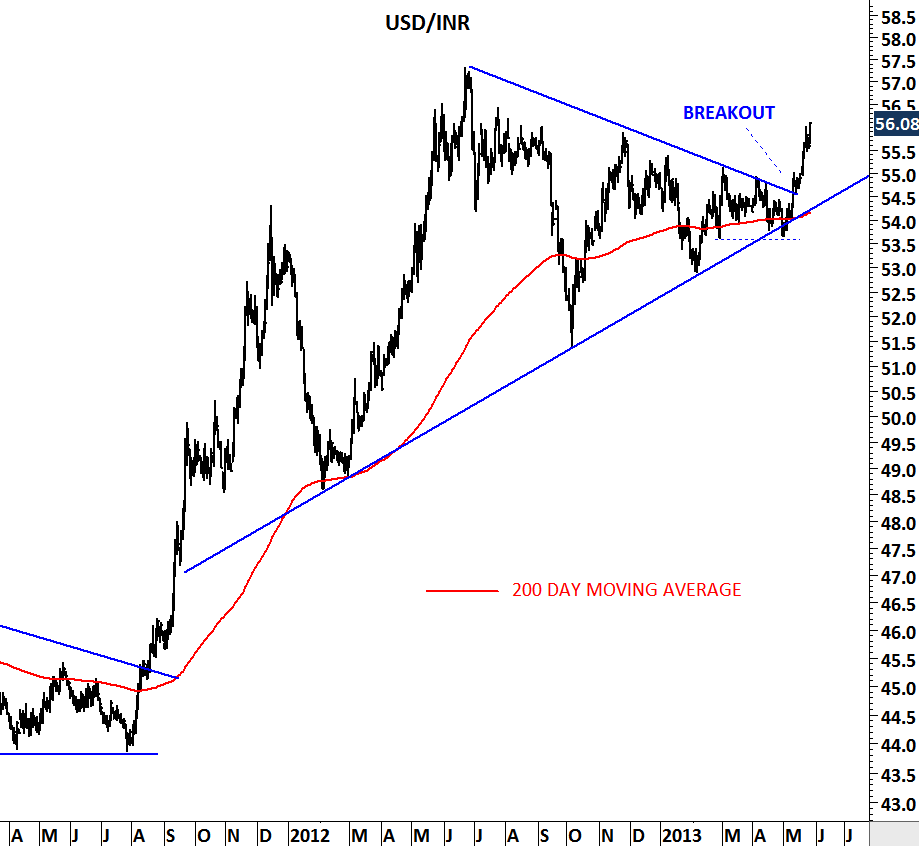
USD/INR (U.S. DOLLAR/INDIAN RUPEE)
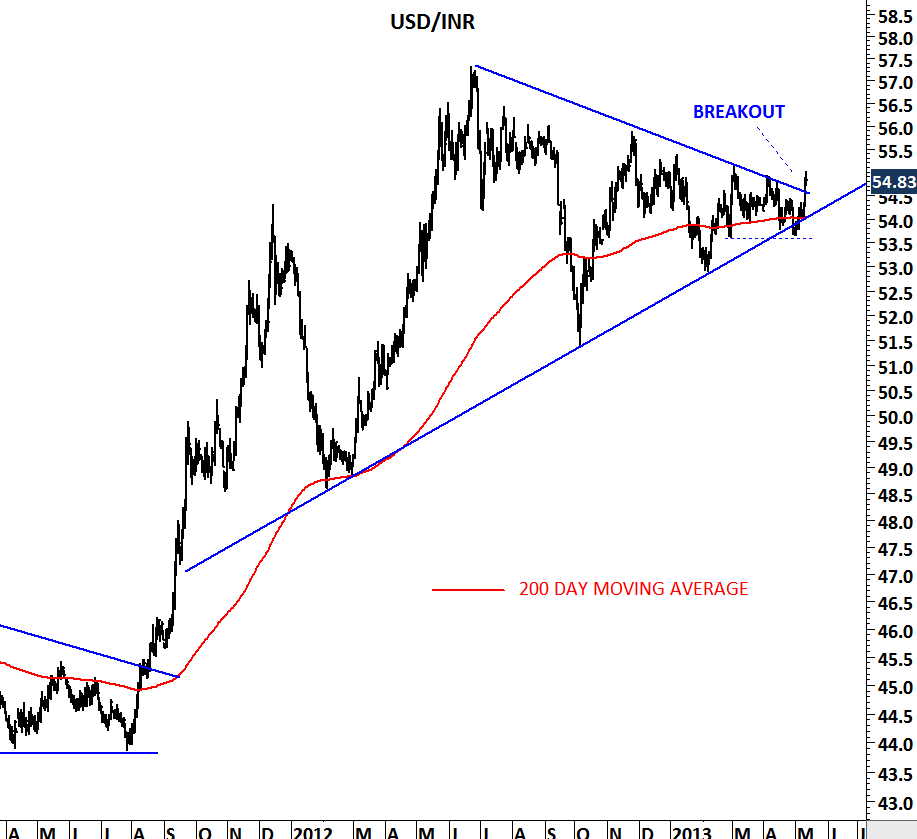
Another emerging market currency that is weakening against the U.S. dollar is Indian rupee. Recent update on the 7th of May drew attention to the possibility of a strong breakout from the low volatility period. USD/INR is now close to 55 levels; last minor resistance before the cross rate targets 56-58 area. Technical outlook is bullish for the U.S. dollar.
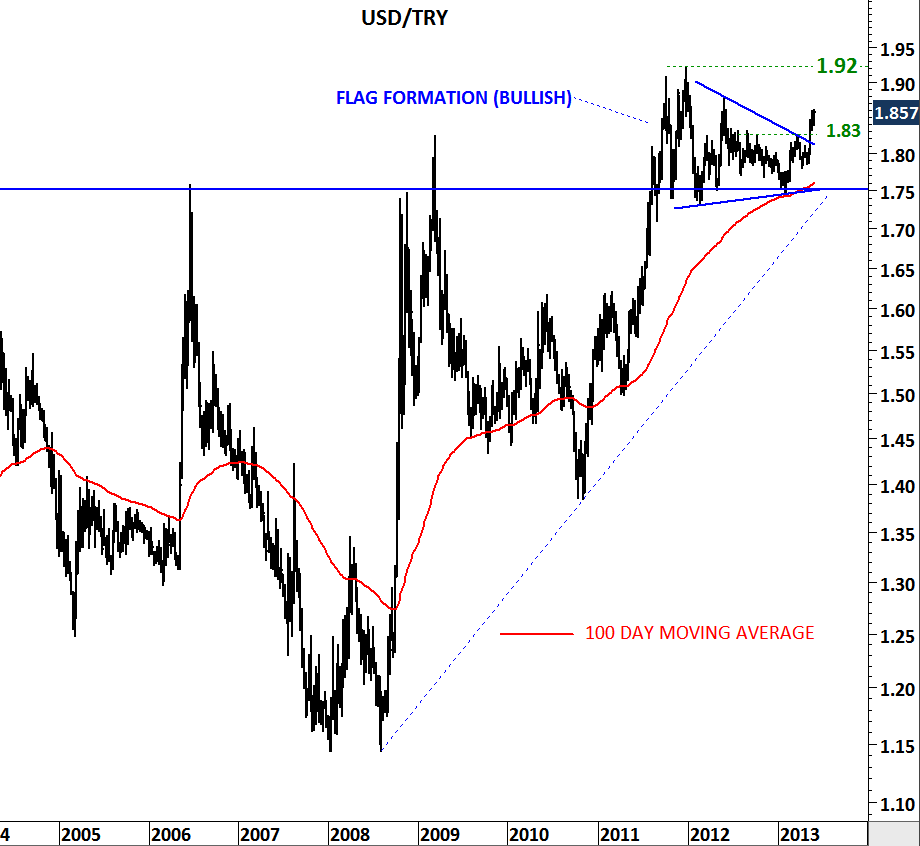
USD/TRY (U.S. DOLLAR/TURKISH LIRA)

U.S. dollar is gaining strength against most of the developed and emerging market currencies. I analyzed USD/TRY in the previous updates and drew attention to the bullish outlook on the dollar versus Turkish Lira. In mid-2011, cross rate broke above 1.75 levels and since then it has been consolidating between 1.75 and 1.90. Last year’s consolidation appears to be a flag formation; usually considered to be a bullish continuation pattern. As long as 1.75 holds as a medium-term support, breakout to higher levels will remain likely. Breakout above 1.83 levels could initiate another upward spike on the USD/TRY towards 1.92 levels.
SRI LANKA COLOMBO ALL SHARE INDEX
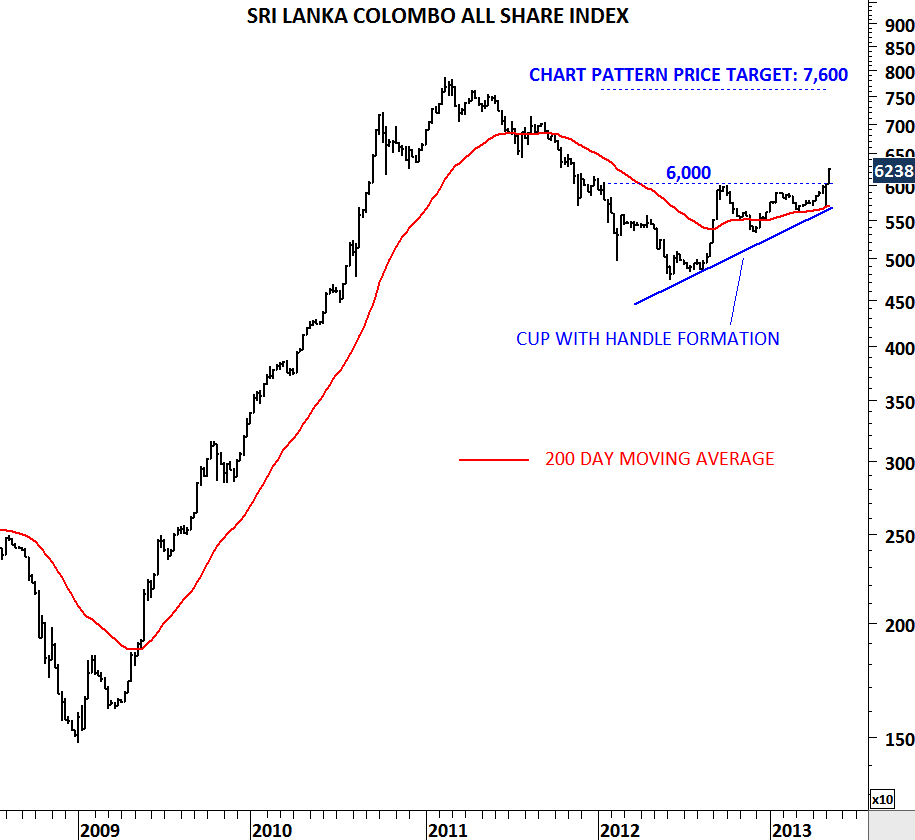
Between 2009 and 2011, Sri Lanka’s COLOMBO ALL SHARE INDEX was one of the best performing equity markets. Since mid-2011 this market has lagged the global equities and its peers in the frontier markets. Now the index is completing a perfect chart formation; cup with handle. Cup with handle formation is considered to be a bullish continuation pattern. Price target is usually calculated by taking the width of the chart formation and adding it to the breakout level. This leaves us with a price target of 7,650. Bullish technical outlook is confirmed after the breakout above 6,000 levels.
LUMBER
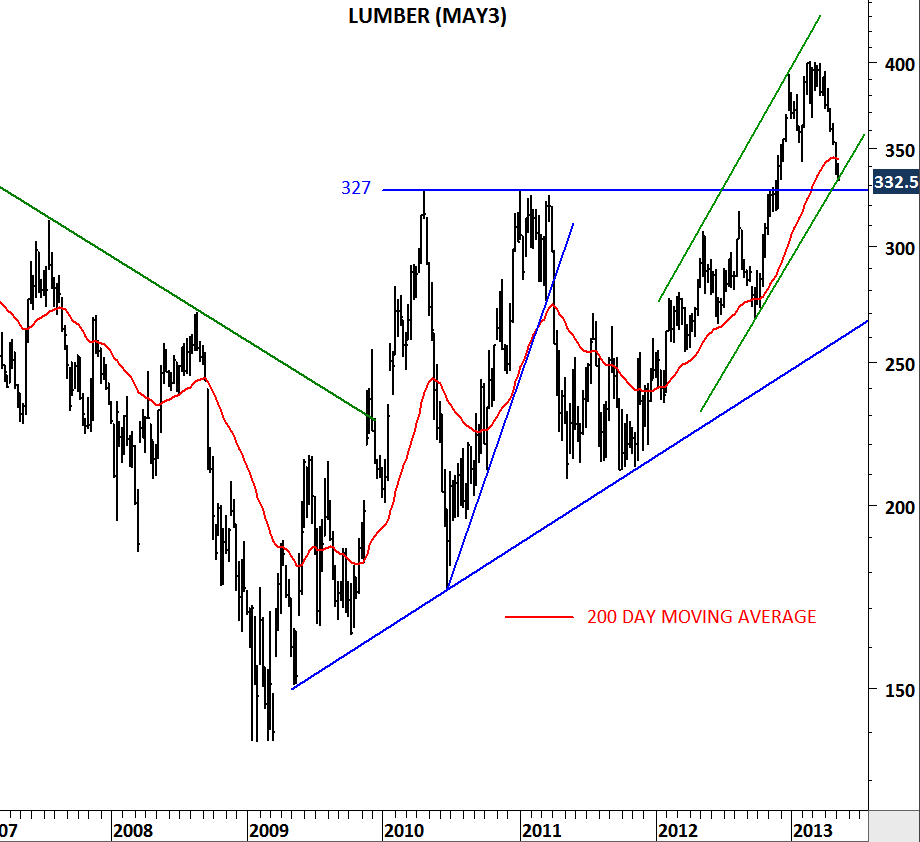
In December 2012 we have seen Lumber price clearing the strong horizontal resistance at 330 levels. Breakout was followed by a sharp rise towards 400 levels in less than two months. Since March 2013, Lumber has been pulling back to the previously broken support/resistance area. Price should find support between 330 and 340 levels and rebound once again. The lower boundary of the last one year’s uptrend, 200 day moving average and horizontal trend line are all forming support between 330 and 340 levels.
U.S. JOBLESS CLAIMS
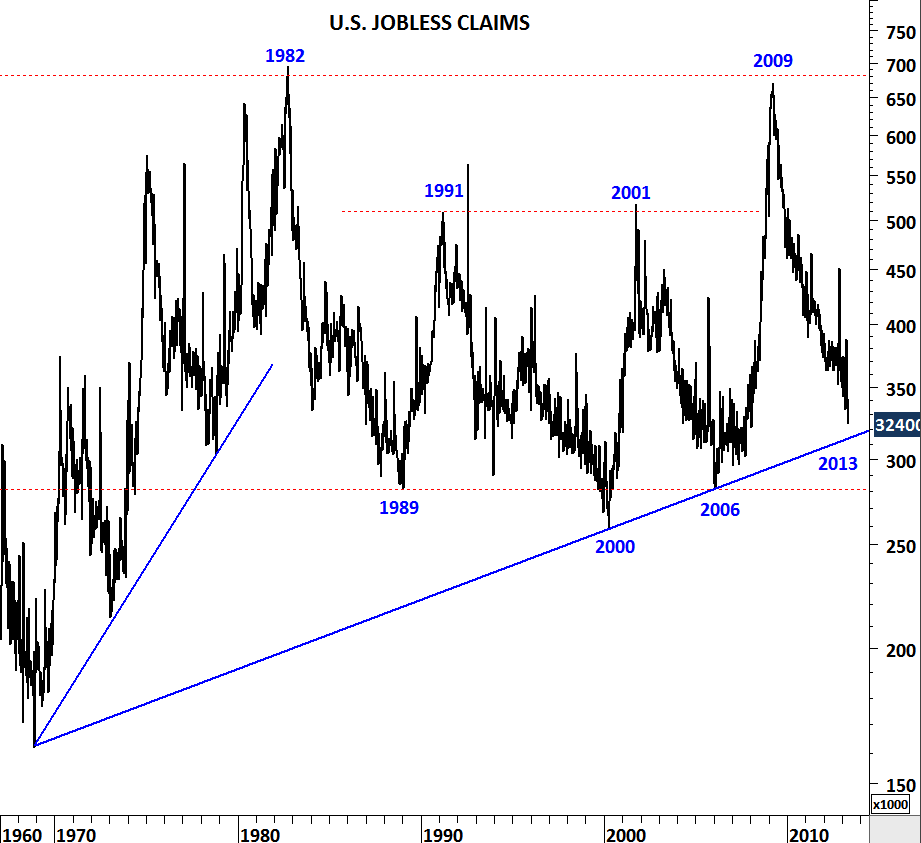
Latest data on unemployment and jobless claims were welcomed by the financial media and helped equity markets gain momentum. Weekly jobless claims data is now at an important support. Will it reverse from here? We don’t know yet but if we see signs of reversal in the following weeks, resulting in worse than expected job numbers then we will conclude that the trend line is valid and this could be a major turning point similar to year 2000 and 2006. An interesting chart to watch in the following weeks…
USD/INR (U.S. DOLLAR/INDIAN RUPEE)
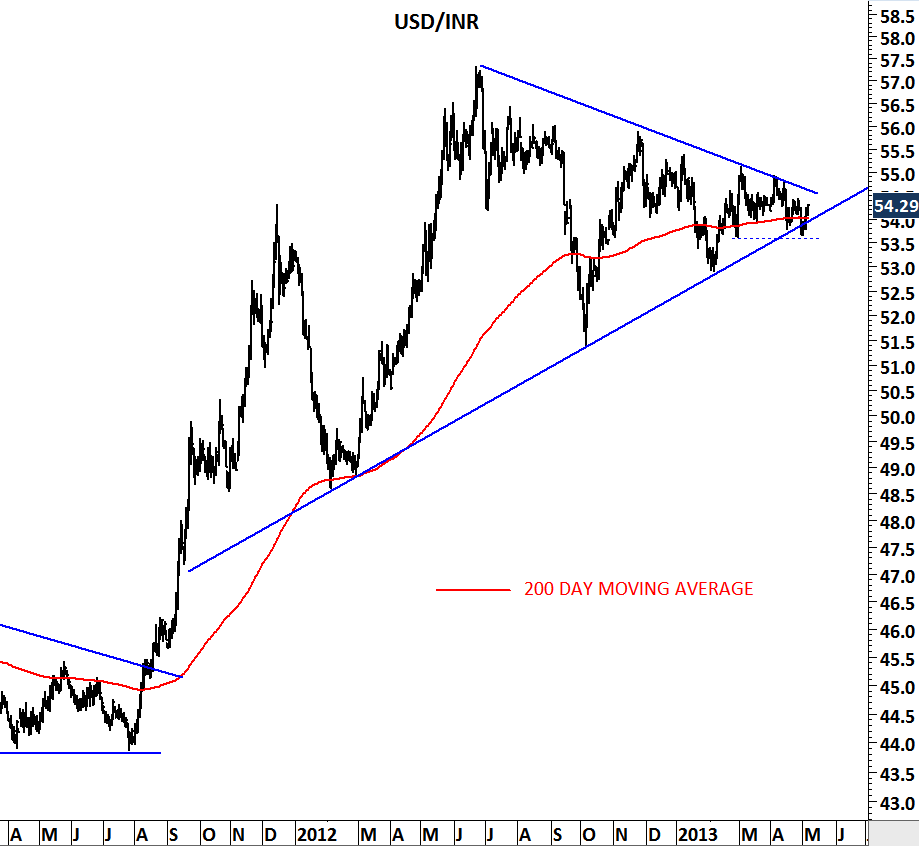
Breakouts from contracting ranges are usually very powerful. The longer the consolidation period the more powerful the breakout is. In the case of USD/INR we are getting closer to a strong breakout from the year-long consolidation range. Breakout above 55 levels will be bullish for the U.S. Dollar and will target 57-58 area on the price chart. Breakdown below 53.50 will be bullish for the Rupee and will be followed by a directional move towards 50-51 area. Levels to watch; 55 as resistance and 53.50 as support.
OATS (JUL3)
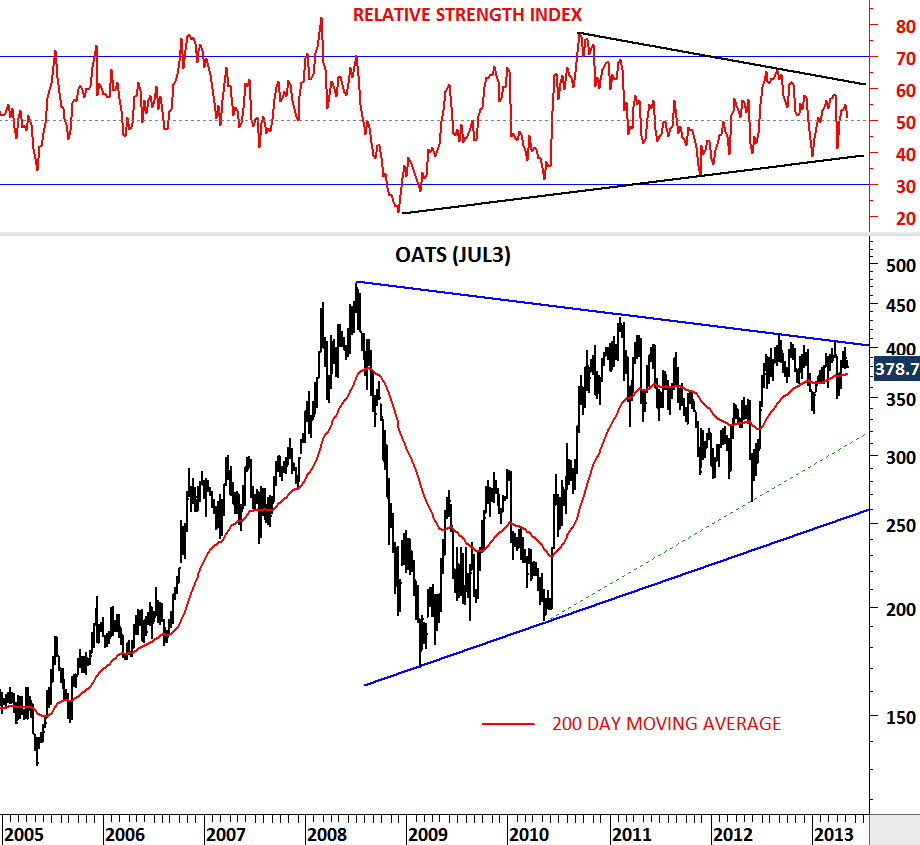
One of the most exciting chart pattern in grains market is in Oats July 2013 futures contract. This massive symmetrical triangle is likely to break upwards with strong momentum. I posted similar chart patterns earlier on Soy Meal, GBP and Copper. All of them formed perfect symmetrical triangles and were followed by strong breakouts. Oats is a good candidate for a medium/long-term directional move. Breakout above 400 levels will generate a buy signal and medium-term stop-loss will stand at 350 levels.
In Association with:

Latest Posts
 GLOBAL EQUITY MARKETS – May 4, 2024May 4, 2024 - 11:12 am
 CRYPTOCURRENCIES – April 28, 2024April 28, 2024 - 9:09 pm
 GLOBAL EQUITY MARKETS – April 27, 2024April 27, 2024 - 7:23 am
 CHINA SSE 50 INDEXApril 23, 2024 - 1:42 pm
As Seen On:
